Hallandale Beach, FL Investment Properties for Sale
Browse homes for sale and investment properties in Hallandale Beach, FL. Refine your search by price, property type, or more.
Best cash flowing properties in Hallandale Beach, FL

Active
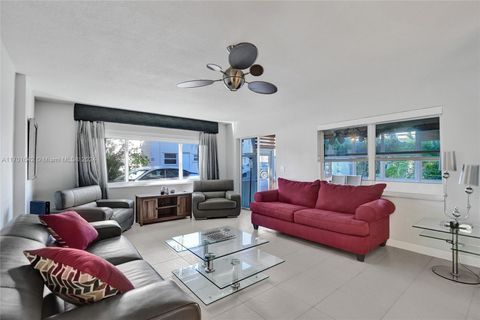
$375,000
2
bds
|
2
ba
|
1,340
sqft
|
built
1972
1985 S Ocean Dr, Hallandale Beach, FL 33009
$248
Cash flow
3.5%
Cash-on-Cash Return
6.9%
Cap rate
1.0%
Rent to Value Ratio
Active
$199,000
1
bds
|
1
ba
|
730
sqft
|
built
1972
500 NE 12th Ave, Hallandale Beach, FL 33009
$-192
Cash flow
-5.0%
Cash-on-Cash Return
5.0%
Cap rate
1.2%
Rent to Value Ratio
734 out of 827 properties for sale in Hallandale Beach, FL
Limited Results Shown
Create a free account, or log in to reveal all property listings and enjoy the complete experience.
Active
$199,000
1
bds
|
1
ba
|
820
sqft
|
built
1974
851 Three Islands Blvd, Hallandale Beach, FL 33009
$-534
Cash flow
-14.0%
Cash-on-Cash Return
2.9%
Cap rate
1.0%
Rent to Value Ratio

Active
$329,000
2
bds
|
2
ba
|
1,380
sqft
|
built
1972
1985 S Ocean Dr, Hallandale Beach, FL 33009
$-1,478
Cash flow
-23.4%
Cash-on-Cash Return
0.8%
Cap rate
0.9%
Rent to Value Ratio

Active
$489,000
2
bds
|
2
ba
|
1,222
sqft
|
built
1979
3140 S Ocean Dr, Hallandale Beach, FL 33009
$-1,984
Cash flow
-21.2%
Cash-on-Cash Return
1.3%
Cap rate
0.7%
Rent to Value Ratio

Active
$391,750
1
bds
|
2
ba
|
870
sqft
|
built
1972
1980 S Ocean Dr, Hallandale Beach, FL 33009
$-455
Cash flow
-6.1%
Cash-on-Cash Return
4.8%
Cap rate
0.7%
Rent to Value Ratio

Active
$400,000
2
bds
|
2
ba
|
1,200
sqft
|
built
1970
1849 S Ocean Dr, Hallandale Beach, FL 33009
$-1,548
Cash flow
-20.2%
Cash-on-Cash Return
1.5%
Cap rate
0.7%
Rent to Value Ratio

Active
$500,000
3
bds
|
3
ba
|
1,740
sqft
|
built
1972
1985 S Ocean Dr, Hallandale Beach, FL 33009
$-1,742
Cash flow
-18.2%
Cash-on-Cash Return
2.0%
Cap rate
0.8%
Rent to Value Ratio

Active
$319,000
2
bds
|
2
ba
|
1,135
sqft
|
built
1973
400 Diplomat Pkwy, Hallandale Beach, FL 33009
$-917
Cash flow
-15.0%
Cash-on-Cash Return
2.7%
Cap rate
0.9%
Rent to Value Ratio

Active
$339,900
1
bds
|
1
ba
|
900
sqft
|
built
1979
3140 S Ocean Dr, Hallandale Beach, FL 33009
$-1,206
Cash flow
-18.5%
Cash-on-Cash Return
1.9%
Cap rate
0.7%
Rent to Value Ratio

Active
$547,000
2
bds
|
2
ba
|
1,150
sqft
|
built
2004
201 Golden Isles Dr, Hallandale Beach, FL 33009
$-2,021
Cash flow
-19.3%
Cash-on-Cash Return
1.7%
Cap rate
0.5%
Rent to Value Ratio

Active
$280,000
2
bds
|
2
ba
|
1,020
sqft
|
built
1964
450 Golden Isles Dr, Hallandale Beach, FL 33009
$-952
Cash flow
-17.7%
Cash-on-Cash Return
2.1%
Cap rate
0.8%
Rent to Value Ratio

Active
$439,000
2
bds
|
2
ba
|
1,430
sqft
|
built
1976
1000 Parkview Dr, Hallandale Beach, FL 33009
$-403
Cash flow
-4.8%
Cash-on-Cash Return
5.0%
Cap rate
0.8%
Rent to Value Ratio

Active
$459,800
1
bds
|
2
ba
|
832
sqft
|
built
1972
3180 S Ocean Dr, Hallandale Beach, FL 33009
$-1,646
Cash flow
-18.7%
Cash-on-Cash Return
1.9%
Cap rate
0.8%
Rent to Value Ratio
Active
$379,000
2
bds
|
2
ba
|
1,443
sqft
|
built
1969
1825 S Ocean Dr, Hallandale Beach, FL 33009
$-1,349
Cash flow
-18.6%
Cash-on-Cash Return
1.9%
Cap rate
0.8%
Rent to Value Ratio
Active
$378,000
1
bds
|
2
ba
|
1,300
sqft
|
built
1974
1865 S Ocean Dr, Hallandale Beach, FL 33009
$-1,129
Cash flow
-15.6%
Cash-on-Cash Return
2.6%
Cap rate
0.8%
Rent to Value Ratio

Active
$469,000
2
bds
|
2
ba
|
1,710
sqft
|
built
1974
1865 S Ocean Dr, Hallandale Beach, FL 33009
$-2,478
Cash flow
-27.6%
Cash-on-Cash Return
-0.2%
Cap rate
0.6%
Rent to Value Ratio

Active
$425,998
2
bds
|
2
ba
|
1,280
sqft
|
built
1981
2500 Parkview Dr, Hallandale Beach, FL 33009
$-1,687
Cash flow
-20.7%
Cash-on-Cash Return
1.4%
Cap rate
0.8%
Rent to Value Ratio

Active
$1,825,000
3
bds
|
4
ba
|
2,078
sqft
|
built
2006
1800 S Ocean Dr, Hallandale Beach, FL 33009
$-7,273
Cash flow
-20.8%
Cash-on-Cash Return
1.4%
Cap rate
0.4%
Rent to Value Ratio

Active
$239,000
1
bds
|
2
ba
|
850
sqft
|
built
1970
300 Diplomat Pkwy, Hallandale Beach, FL 33009
$-899
Cash flow
-19.6%
Cash-on-Cash Return
1.6%
Cap rate
1.0%
Rent to Value Ratio
Active
$464,000
2
bds
|
2
ba
|
1,081
sqft
|
built
2007
1755 E Hallandale Beach Blvd, Hallandale Beach, FL 33009
$-1,510
Cash flow
-17.0%
Cash-on-Cash Return
2.2%
Cap rate
0.8%
Rent to Value Ratio

Active
$379,900
2
bds
|
2
ba
|
1,580
sqft
|
built
1980
2500 Parkview Dr, Hallandale Beach, FL 33009
$-1,164
Cash flow
-16.0%
Cash-on-Cash Return
2.5%
Cap rate
0.9%
Rent to Value Ratio

Active
$305,000
2
bds
|
2
ba
|
1,100
sqft
|
built
1972
1833 S Ocean Dr, Hallandale Beach, FL 33009
$-1,238
Cash flow
-21.2%
Cash-on-Cash Return
1.3%
Cap rate
0.8%
Rent to Value Ratio
Active
$310,000
2
bds
|
2
ba
|
1,150
sqft
|
built
1970
200 Diplomat Pkwy, Hallandale Beach, FL 33009
$-1,242
Cash flow
-20.9%
Cash-on-Cash Return
1.3%
Cap rate
0.8%
Rent to Value Ratio
Active
$385,000
3
bds
|
2
ba
|
1,379
sqft
|
built
1970
121 Golden Isles Dr, Hallandale Beach, FL 33009
$-1,566
Cash flow
-21.2%
Cash-on-Cash Return
1.3%
Cap rate
0.8%
Rent to Value Ratio
Active
$350,000
2
bds
|
2
ba
|
1,280
sqft
|
built
1978
2500 Parkview Dr, Hallandale Beach, FL 33009
$-1,769
Cash flow
-26.4%
Cash-on-Cash Return
0.1%
Cap rate
0.7%
Rent to Value Ratio

Active
$374,000
2
bds
|
2
ba
|
1,150
sqft
|
built
1970
200 Diplomat Pkwy, Hallandale Beach, FL 33009
$-1,400
Cash flow
-19.5%
Cash-on-Cash Return
1.7%
Cap rate
0.7%
Rent to Value Ratio
Active
$359,000
2
bds
|
2
ba
|
1,300
sqft
|
built
1970
401 Golden Isles Dr, Hallandale Beach, FL 33009
$-1,545
Cash flow
-22.5%
Cash-on-Cash Return
1.0%
Cap rate
0.8%
Rent to Value Ratio

Active
$488,000
2
bds
|
3
ba
|
1,696
sqft
|
built
1977
2408 NE 10th St, Hallandale Beach, FL 33009
$-1,854
Cash flow
-19.8%
Cash-on-Cash Return
1.6%
Cap rate
0.7%
Rent to Value Ratio
Active
$375,000
2
bds
|
2
ba
|
1,340
sqft
|
built
1972
1985 S Ocean Dr, Hallandale Beach, FL 33009
$248
Cash flow
3.5%
Cash-on-Cash Return
6.9%
Cap rate
1.0%
Rent to Value Ratio

Active
$249,999
2
bds
|
2
ba
|
945
sqft
|
built
1980
1913 S Ocean Dr, Hallandale Beach, FL 33009
$-857
Cash flow
-17.9%
Cash-on-Cash Return
2.0%
Cap rate
0.9%
Rent to Value Ratio

Active
$375,000
2
bds
|
2
ba
|
1,200
sqft
|
built
1970
1849 S Ocean Dr, Hallandale Beach, FL 33009
$-1,078
Cash flow
-15.0%
Cash-on-Cash Return
2.7%
Cap rate
0.9%
Rent to Value Ratio

Active
$359,900
1
bds
|
2
ba
|
896
sqft
|
built
1970
2030 S Ocean Dr, Hallandale Beach, FL 33009
$-2,000
Cash flow
-29.0%
Cash-on-Cash Return
-0.5%
Cap rate
0.6%
Rent to Value Ratio
Active
$359,500
2
bds
|
2
ba
|
1,176
sqft
|
built
1970
1825 S Ocean Dr, Hallandale Beach, FL 33009
$-1,504
Cash flow
-21.8%
Cash-on-Cash Return
1.1%
Cap rate
0.7%
Rent to Value Ratio
Active
$368,000
1
bds
|
1
ba
|
798
sqft
|
built
1970
1965 S Ocean Dr, Hallandale Beach, FL 33009
$-1,279
Cash flow
-18.1%
Cash-on-Cash Return
2.0%
Cap rate
0.7%
Rent to Value Ratio
Active
$464,999
3
bds
|
2
ba
|
1,430
sqft
|
built
1979
600 Parkview Dr, Hallandale Beach, FL 33009
$-1,010
Cash flow
-11.3%
Cash-on-Cash Return
3.5%
Cap rate
0.8%
Rent to Value Ratio
Active
$299,900
2
bds
|
2
ba
|
1,025
sqft
|
built
1965
141 NE 10th Ave, Hallandale Beach, FL 33009
$-863
Cash flow
-15.0%
Cash-on-Cash Return
2.7%
Cap rate
0.8%
Rent to Value Ratio
Active
$479,000
2
bds
|
2
ba
|
1,425
sqft
|
built
2007
1745 E Hallandale Beach Blvd, Hallandale Beach, FL 33009
$-2,415
Cash flow
-26.3%
Cash-on-Cash Return
0.1%
Cap rate
0.7%
Rent to Value Ratio
Active
$199,000
1
bds
|
1
ba
|
730
sqft
|
built
1972
500 NE 12th Ave, Hallandale Beach, FL 33009
$-192
Cash flow
-5.0%
Cash-on-Cash Return
5.0%
Cap rate
1.2%
Rent to Value Ratio

Active
$320,000
1
bds
|
2
ba
|
1,300
sqft
|
built
1974
1865 S Ocean Dr, Hallandale Beach, FL 33009
$-1,177
Cash flow
-19.2%
Cash-on-Cash Return
1.7%
Cap rate
0.9%
Rent to Value Ratio
Active
$359,000
1
bds
|
2
ba
|
950
sqft
|
built
1980
2500 Parkview Dr, Hallandale Beach, FL 33009
$-1,393
Cash flow
-20.2%
Cash-on-Cash Return
1.5%
Cap rate
0.7%
Rent to Value Ratio
Active
$290,000
1
bds
|
2
ba
|
850
sqft
|
built
1970
300 Diplomat Pkwy, Hallandale Beach, FL 33009
$-1,078
Cash flow
-19.4%
Cash-on-Cash Return
1.7%
Cap rate
0.9%
Rent to Value Ratio