Hallandale Beach, FL Investment Properties for Sale
Browse homes for sale and investment properties in Hallandale Beach, FL. Refine your search by price, property type, or more.
Best cash flowing properties in Hallandale Beach, FL
Active
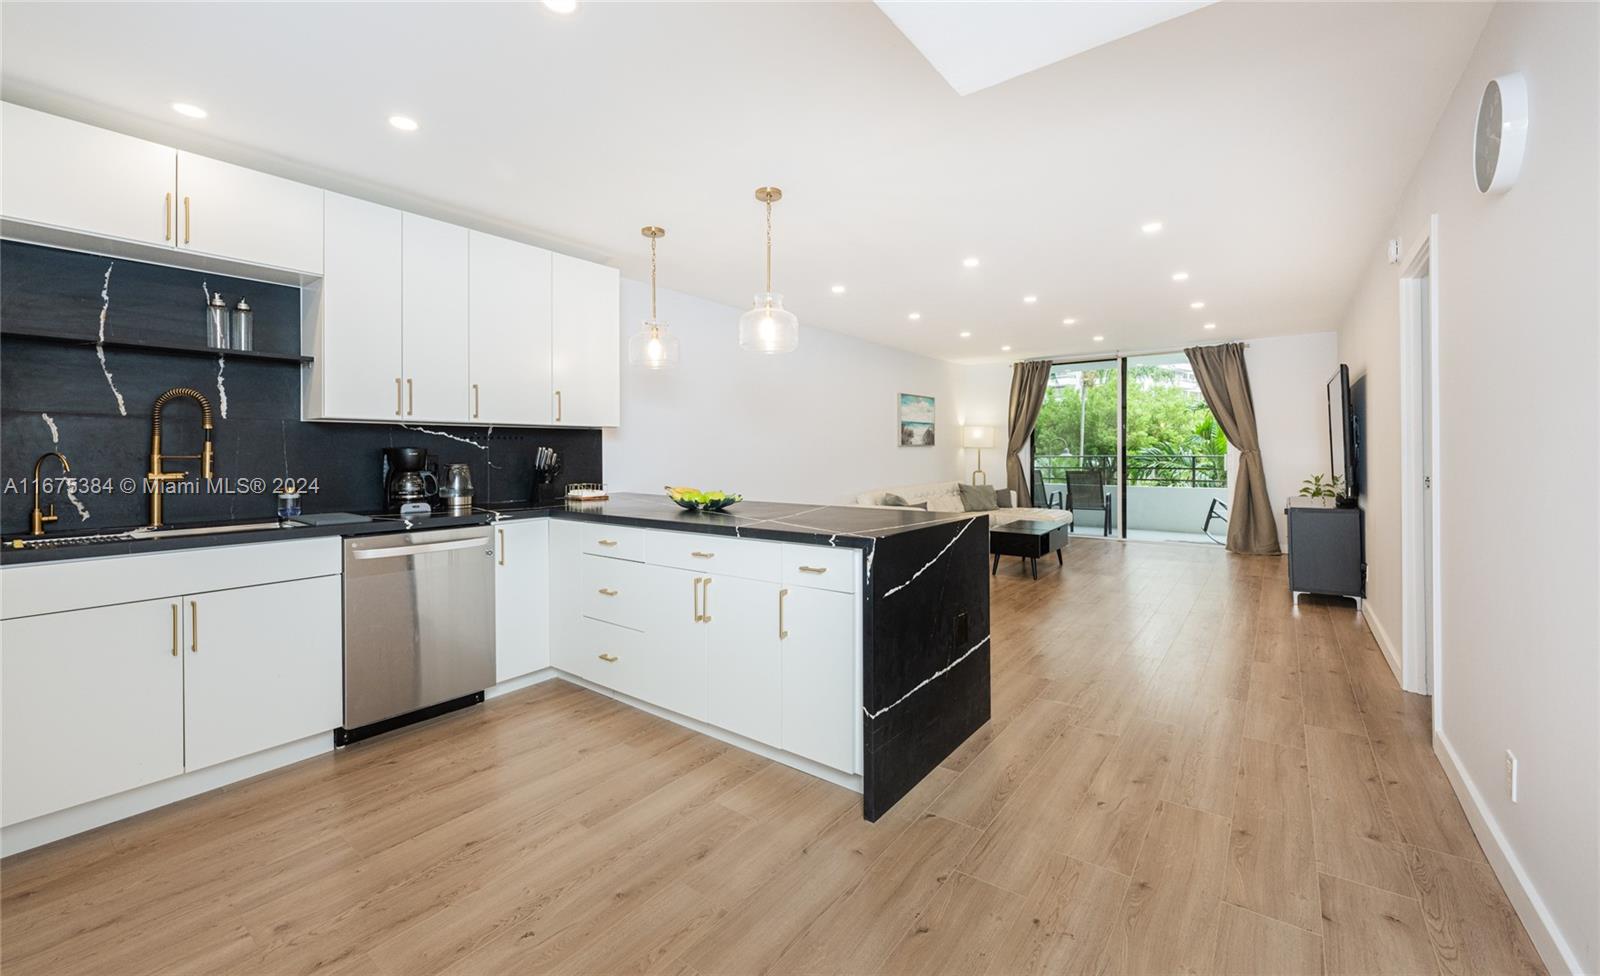
$299,000
2
bds
|
2
ba
|
1,090
sqft
|
built
1971
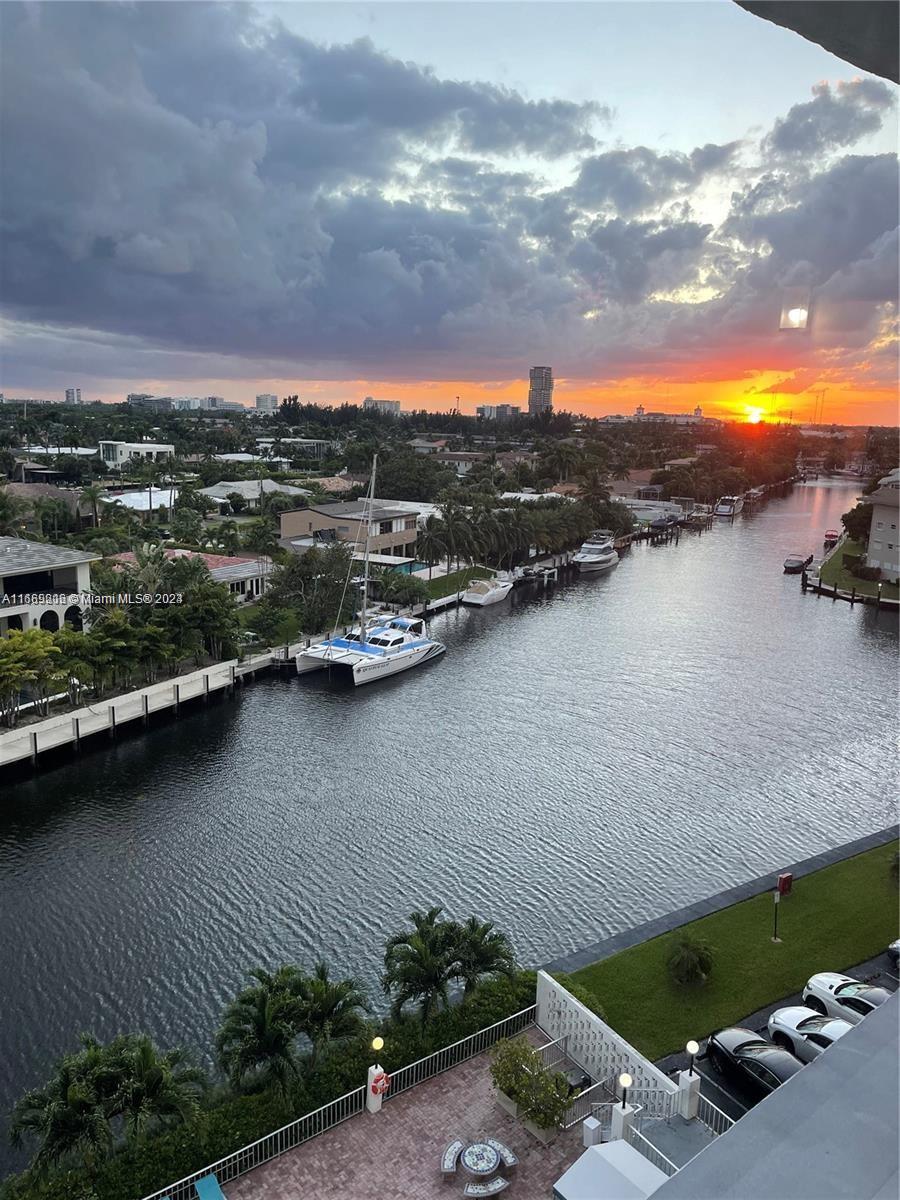
3161 S Ocean Dr, Hallandale Beach, FL 33009
$-225
Cash flow
-3.9%
Cash-on-Cash Return
5.2%
Cap rate
0.8%
Rent to Value Ratio
Active
$235,000
2
bds
|
2
ba
|
1,092
sqft
|
built
1968
219 NE 14th Ave, Hallandale Beach, FL 33009
$-522
Cash flow
-11.6%
Cash-on-Cash Return
3.5%
Cap rate
0.9%
Rent to Value Ratio
833 out of 931 properties for sale in Hallandale Beach, FL
Limited Results Shown
Create a free account, or log in to reveal all property listings and enjoy the complete experience.
Active
$2,300,000
3
bds
|
3
ba
|
1,841
sqft
|
built
2005
1850 S Ocean Dr, Hallandale Beach, FL 33009
$-7,719
Cash flow
-17.5%
Cash-on-Cash Return
2.1%
Cap rate
0.4%
Rent to Value Ratio
Active
$679,500
1
bds
|
1
ba
|
871
sqft
|
built
2006
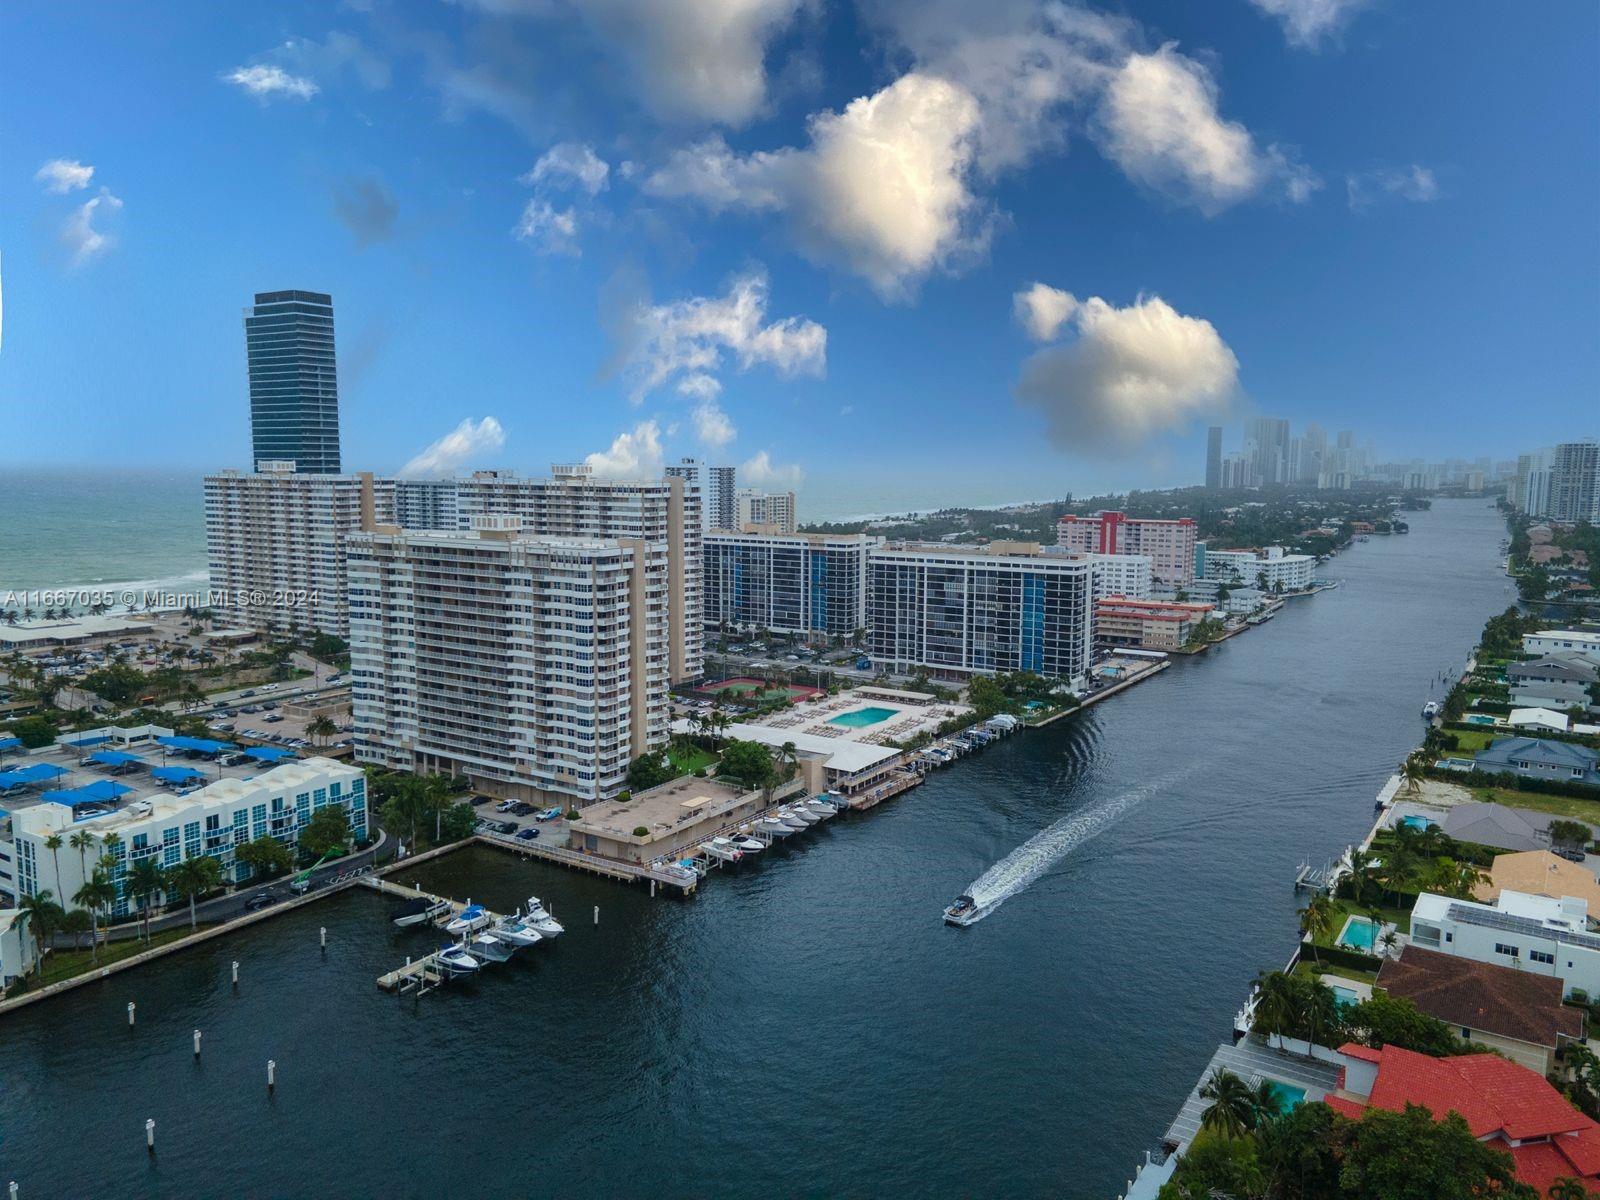
1830 S Ocean Dr, Hallandale Beach, FL 33009
$-2,524
Cash flow
-19.4%
Cash-on-Cash Return
1.7%
Cap rate
0.5%
Rent to Value Ratio
Active
$549,000
2
bds
|
2
ba
|
1,430
sqft
|
built
1976
1000 Parkview Dr, Hallandale Beach, FL 33009
$-2,148
Cash flow
-20.4%
Cash-on-Cash Return
1.5%
Cap rate
0.7%
Rent to Value Ratio
Active
$1,100,000
3
bds
|
3
ba
|
1,571
sqft
|
built
2007
1800 S Ocean Dr, Hallandale Beach, FL 33009
$-4,469
Cash flow
-21.2%
Cash-on-Cash Return
1.3%
Cap rate
0.5%
Rent to Value Ratio

Active
$431,000
1
bds
|
2
ba
|
875
sqft
|
built
2007
1945 S Ocean Dr, Hallandale Beach, FL 33009
$-1,669
Cash flow
-20.2%
Cash-on-Cash Return
1.5%
Cap rate
0.6%
Rent to Value Ratio
Active
$249,900
1
bds
|
1
ba
|
720
sqft
|
built
1965
700 Layne Blvd, Hallandale Beach, FL 33009
$-784
Cash flow
-16.4%
Cash-on-Cash Return
2.4%
Cap rate
0.8%
Rent to Value Ratio

Active
$250,000
1
bds
|
1
ba
|
700
sqft
|
built
1980
1913 S Ocean Dr, Hallandale Beach, FL 33009
$-600
Cash flow
-12.5%
Cash-on-Cash Return
3.3%
Cap rate
0.9%
Rent to Value Ratio
Active
$390,000
2
bds
|
2
ba
|
1,190
sqft
|
built
1980
462 Golden Isles Dr, Hallandale Beach, FL 33009
$-1,128
Cash flow
-15.1%
Cash-on-Cash Return
2.7%
Cap rate
0.7%
Rent to Value Ratio

Active
$179,999
1
bds
|
2
ba
|
1,071
sqft
|
built
1968
851 NE 14th Ave, Hallandale Beach, FL 33009
$-657
Cash flow
-19.0%
Cash-on-Cash Return
1.8%
Cap rate
1.0%
Rent to Value Ratio
Active
$321,000
1
bds
|
2
ba
|
1,000
sqft
|
built
1975
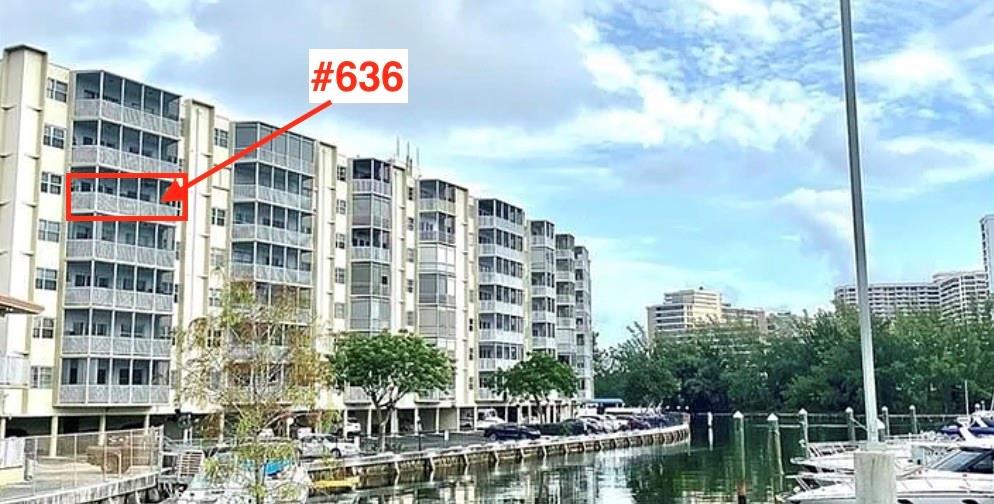
600 Three Islands Blvd, Hallandale Beach, FL 33009
$-1,307
Cash flow
-21.2%
Cash-on-Cash Return
1.3%
Cap rate
0.7%
Rent to Value Ratio
Active
$749,000
2
bds
|
2
ba
|
1,000
sqft
|
built
2002
2080 S Ocean Dr, Hallandale Beach, FL 33009
$-2,747
Cash flow
-19.1%
Cash-on-Cash Return
1.7%
Cap rate
0.6%
Rent to Value Ratio
Active
$735,000
3
bds
|
3
ba
|
1,941
sqft
|
built
2004
232 SW 7th Ave, Hallandale Beach, FL 33009
$-1,810
Cash flow
-12.8%
Cash-on-Cash Return
3.2%
Cap rate
0.6%
Rent to Value Ratio
Active
$255,000
1
bds
|
1
ba
|
798
sqft
|
built
1970
1965 S Ocean Dr, Hallandale Beach, FL 33009
$-785
Cash flow
-16.1%
Cash-on-Cash Return
2.5%
Cap rate
0.9%
Rent to Value Ratio

Active
$997,000
3
bds
|
3
ba
|
1,737
sqft
|
built
2015
2600 E Hallandale Beach Blvd, Hallandale Beach, FL 33009
$-2,984
Cash flow
-15.6%
Cash-on-Cash Return
2.6%
Cap rate
0.6%
Rent to Value Ratio
Active
$399,000
2
bds
|
2
ba
|
1,420
sqft
|
built
1973
100 Golden Isles Dr, Hallandale Beach, FL 33009
$-1,402
Cash flow
-18.3%
Cash-on-Cash Return
1.9%
Cap rate
0.7%
Rent to Value Ratio
Active
$325,000
1
bds
|
2
ba
|
920
sqft
|
built
2007
1745 E Hallandale Beach Blvd, Hallandale Beach, FL 33009
$-1,072
Cash flow
-17.2%
Cash-on-Cash Return
2.2%
Cap rate
0.9%
Rent to Value Ratio
Active
$285,000
1
bds
|
2
ba
|
915
sqft
|
built
1976
800 Parkview Dr, Hallandale Beach, FL 33009
$-937
Cash flow
-17.2%
Cash-on-Cash Return
2.2%
Cap rate
0.9%
Rent to Value Ratio
Active
$299,000
2
bds
|
2
ba
|
1,090
sqft
|
built
1971
3161 S Ocean Dr, Hallandale Beach, FL 33009
$-225
Cash flow
-3.9%
Cash-on-Cash Return
5.2%
Cap rate
0.8%
Rent to Value Ratio

Active
$320,000
2
bds
|
2
ba
|
1,092
sqft
|
built
1972
420 NE 12th Ave, Hallandale Beach, FL 33009
$-730
Cash flow
-11.9%
Cash-on-Cash Return
3.4%
Cap rate
0.8%
Rent to Value Ratio
Active
$285,000
1
bds
|
2
ba
|
1,140
sqft
|
built
1974
500 Three Islands Blvd, Hallandale Beach, FL 33009
$-1,495
Cash flow
-27.4%
Cash-on-Cash Return
-0.1%
Cap rate
0.9%
Rent to Value Ratio
Active
$305,000
2
bds
|
2
ba
|
940
sqft
|
built
1980
1913 S Ocean Dr, Hallandale Beach, FL 33009
$-998
Cash flow
-17.1%
Cash-on-Cash Return
2.2%
Cap rate
0.8%
Rent to Value Ratio
Active
$235,000
2
bds
|
2
ba
|
1,092
sqft
|
built
1968
219 NE 14th Ave, Hallandale Beach, FL 33009
$-522
Cash flow
-11.6%
Cash-on-Cash Return
3.5%
Cap rate
0.9%
Rent to Value Ratio
Active
$224,000
2
bds
|
2
ba
|
1,070
sqft
|
built
1966
200 NE 12th Ave, Hallandale Beach, FL 33009
$-834
Cash flow
-19.4%
Cash-on-Cash Return
1.7%
Cap rate
1.0%
Rent to Value Ratio
Active
$430,000
2
bds
|
2
ba
|
1,592
sqft
|
built
1984
300 Three Islands Blvd, Hallandale Beach, FL 33009
$-837
Cash flow
-10.2%
Cash-on-Cash Return
3.8%
Cap rate
0.9%
Rent to Value Ratio
Active
$645,000
1
bds
|
0
ba
|
1,500
sqft
|
built
1956
612 NW 2nd Ave, Hallandale Beach, FL 33009
$-2,599
Cash flow
-21.0%
Cash-on-Cash Return
1.3%
Cap rate
0.3%
Rent to Value Ratio
Active
$359,000
2
bds
|
2
ba
|
1,300
sqft
|
built
1970
401 Golden Isles Dr, Hallandale Beach, FL 33009
$-1,489
Cash flow
-21.6%
Cash-on-Cash Return
1.2%
Cap rate
0.8%
Rent to Value Ratio
Active
$525,000
3
bds
|
3
ba
|
1,396
sqft
|
built
1961
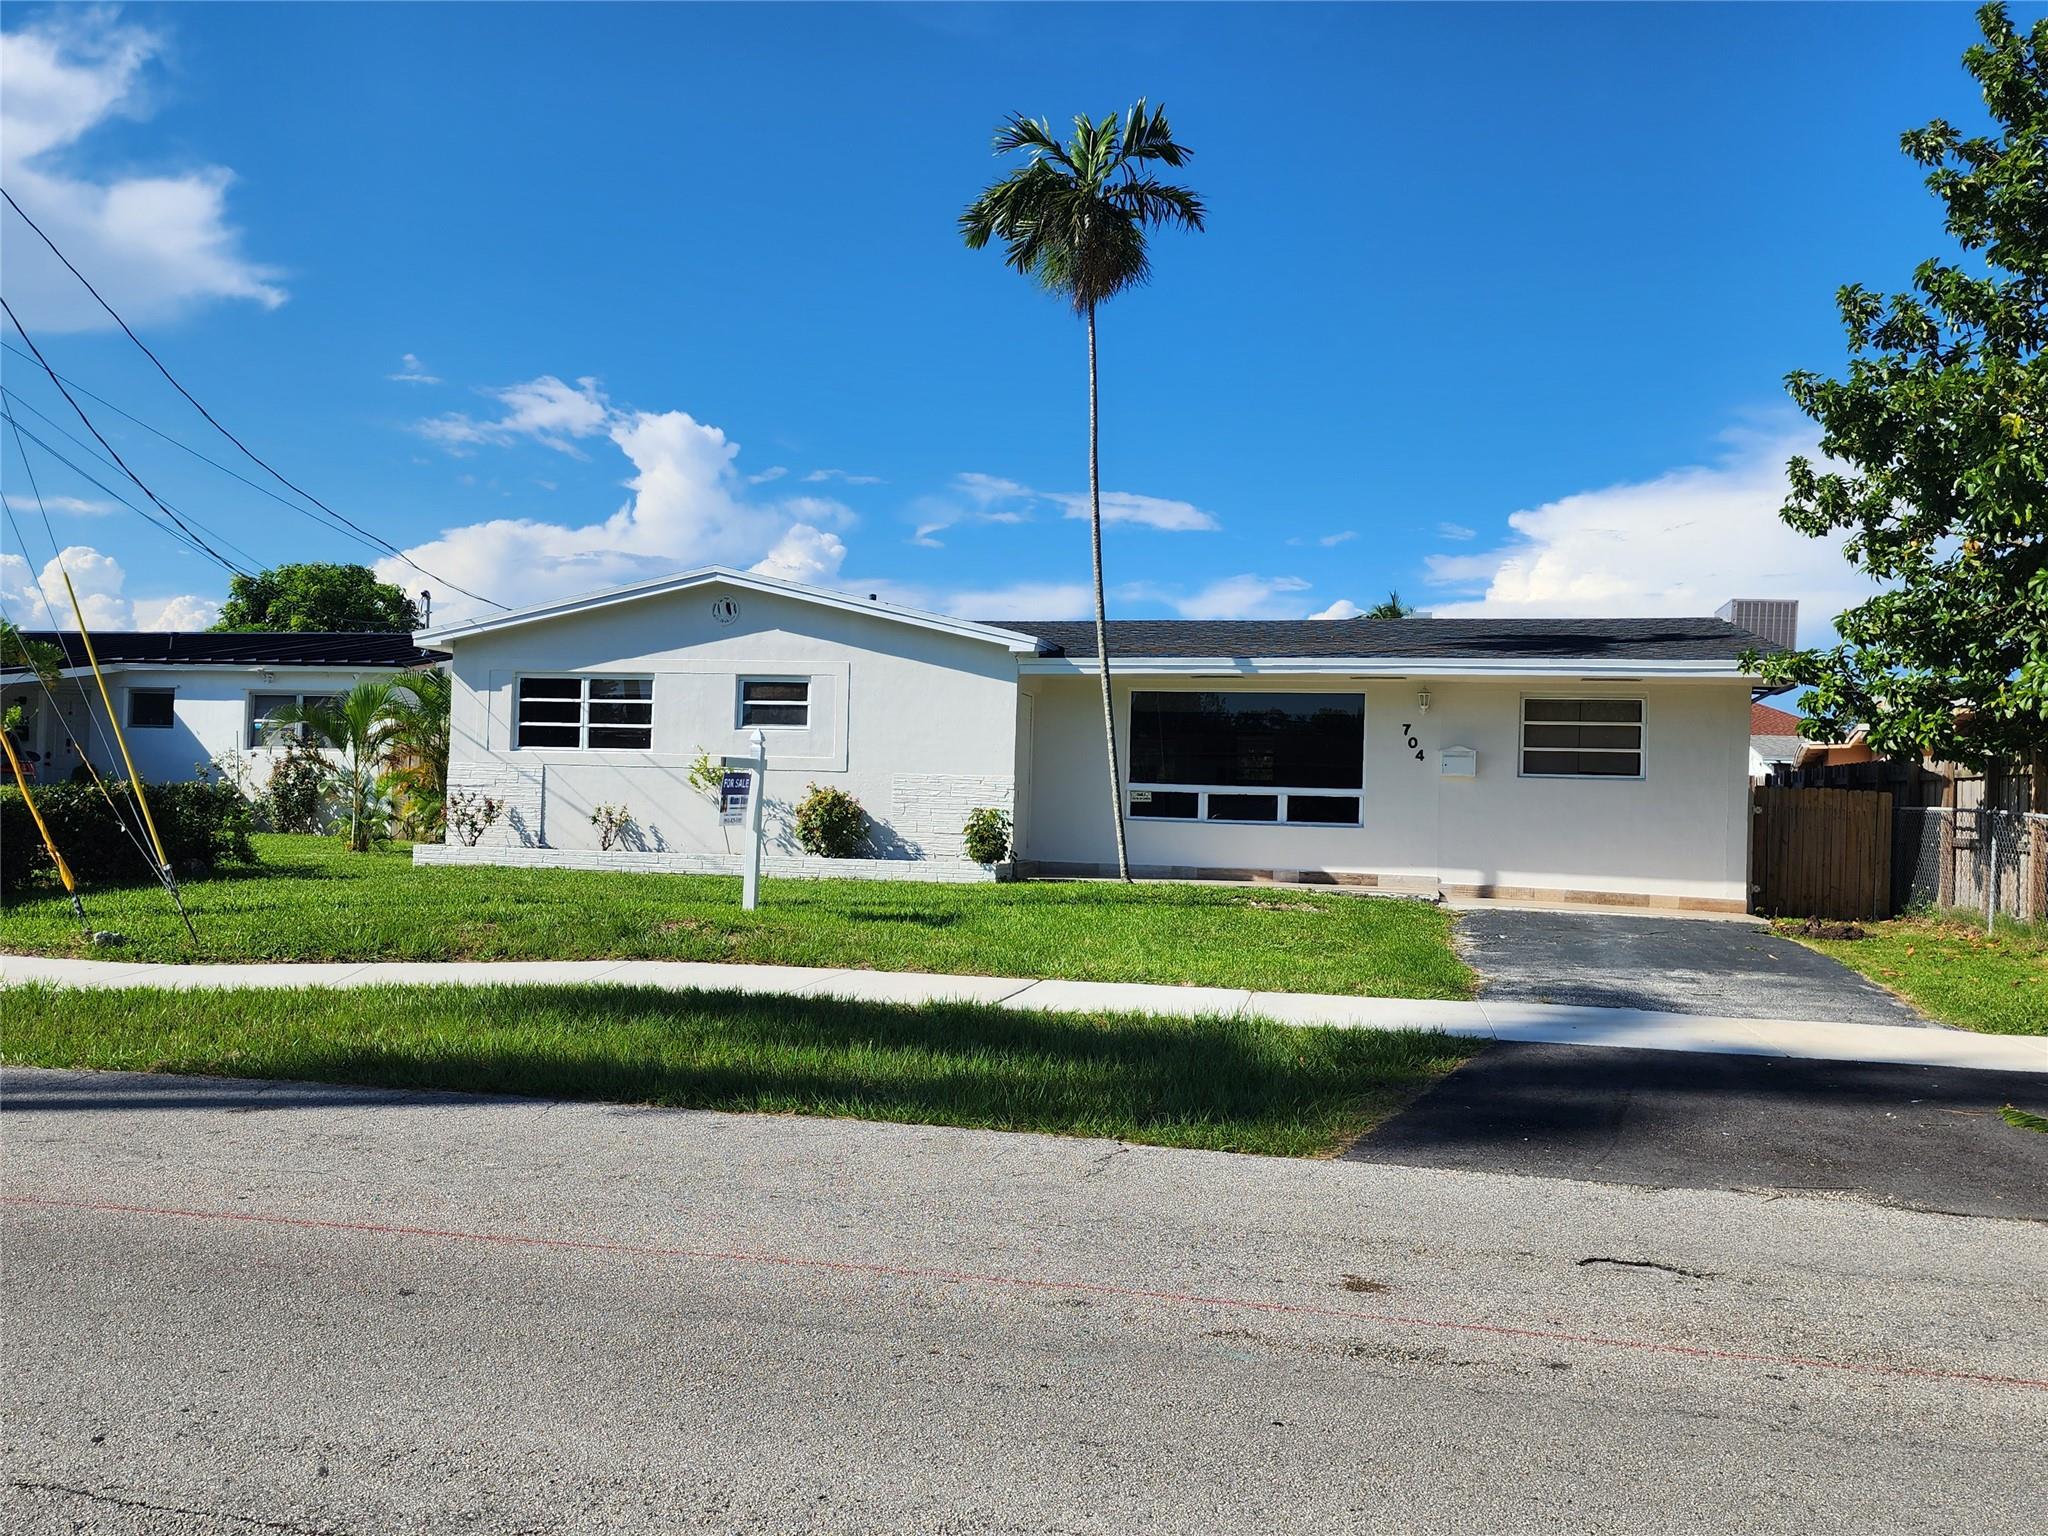
704 SW 4th St, Hallandale Beach, FL 33009
$-1,401
Cash flow
-13.9%
Cash-on-Cash Return
2.9%
Cap rate
0.5%
Rent to Value Ratio
Active
$375,000
2
bds
|
2
ba
|
1,150
sqft
|
built
1970
200 Diplomat Pkwy, Hallandale Beach, FL 33009
$-1,128
Cash flow
-15.7%
Cash-on-Cash Return
2.5%
Cap rate
0.7%
Rent to Value Ratio
Active
$295,000
1
bds
|
1
ba
|
798
sqft
|
built
1970
1965 S Ocean Dr, Hallandale Beach, FL 33009
$-714
Cash flow
-12.6%
Cash-on-Cash Return
3.2%
Cap rate
0.8%
Rent to Value Ratio

Active
$469,900
3
bds
|
2
ba
|
1,430
sqft
|
built
1976
1000 Parkview Dr, Hallandale Beach, FL 33009
$-1,792
Cash flow
-19.9%
Cash-on-Cash Return
1.6%
Cap rate
0.8%
Rent to Value Ratio
Active
$389,900
2
bds
|
2
ba
|
1,315
sqft
|
built
1970
1849 S Ocean Dr, Hallandale Beach, FL 33009
$-1,145
Cash flow
-15.3%
Cash-on-Cash Return
2.6%
Cap rate
0.8%
Rent to Value Ratio
Active
$480,000
1
bds
|
2
ba
|
870
sqft
|
built
1971
1980 S Ocean Dr, Hallandale Beach, FL 33009
$-2,028
Cash flow
-22.0%
Cash-on-Cash Return
1.1%
Cap rate
0.6%
Rent to Value Ratio
Active
$399,000
2
bds
|
2
ba
|
1,311
sqft
|
built
1971
137 Golden Isles Dr, Hallandale Beach, FL 33009
$-1,514
Cash flow
-19.8%
Cash-on-Cash Return
1.6%
Cap rate
0.7%
Rent to Value Ratio

Active
$399,000
2
bds
|
2
ba
|
1,300
sqft
|
built
1970
401 Golden Isles Dr, Hallandale Beach, FL 33009
$-1,636
Cash flow
-21.4%
Cash-on-Cash Return
1.2%
Cap rate
0.7%
Rent to Value Ratio

Active
$410,000
2
bds
|
2
ba
|
1,020
sqft
|
built
1974
2017 S Ocean Dr, Hallandale Beach, FL 33009
$-1,817
Cash flow
-23.1%
Cash-on-Cash Return
0.8%
Cap rate
0.6%
Rent to Value Ratio
Active
$299,000
1
bds
|
2
ba
|
870
sqft
|
built
1971
1980 S Ocean Dr, Hallandale Beach, FL 33009
$-1,325
Cash flow
-23.1%
Cash-on-Cash Return
0.8%
Cap rate
0.7%
Rent to Value Ratio
Active
$359,000
2
bds
|
2
ba
|
1,100
sqft
|
built
1972
1833 S Ocean Dr, Hallandale Beach, FL 33009
$-1,647
Cash flow
-23.9%
Cash-on-Cash Return
0.6%
Cap rate
0.7%
Rent to Value Ratio
Active
$264,500
2
bds
|
2
ba
|
1,130
sqft
|
built
1976
800 Parkview Dr, Hallandale Beach, FL 33009
$-770
Cash flow
-15.2%
Cash-on-Cash Return
2.7%
Cap rate
0.9%
Rent to Value Ratio

Active
$690,000
2
bds
|
2
ba
|
1,312
sqft
|
built
1970
2030 S Ocean Dr, Hallandale Beach, FL 33009
$-2,170
Cash flow
-16.4%
Cash-on-Cash Return
2.4%
Cap rate
0.5%
Rent to Value Ratio

Active
$340,000
2
bds
|
2
ba
|
1,275
sqft
|
built
1970
1965 S Ocean Dr, Hallandale Beach, FL 33009
$-548
Cash flow
-8.4%
Cash-on-Cash Return
4.2%
Cap rate
1.1%
Rent to Value Ratio