Hallandale Beach, FL Investment Properties for Sale
Browse homes for sale and investment properties in Hallandale Beach, FL. Refine your search by price, property type, or more.
Best cash flowing properties in Hallandale Beach, FL
Active
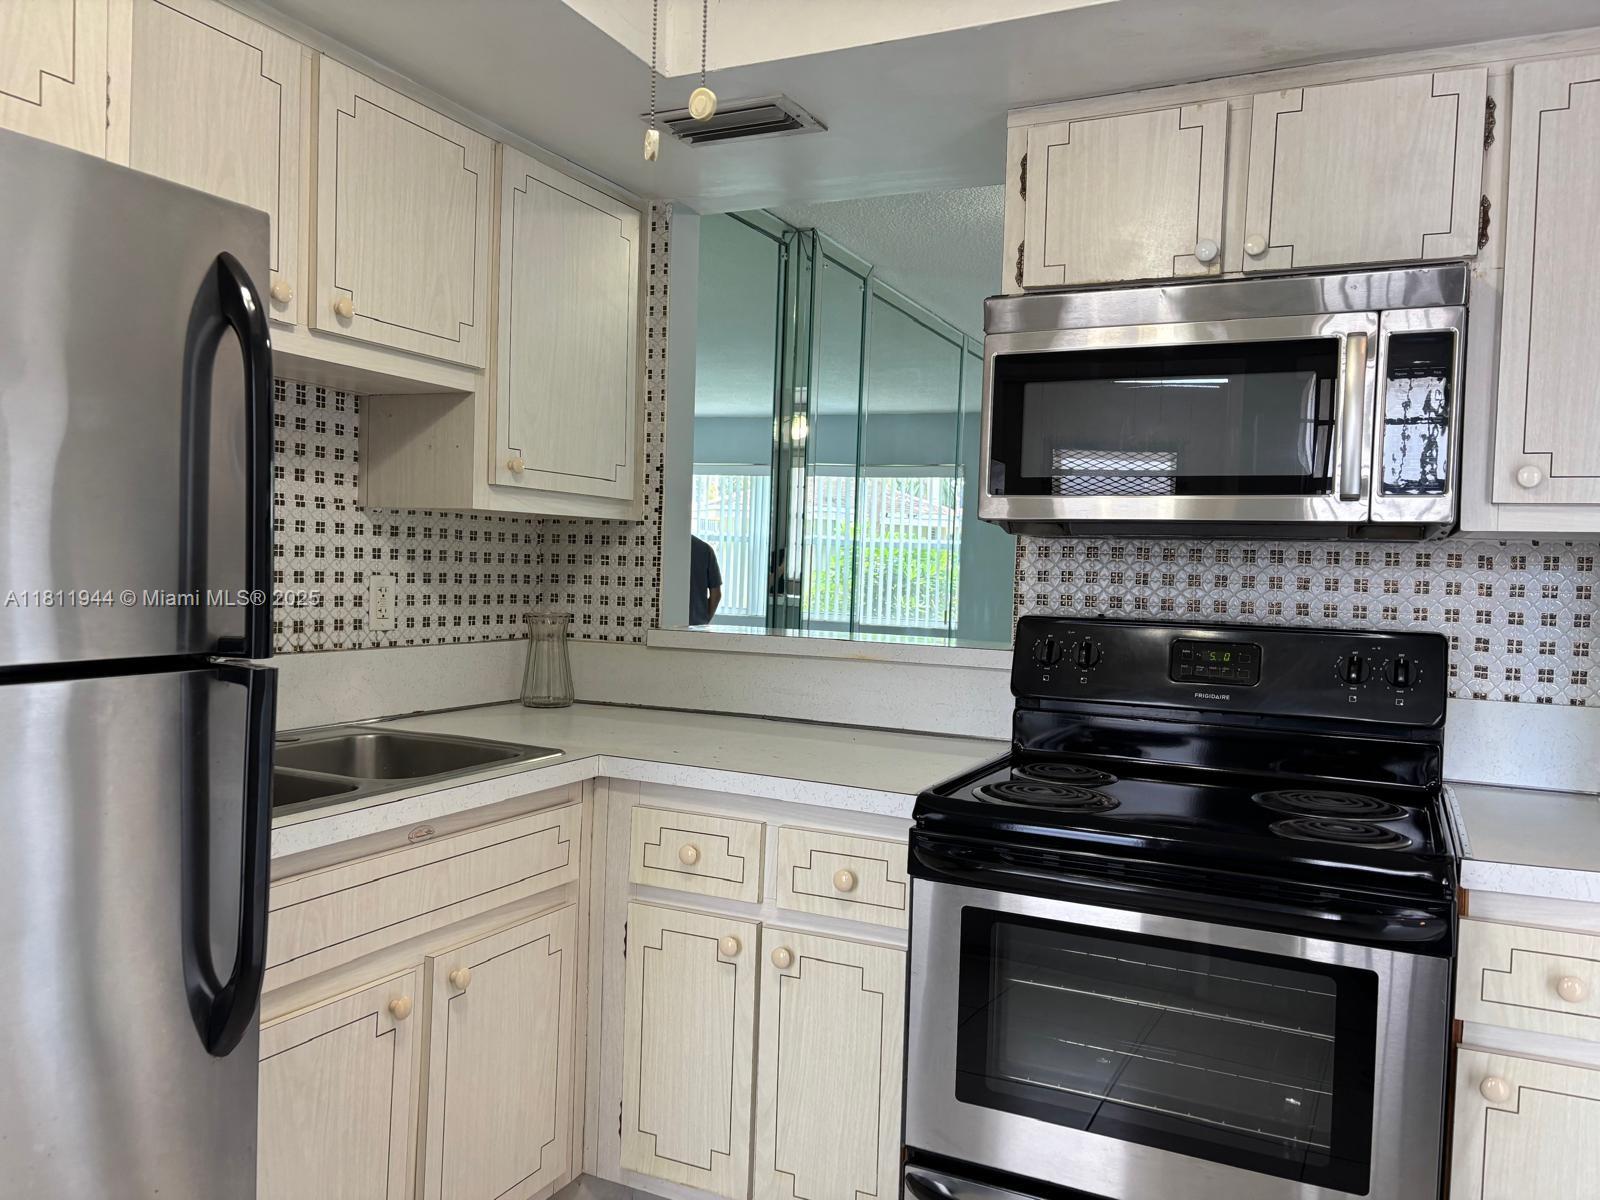
$165,000
1
bds
|
1
ba
|
678
sqft
|
built
1967
1333 E Hallandale Beach Blvd, Hallandale Beach, FL 33009
$-2
Cash flow
-0.1%
Cash-on-Cash Return
6.3%
Cap rate
1.2%
Rent to Value Ratio

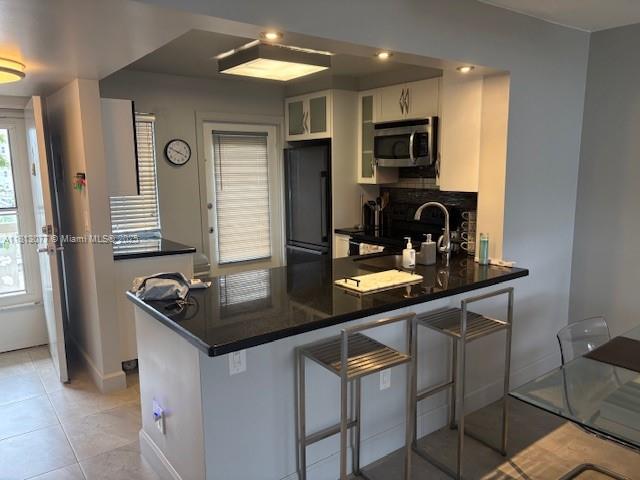
Active
$245,000
1
bds
|
2
ba
|
1,130
sqft
|
built
1976
800 Parkview Dr, Hallandale Beach, FL 33009
$-45
Cash flow
-1.0%
Cash-on-Cash Return
6.1%
Cap rate
1.0%
Rent to Value Ratio
739 out of 823 properties for sale in Hallandale Beach, FL
Limited Results Shown
Create a free account, or log in to reveal all property listings and enjoy the complete experience.
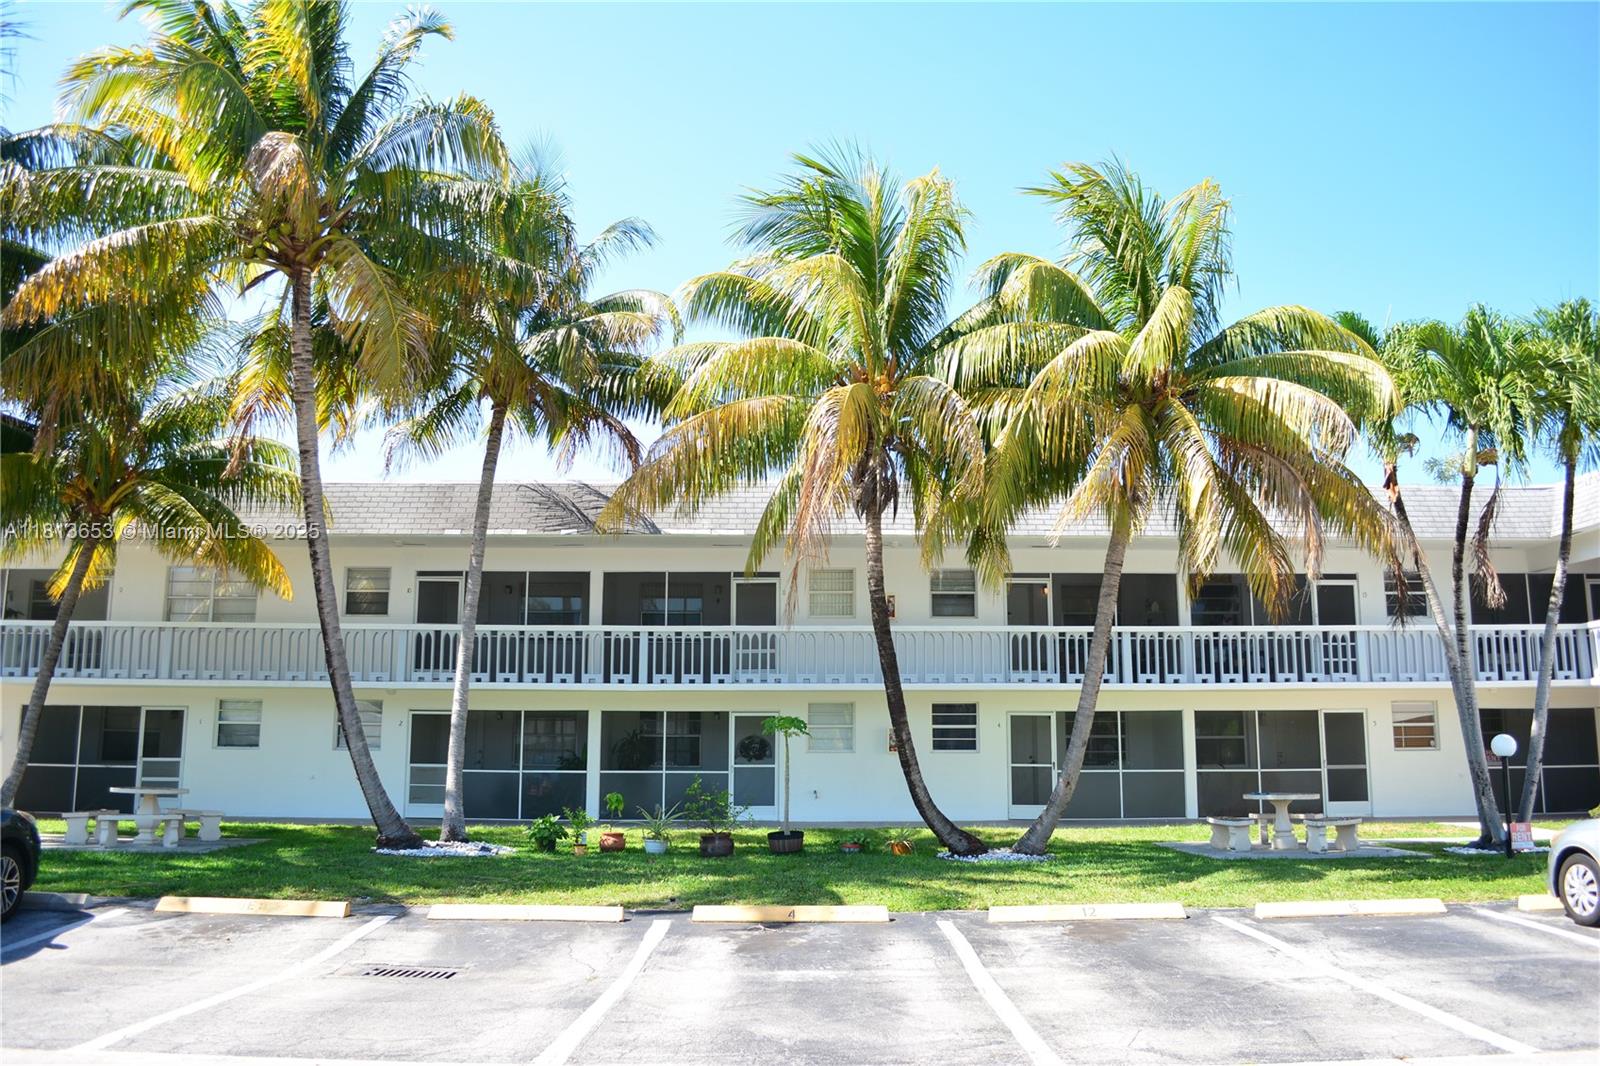
Active
$265,000
1
bds
|
1
ba
|
749
sqft
|
built
1968
1893 S Ocean Dr, Hallandale Beach, FL 33009
$-736
Cash flow
-14.5%
Cash-on-Cash Return
3.0%
Cap rate
0.9%
Rent to Value Ratio
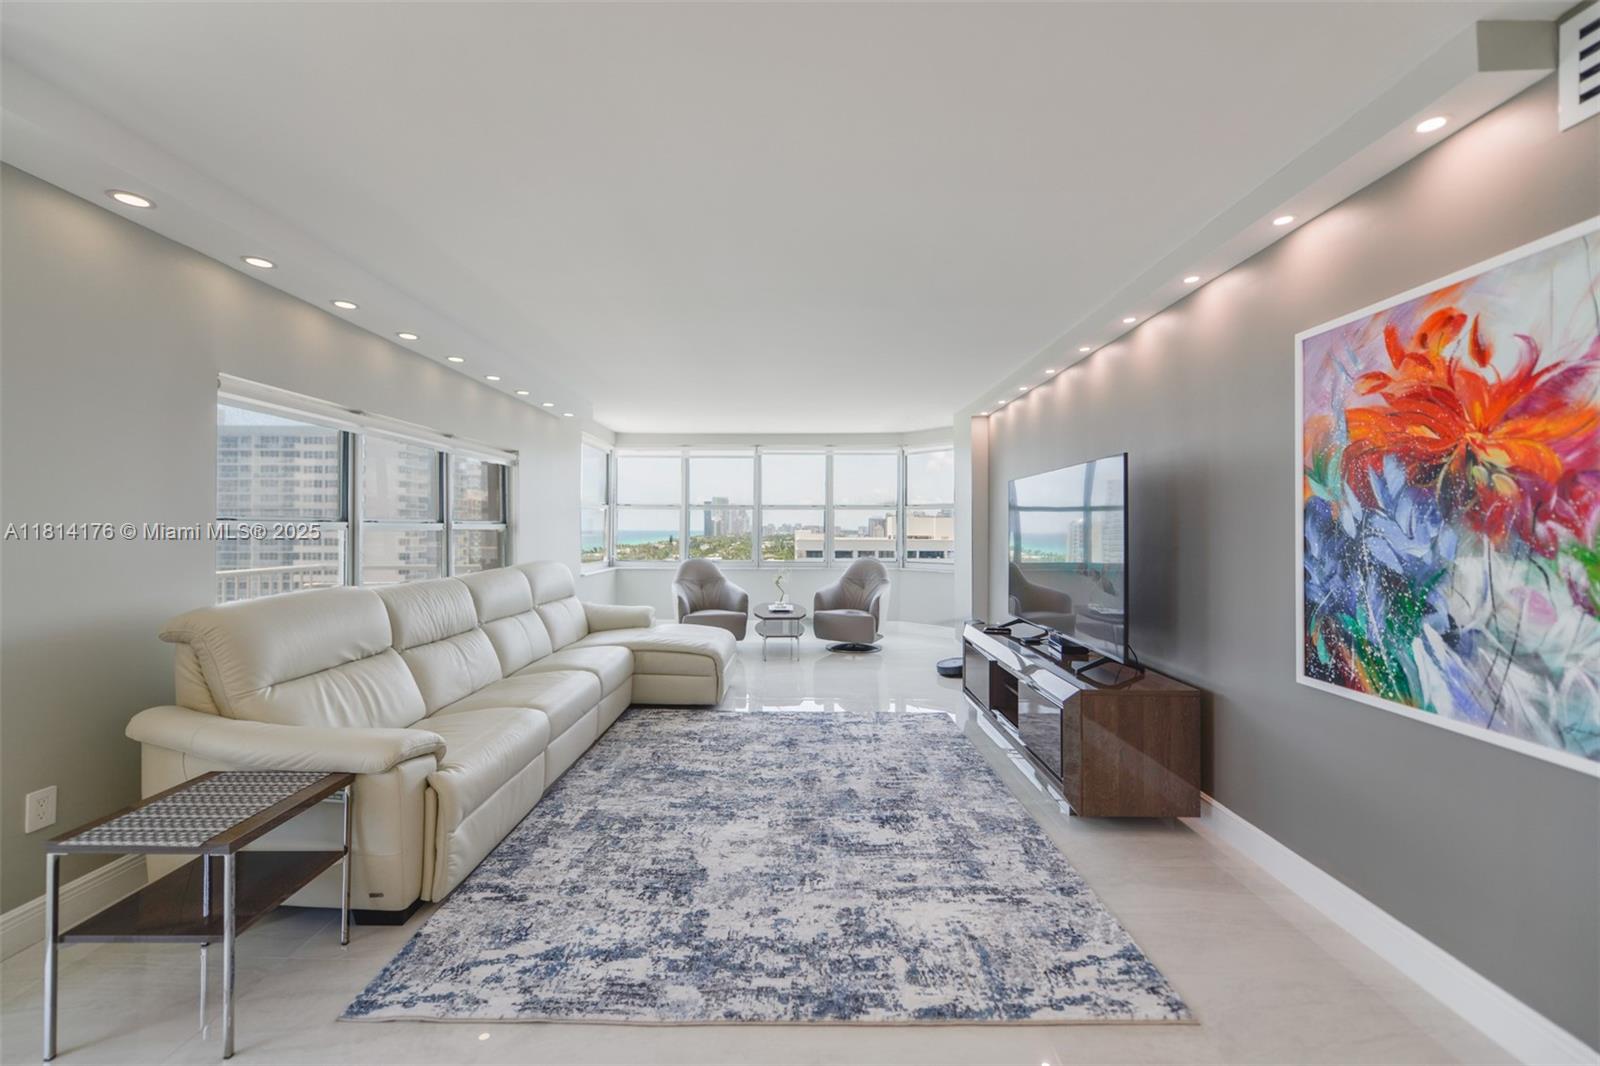
Active
$220,000
1
bds
|
1
ba
|
683
sqft
|
built
1968
705 NE 2nd St, Hallandale Beach, FL 33009
$-320
Cash flow
-7.6%
Cash-on-Cash Return
4.5%
Cap rate
0.9%
Rent to Value Ratio
Active
$850,000
3
bds
|
3
ba
|
1,740
sqft
|
built
1972
1985 S Ocean Dr, Hallandale Beach, FL 33009
$-3,018
Cash flow
-18.5%
Cash-on-Cash Return
2.0%
Cap rate
0.7%
Rent to Value Ratio
Active
$950,000
3
bds
|
3
ba
|
1,737
sqft
|
built
2013
2600 E Hallandale Beach Blvd, Hallandale Beach, FL 33009
$-3,660
Cash flow
-20.1%
Cash-on-Cash Return
1.7%
Cap rate
0.7%
Rent to Value Ratio
Active
$600,000
2
bds
|
1
ba
|
1,086
sqft
|
built
2006
1800 S Ocean Dr, Hallandale Beach, FL 33009
$-2,440
Cash flow
-21.2%
Cash-on-Cash Return
1.4%
Cap rate
0.7%
Rent to Value Ratio

Active
$375,000
2
bds
|
2
ba
|
1,100
sqft
|
built
1972
1833 S Ocean Dr, Hallandale Beach, FL 33009
$-1,512
Cash flow
-21.0%
Cash-on-Cash Return
1.4%
Cap rate
0.7%
Rent to Value Ratio
Active
$1,495,000
3
bds
|
3
ba
|
1,733
sqft
|
built
2006
1830 S Ocean Dr, Hallandale Beach, FL 33009
$-6,318
Cash flow
-22.0%
Cash-on-Cash Return
1.2%
Cap rate
0.4%
Rent to Value Ratio
Active
$245,000
1
bds
|
2
ba
|
1,130
sqft
|
built
1976
800 Parkview Dr, Hallandale Beach, FL 33009
$-45
Cash flow
-1.0%
Cash-on-Cash Return
6.1%
Cap rate
1.0%
Rent to Value Ratio

Active
$300,000
2
bds
|
2
ba
|
1,092
sqft
|
built
1969
620 NE 12th Ave, Hallandale Beach, FL 33009
$-722
Cash flow
-12.6%
Cash-on-Cash Return
3.4%
Cap rate
0.8%
Rent to Value Ratio
Active
$2,450,000
3
bds
|
3
ba
|
2,065
sqft
|
built
2006
1830 S Ocean Dr, Hallandale Beach, FL 33009
$-13,349
Cash flow
-28.4%
Cash-on-Cash Return
-0.3%
Cap rate
0.3%
Rent to Value Ratio
Active
$350,000
2
bds
|
2
ba
|
1,030
sqft
|
built
1963
400 Golden Isles Dr, Hallandale Beach, FL 33009
$-1,316
Cash flow
-19.6%
Cash-on-Cash Return
1.8%
Cap rate
0.8%
Rent to Value Ratio

Active
$235,000
1
bds
|
2
ba
|
646
sqft
|
built
1970
1801 S Ocean Dr, Hallandale Beach, FL 33009
$-952
Cash flow
-21.1%
Cash-on-Cash Return
1.4%
Cap rate
0.9%
Rent to Value Ratio
Active
$419,000
2
bds
|
2
ba
|
1,270
sqft
|
built
1974
2049 S Ocean Dr, Hallandale Beach, FL 33009
$-1,348
Cash flow
-16.8%
Cash-on-Cash Return
2.4%
Cap rate
0.8%
Rent to Value Ratio
Active
$565,000
2
bds
|
2
ba
|
1,340
sqft
|
built
1971
1950 S Ocean Dr, Hallandale Beach, FL 33009
$-1,343
Cash flow
-12.4%
Cash-on-Cash Return
3.4%
Cap rate
0.6%
Rent to Value Ratio
Active
$249,000
2
bds
|
2
ba
|
1,092
sqft
|
built
1972
500 NE 12th Ave, Hallandale Beach, FL 33009
$-804
Cash flow
-16.8%
Cash-on-Cash Return
2.4%
Cap rate
0.9%
Rent to Value Ratio
Active
$4,475,000
3
bds
|
4
ba
|
2,913
sqft
|
built
2021
2000 S Ocean Dr, Hallandale Beach, FL 33009
$-20,673
Cash flow
-24.1%
Cash-on-Cash Return
0.7%
Cap rate
0.2%
Rent to Value Ratio
Active
$165,000
1
bds
|
1
ba
|
678
sqft
|
built
1967
1333 E Hallandale Beach Blvd, Hallandale Beach, FL 33009
$-2
Cash flow
-0.1%
Cash-on-Cash Return
6.3%
Cap rate
1.2%
Rent to Value Ratio
Active
$599,000
2
bds
|
2
ba
|
1,240
sqft
|
built
1971
1950 S Ocean Dr, Hallandale Beach, FL 33009
$-2,423
Cash flow
-21.1%
Cash-on-Cash Return
1.4%
Cap rate
0.7%
Rent to Value Ratio
Active
$1,450,000
3
bds
|
3
ba
|
1,571
sqft
|
built
2006
1800 S Ocean Dr, Hallandale Beach, FL 33009
$-4,430
Cash flow
-15.9%
Cash-on-Cash Return
2.6%
Cap rate
0.6%
Rent to Value Ratio
Active
$375,000
1
bds
|
2
ba
|
870
sqft
|
built
1972
1985 S Ocean Dr, Hallandale Beach, FL 33009
$-677
Cash flow
-9.4%
Cash-on-Cash Return
4.1%
Cap rate
0.7%
Rent to Value Ratio

Active
$650,000
2
bds
|
2
ba
|
1,440
sqft
|
built
1970
1904 S Ocean Dr, Hallandale Beach, FL 33009
$-1,811
Cash flow
-14.5%
Cash-on-Cash Return
2.9%
Cap rate
0.5%
Rent to Value Ratio
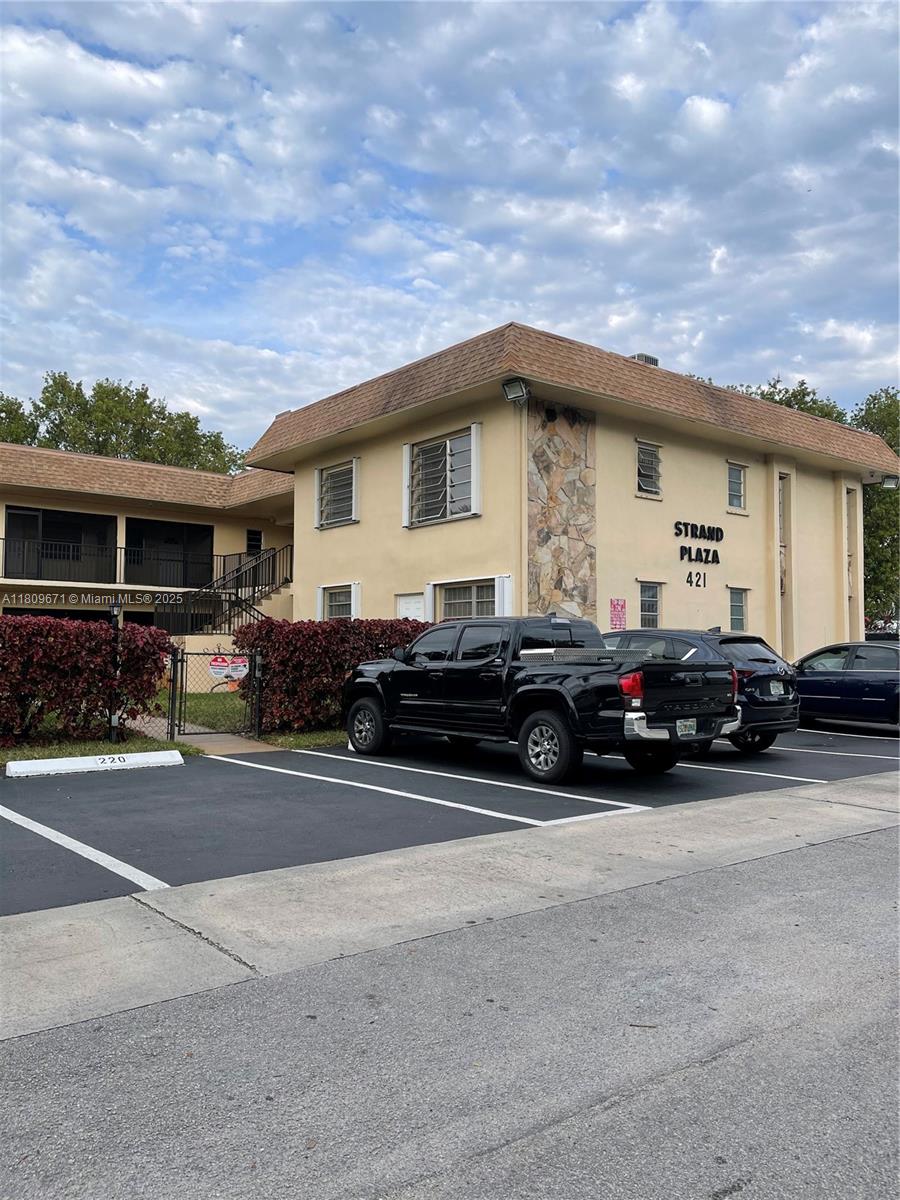
Active
$243,000
2
bds
|
2
ba
|
950
sqft
|
built
1970
421 NE 1st St, Hallandale Beach, FL 33009
$-94
Cash flow
-2.0%
Cash-on-Cash Return
5.8%
Cap rate
0.9%
Rent to Value Ratio
Active
$275,000
1
bds
|
2
ba
|
920
sqft
|
built
1971
137 Golden Isles Dr, Hallandale Beach, FL 33009
$-968
Cash flow
-18.4%
Cash-on-Cash Return
2.1%
Cap rate
0.8%
Rent to Value Ratio
Active
$410,000
1
bds
|
2
ba
|
1,300
sqft
|
built
1974
1865 S Ocean Dr, Hallandale Beach, FL 33009
$-1,716
Cash flow
-21.8%
Cash-on-Cash Return
1.3%
Cap rate
0.7%
Rent to Value Ratio
Active
$1,300,000
4
bds
|
3
ba
|
1,850
sqft
|
built
1987
2300 Diana Dr, Hallandale Beach, FL 33009
$-4,945
Cash flow
-19.8%
Cash-on-Cash Return
1.7%
Cap rate
0.5%
Rent to Value Ratio
Active
$279,000
1
bds
|
2
ba
|
1,300
sqft
|
built
1974
1865 S Ocean Dr, Hallandale Beach, FL 33009
$-1,205
Cash flow
-22.5%
Cash-on-Cash Return
1.1%
Cap rate
0.9%
Rent to Value Ratio
Active
$439,000
2
bds
|
2
ba
|
1,081
sqft
|
built
2007
1745 E Hallandale Beach Blvd, Hallandale Beach, FL 33009
$-2,084
Cash flow
-24.8%
Cash-on-Cash Return
0.6%
Cap rate
0.6%
Rent to Value Ratio
Active
$227,000
2
bds
|
2
ba
|
834
sqft
|
built
1970
705 NE 2nd St, Hallandale Beach, FL 33009
$-537
Cash flow
-12.3%
Cash-on-Cash Return
3.4%
Cap rate
0.9%
Rent to Value Ratio
Active
$669,000
1
bds
|
1
ba
|
811
sqft
|
built
2005
1830 S Ocean Dr, Hallandale Beach, FL 33009
$-1,508
Cash flow
-11.8%
Cash-on-Cash Return
3.6%
Cap rate
0.8%
Rent to Value Ratio
Active
$940,000
3
bds
|
3
ba
|
1,740
sqft
|
built
1971
1950 S Ocean Dr, Hallandale Beach, FL 33009
$-2,860
Cash flow
-15.9%
Cash-on-Cash Return
2.6%
Cap rate
0.8%
Rent to Value Ratio
Active
$679,000
2
bds
|
2
ba
|
1,360
sqft
|
built
1974
2017 S Ocean Dr, Hallandale Beach, FL 33009
$-1,921
Cash flow
-14.8%
Cash-on-Cash Return
2.9%
Cap rate
0.5%
Rent to Value Ratio
Active
$319,000
2
bds
|
2
ba
|
1,250
sqft
|
built
1970
401 Golden Isles Dr, Hallandale Beach, FL 33009
$-1,242
Cash flow
-20.3%
Cash-on-Cash Return
1.6%
Cap rate
0.9%
Rent to Value Ratio
Active
$379,000
1
bds
|
2
ba
|
870
sqft
|
built
1971
1950 S Ocean Dr, Hallandale Beach, FL 33009
$-1,677
Cash flow
-23.1%
Cash-on-Cash Return
1.0%
Cap rate
0.7%
Rent to Value Ratio
Active
$295,000
1
bds
|
1
ba
|
798
sqft
|
built
1970
1965 S Ocean Dr, Hallandale Beach, FL 33009
$-1,082
Cash flow
-19.1%
Cash-on-Cash Return
1.9%
Cap rate
0.7%
Rent to Value Ratio
Active
$499,000
3
bds
|
2
ba
|
1,430
sqft
|
built
1981
200 Leslie Dr, Hallandale Beach, FL 33009
$-2,141
Cash flow
-22.4%
Cash-on-Cash Return
1.1%
Cap rate
0.8%
Rent to Value Ratio
Active
$315,000
2
bds
|
2
ba
|
1,180
sqft
|
built
1970
1801 S Ocean Dr, Hallandale Beach, FL 33009
$-719
Cash flow
-11.9%
Cash-on-Cash Return
3.5%
Cap rate
0.9%
Rent to Value Ratio
Active
$380,000
2
bds
|
2
ba
|
1,176
sqft
|
built
1969
1825 S Ocean Dr, Hallandale Beach, FL 33009
$-1,218
Cash flow
-16.7%
Cash-on-Cash Return
2.4%
Cap rate
0.7%
Rent to Value Ratio
Active
$349,000
1
bds
|
2
ba
|
1,300
sqft
|
built
1974
1865 S Ocean Dr, Hallandale Beach, FL 33009
$-1,391
Cash flow
-20.8%
Cash-on-Cash Return
1.5%
Cap rate
0.8%
Rent to Value Ratio
Active
$340,000
1
bds
|
2
ba
|
920
sqft
|
built
2007
1755 E Hallandale Beach Blvd, Hallandale Beach, FL 33009
$-1,627
Cash flow
-25.0%
Cash-on-Cash Return
0.5%
Cap rate
0.7%
Rent to Value Ratio
Active
$445,000
2
bds
|
1
ba
|
999
sqft
|
built
2007
1945 S Ocean Dr, Hallandale Beach, FL 33009
$-960
Cash flow
-11.3%
Cash-on-Cash Return
3.7%
Cap rate
0.9%
Rent to Value Ratio