Hallandale Beach, FL Investment Properties for Sale
Browse homes for sale and investment properties in Hallandale Beach, FL. Refine your search by price, property type, or more.
Best cash flowing properties in Hallandale Beach, FL
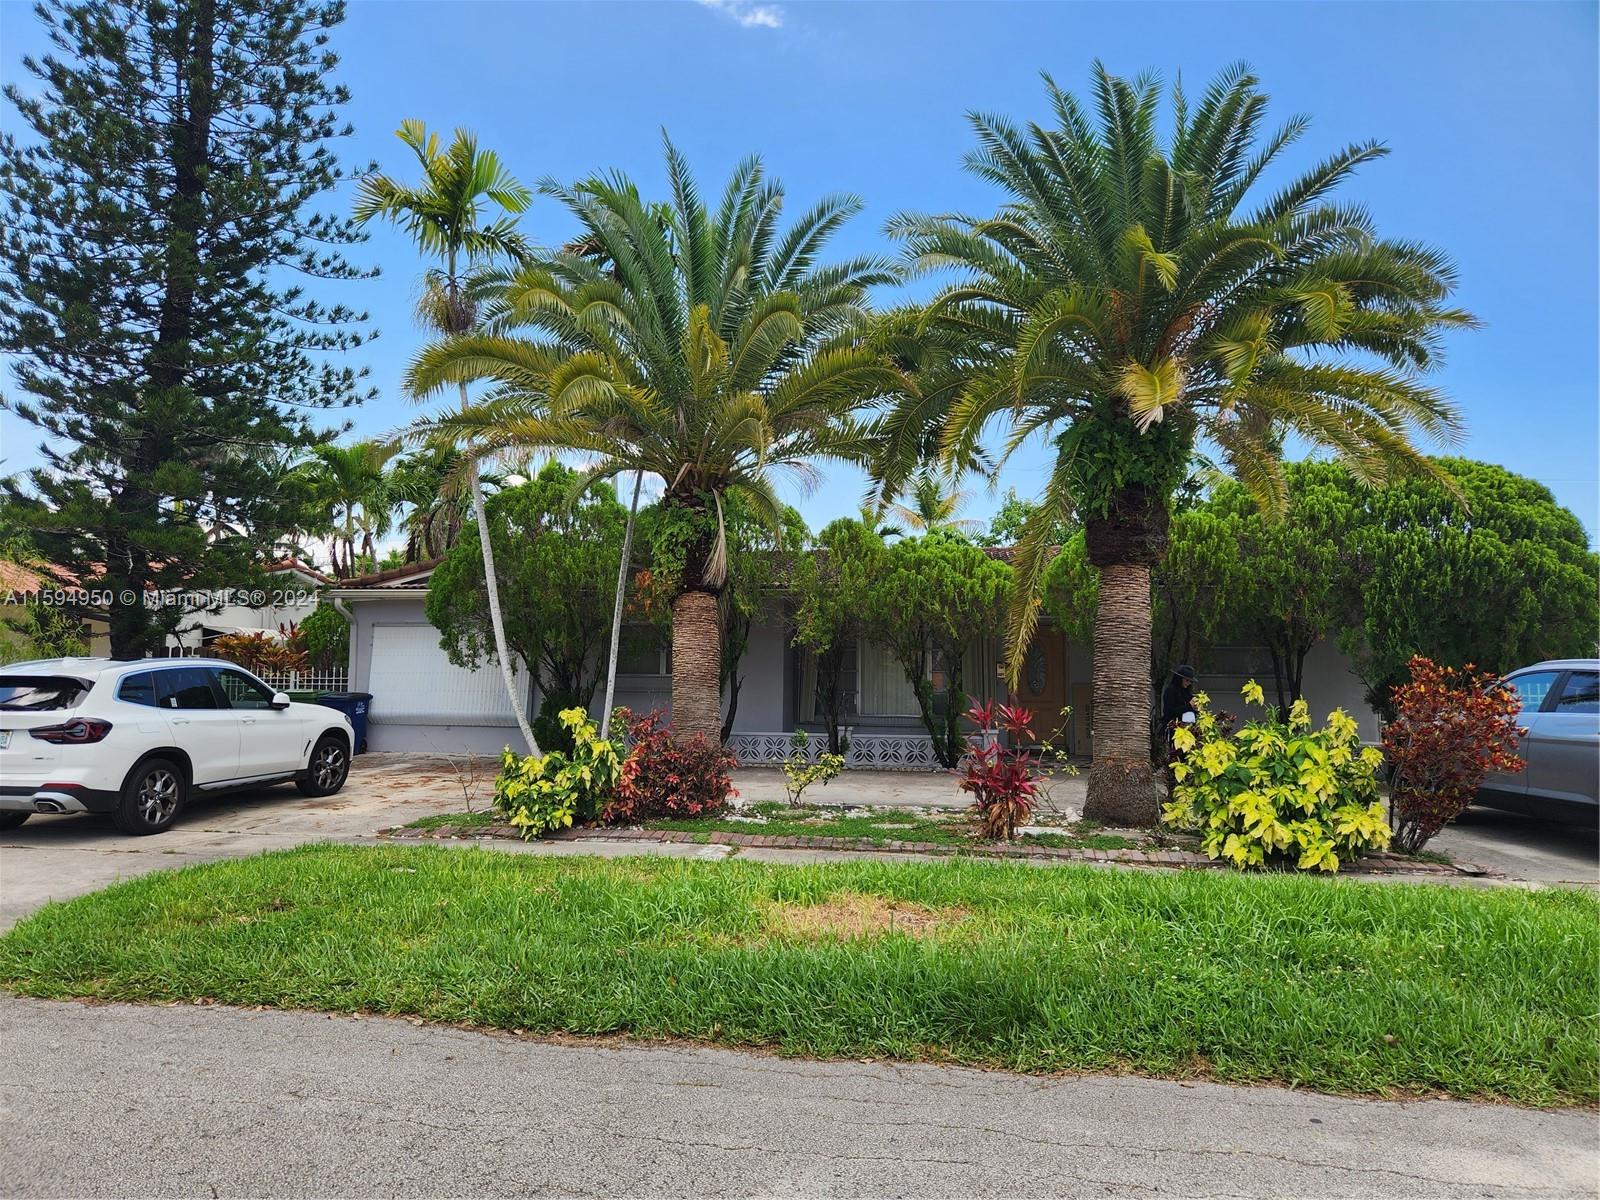
Active
$339,000
2
bds
|
2
ba
|
1,430
sqft
|
built
1981
400 Leslie Dr, Hallandale Beach, FL 33009
$275
Cash flow
4.2%
Cash-on-Cash Return
7.1%
Cap rate
0.9%
Rent to Value Ratio
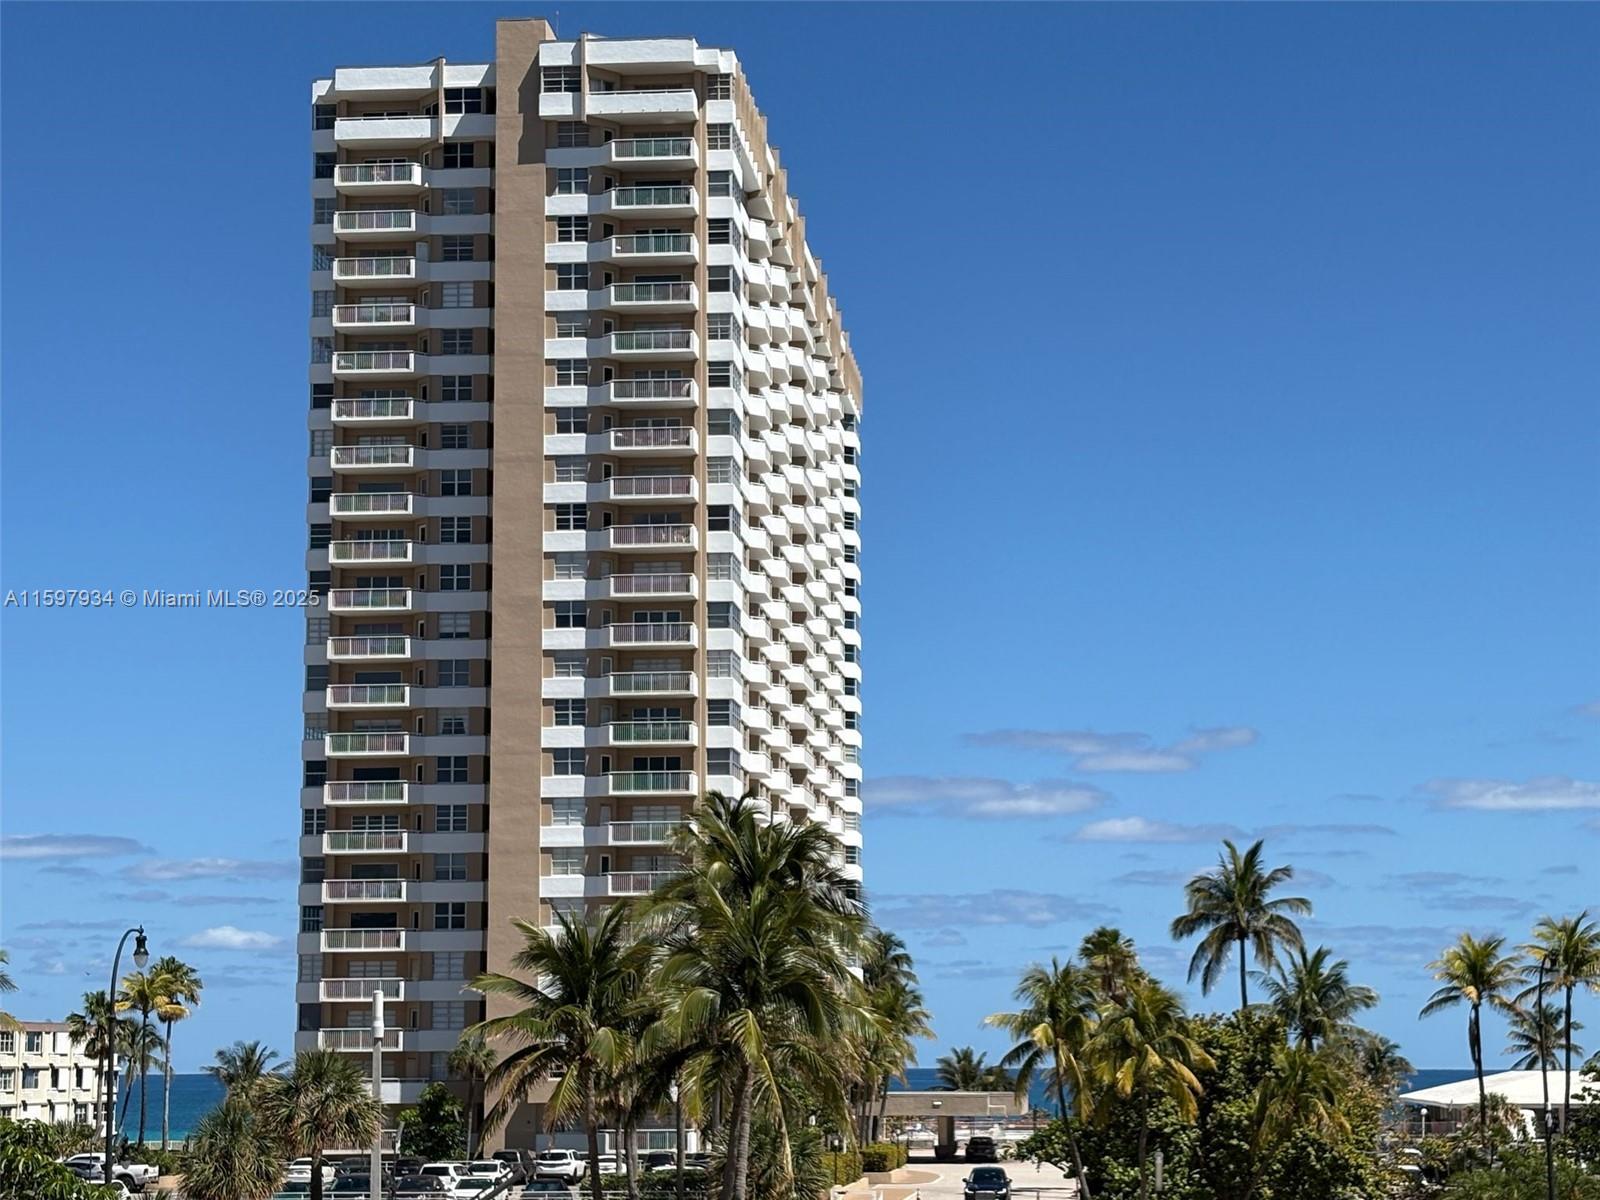
Active
$650,000
2
bds
|
2
ba
|
1,240
sqft
|
built
1971
1950 S Ocean Dr, Hallandale Beach, FL 33009
$-368
Cash flow
-3.0%
Cash-on-Cash Return
5.5%
Cap rate
0.7%
Rent to Value Ratio
833 out of 931 properties for sale in Hallandale Beach, FL
Limited Results Shown
Create a free account, or log in to reveal all property listings and enjoy the complete experience.
Active
$340,000
1
bds
|
1
ba
|
741
sqft
|
built
1972
3180 S Ocean Dr, Hallandale Beach, FL 33009
$-1,316
Cash flow
-20.2%
Cash-on-Cash Return
1.5%
Cap rate
0.7%
Rent to Value Ratio
Active
$358,520
2
bds
|
2
ba
|
1,280
sqft
|
built
1980
2500 Parkview Dr, Hallandale Beach, FL 33009
$-1,388
Cash flow
-20.2%
Cash-on-Cash Return
1.5%
Cap rate
0.9%
Rent to Value Ratio
Active
$368,000
2
bds
|
2
ba
|
1,308
sqft
|
built
1971
137 Golden Isles Dr, Hallandale Beach, FL 33009
$-1,251
Cash flow
-17.7%
Cash-on-Cash Return
2.1%
Cap rate
0.8%
Rent to Value Ratio
Active
$849,000
2
bds
|
2
ba
|
1,312
sqft
|
built
1970
2030 S Ocean Dr, Hallandale Beach, FL 33009
$-782
Cash flow
-4.8%
Cash-on-Cash Return
5.0%
Cap rate
0.7%
Rent to Value Ratio
Active
$220,000
2
bds
|
2
ba
|
1,150
sqft
|
built
1970
200 Diplomat Pkwy, Hallandale Beach, FL 33009
$-960
Cash flow
-22.8%
Cash-on-Cash Return
0.9%
Cap rate
1.1%
Rent to Value Ratio
Active
$775,000
2
bds
|
2
ba
|
1,240
sqft
|
built
1971
1950 S Ocean Dr, Hallandale Beach, FL 33009
$-2,057
Cash flow
-13.8%
Cash-on-Cash Return
3.0%
Cap rate
0.5%
Rent to Value Ratio
Active
$545,000
3
bds
|
2
ba
|
1,597
sqft
|
built
2007
1745 E Hallandale Beach Blvd, Hallandale Beach, FL 33009
$-2,238
Cash flow
-21.4%
Cash-on-Cash Return
1.2%
Cap rate
0.7%
Rent to Value Ratio
Active
$169,900
1
bds
|
2
ba
|
847
sqft
|
built
1970
319 NE 14th Ave, Hallandale Beach, FL 33009
$-398
Cash flow
-12.2%
Cash-on-Cash Return
3.3%
Cap rate
1.1%
Rent to Value Ratio
Active
$419,995
2
bds
|
2
ba
|
1,248
sqft
|
built
1970
2030 S Ocean Dr, Hallandale Beach, FL 33009
$-1,720
Cash flow
-21.4%
Cash-on-Cash Return
1.2%
Cap rate
0.7%
Rent to Value Ratio

Active
$265,000
1
bds
|
2
ba
|
923
sqft
|
built
1972
427 Golden Isles Dr, Hallandale Beach, FL 33009
$-600
Cash flow
-11.8%
Cash-on-Cash Return
3.4%
Cap rate
0.9%
Rent to Value Ratio
Active
$599,000
2
bds
|
2
ba
|
1,354
sqft
|
built
2007
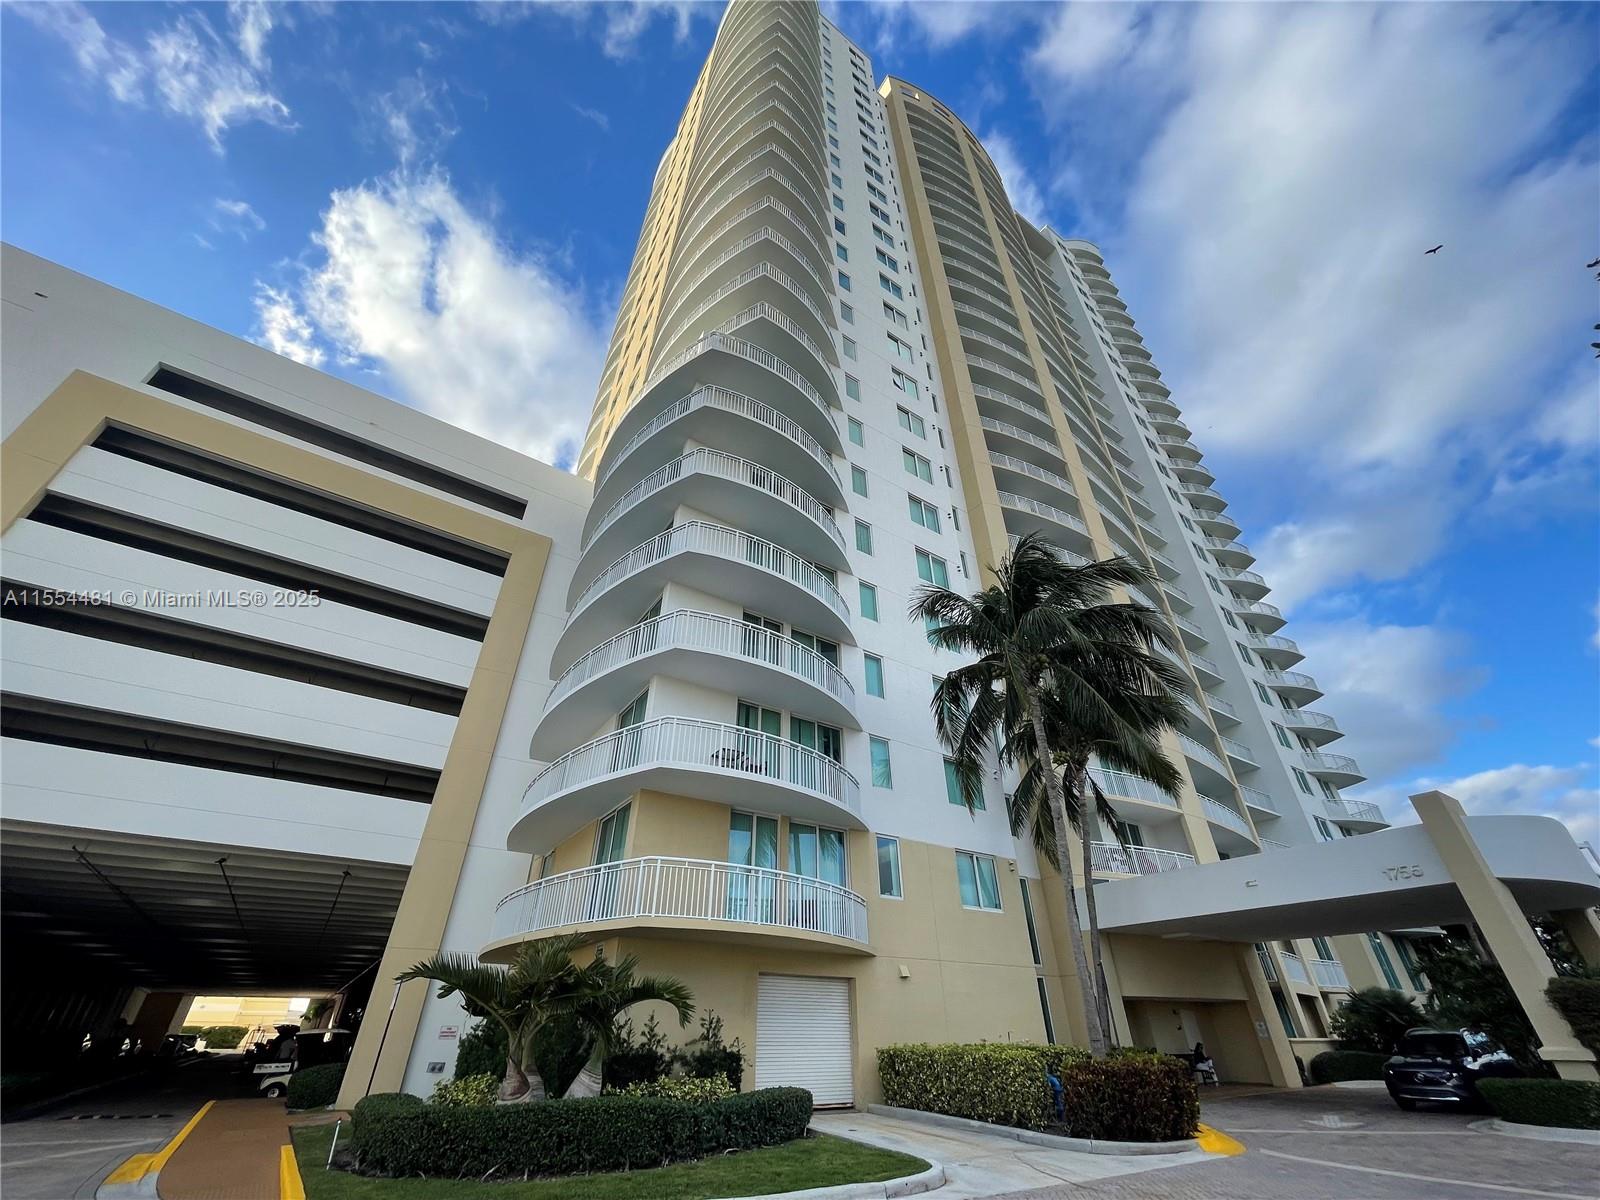
1755 E Hallandale Beach Blvd, Hallandale Beach, FL 33009
$-2,260
Cash flow
-19.7%
Cash-on-Cash Return
1.6%
Cap rate
0.7%
Rent to Value Ratio

Active
$499,900
2
bds
|
2
ba
|
1,330
sqft
|
built
1984
708 SE 3rd Avenue Ext, Hallandale Beach, FL 33009
$-659
Cash flow
-6.9%
Cash-on-Cash Return
4.6%
Cap rate
0.7%
Rent to Value Ratio
Active
$735,000
1
bds
|
1
ba
|
844
sqft
|
built
2006
1830 S Ocean Dr, Hallandale Beach, FL 33009
$-1,940
Cash flow
-13.8%
Cash-on-Cash Return
3.0%
Cap rate
0.5%
Rent to Value Ratio
Active
$390,000
2
bds
|
2
ba
|
1,100
sqft
|
built
1972
1833 S Ocean Dr, Hallandale Beach, FL 33009
$-1,631
Cash flow
-21.8%
Cash-on-Cash Return
1.1%
Cap rate
0.7%
Rent to Value Ratio
Active
$339,000
2
bds
|
2
ba
|
1,430
sqft
|
built
1981
400 Leslie Dr, Hallandale Beach, FL 33009
$275
Cash flow
4.2%
Cash-on-Cash Return
7.1%
Cap rate
0.9%
Rent to Value Ratio
Active
$248,900
1
bds
|
2
ba
|
870
sqft
|
built
1970
1849 S Ocean Dr, Hallandale Beach, FL 33009
$-880
Cash flow
-18.4%
Cash-on-Cash Return
1.9%
Cap rate
0.9%
Rent to Value Ratio
Active
$325,000
2
bds
|
2
ba
|
1,400
sqft
|
built
1975
600 Three Islands Blvd, Hallandale Beach, FL 33009
$-1,818
Cash flow
-29.2%
Cash-on-Cash Return
-0.6%
Cap rate
0.9%
Rent to Value Ratio
Active
$677,000
1
bds
|
2
ba
|
1,358
sqft
|
built
1975
1912 S Ocean Dr, Hallandale Beach, FL 33009
$-2,941
Cash flow
-22.7%
Cash-on-Cash Return
0.9%
Cap rate
0.5%
Rent to Value Ratio
Active
$284,900
1
bds
|
2
ba
|
1,000
sqft
|
built
1978
600 Three Islands Blvd, Hallandale Beach, FL 33009
$-876
Cash flow
-16.0%
Cash-on-Cash Return
2.5%
Cap rate
0.8%
Rent to Value Ratio
Active
$512,000
2
bds
|
3
ba
|
1,685
sqft
|
built
2007
1755 E Hallandale Beach Blvd, Hallandale Beach, FL 33009
$-2,354
Cash flow
-24.0%
Cash-on-Cash Return
0.6%
Cap rate
0.6%
Rent to Value Ratio
Active
$205,000
1
bds
|
1
ba
|
545
sqft
|
built
1970
1965 S Ocean Dr, Hallandale Beach, FL 33009
$-700
Cash flow
-17.8%
Cash-on-Cash Return
2.0%
Cap rate
0.9%
Rent to Value Ratio
Active
$370,000
2
bds
|
2
ba
|
1,275
sqft
|
built
1970
1965 S Ocean Dr, Hallandale Beach, FL 33009
$-1,261
Cash flow
-17.8%
Cash-on-Cash Return
2.1%
Cap rate
0.8%
Rent to Value Ratio
Active
$749,000
3
bds
|
2
ba
|
2,011
sqft
|
built
1968
1109 NE 4th Ct, Hallandale Beach, FL 33009
$-1,968
Cash flow
-13.7%
Cash-on-Cash Return
3.0%
Cap rate
0.5%
Rent to Value Ratio

Active
$260,000
2
bds
|
2
ba
|
1,280
sqft
|
built
1980
2500 Parkview Dr, Hallandale Beach, FL 33009
$-803
Cash flow
-16.1%
Cash-on-Cash Return
2.4%
Cap rate
1.1%
Rent to Value Ratio
Active
$239,900
1
bds
|
2
ba
|
868
sqft
|
built
1972
427 Golden Isles Dr, Hallandale Beach, FL 33009
$-724
Cash flow
-15.7%
Cash-on-Cash Return
2.5%
Cap rate
1.0%
Rent to Value Ratio
Active
$2,790,000
3
bds
|
4
ba
|
2,492
sqft
|
built
1958
536 Hibiscus Dr, Hallandale Beach, FL 33009
$-12,432
Cash flow
-23.2%
Cash-on-Cash Return
0.8%
Cap rate
0.3%
Rent to Value Ratio

Active
$805,000
3
bds
|
3
ba
|
1,737
sqft
|
built
2015
2600 E Hallandale Beach Blvd, Hallandale Beach, FL 33009
$-2,121
Cash flow
-13.7%
Cash-on-Cash Return
3.0%
Cap rate
1.0%
Rent to Value Ratio
Active
$6,799,000
6
bds
|
8
ba
|
5,829
sqft
|
built
2015
631 Hibiscus Dr, Hallandale Beach, FL 33009
$-37,577
Cash flow
-28.8%
Cash-on-Cash Return
-0.5%
Cap rate
0.1%
Rent to Value Ratio
Active
$2,585,000
3
bds
|
3
ba
|
2,065
sqft
|
built
2006
1830 S Ocean Dr, Hallandale Beach, FL 33009
$-11,004
Cash flow
-22.2%
Cash-on-Cash Return
1.0%
Cap rate
0.4%
Rent to Value Ratio
Active
$650,000
2
bds
|
2
ba
|
1,240
sqft
|
built
1971
1950 S Ocean Dr, Hallandale Beach, FL 33009
$-368
Cash flow
-3.0%
Cash-on-Cash Return
5.5%
Cap rate
0.7%
Rent to Value Ratio
Active
$419,900
2
bds
|
2
ba
|
1,150
sqft
|
built
1970
300 Diplomat Pkwy, Hallandale Beach, FL 33009
$-1,431
Cash flow
-17.8%
Cash-on-Cash Return
2.1%
Cap rate
0.7%
Rent to Value Ratio

Active
$574,000
3
bds
|
3
ba
|
1,740
sqft
|
built
1971
1980 S Ocean Dr, Hallandale Beach, FL 33009
$-2,947
Cash flow
-26.8%
Cash-on-Cash Return
0.0%
Cap rate
0.6%
Rent to Value Ratio
Active
$414,900
2
bds
|
2
ba
|
1,380
sqft
|
built
1971
1980 S Ocean Dr, Hallandale Beach, FL 33009
$-2,121
Cash flow
-26.7%
Cash-on-Cash Return
0.0%
Cap rate
0.7%
Rent to Value Ratio

Active
$329,000
2
bds
|
2
ba
|
1,150
sqft
|
built
1970
200 Diplomat Pkwy, Hallandale Beach, FL 33009
$-1,305
Cash flow
-20.7%
Cash-on-Cash Return
1.4%
Cap rate
0.9%
Rent to Value Ratio
Active
$469,000
2
bds
|
2
ba
|
1,315
sqft
|
built
1970
1849 S Ocean Dr, Hallandale Beach, FL 33009
$-1,733
Cash flow
-19.3%
Cash-on-Cash Return
1.7%
Cap rate
0.7%
Rent to Value Ratio
Active
$479,900
3
bds
|
2
ba
|
1,481
sqft
|
built
2007
1755 E Hallandale Beach Blvd, Hallandale Beach, FL 33009
$-2,472
Cash flow
-26.9%
Cash-on-Cash Return
0.0%
Cap rate
0.7%
Rent to Value Ratio
Active
$365,000
1
bds
|
2
ba
|
1,075
sqft
|
built
1976
800 Parkview Dr, Hallandale Beach, FL 33009
$-1,419
Cash flow
-20.3%
Cash-on-Cash Return
1.5%
Cap rate
0.6%
Rent to Value Ratio
Active
$449,900
3
bds
|
2
ba
|
1,481
sqft
|
built
2007
1755 E Hallandale Beach Blvd, Hallandale Beach, FL 33009
$-2,379
Cash flow
-27.6%
Cash-on-Cash Return
-0.2%
Cap rate
0.7%
Rent to Value Ratio
Active
$429,000
1
bds
|
2
ba
|
960
sqft
|
built
1970
1904 S Ocean Dr, Hallandale Beach, FL 33009
$-942
Cash flow
-11.5%
Cash-on-Cash Return
3.5%
Cap rate
0.6%
Rent to Value Ratio

Active
$799,000
3
bds
|
3
ba
|
1,744
sqft
|
built
2007
1945 S Ocean Dr, Hallandale Beach, FL 33009
$-3,283
Cash flow
-21.4%
Cash-on-Cash Return
1.2%
Cap rate
0.6%
Rent to Value Ratio