Hallandale Beach, FL Investment Properties for Sale
Browse homes for sale and investment properties in Hallandale Beach, FL. Refine your search by price, property type, or more.
Best cash flowing properties in Hallandale Beach, FL
Active
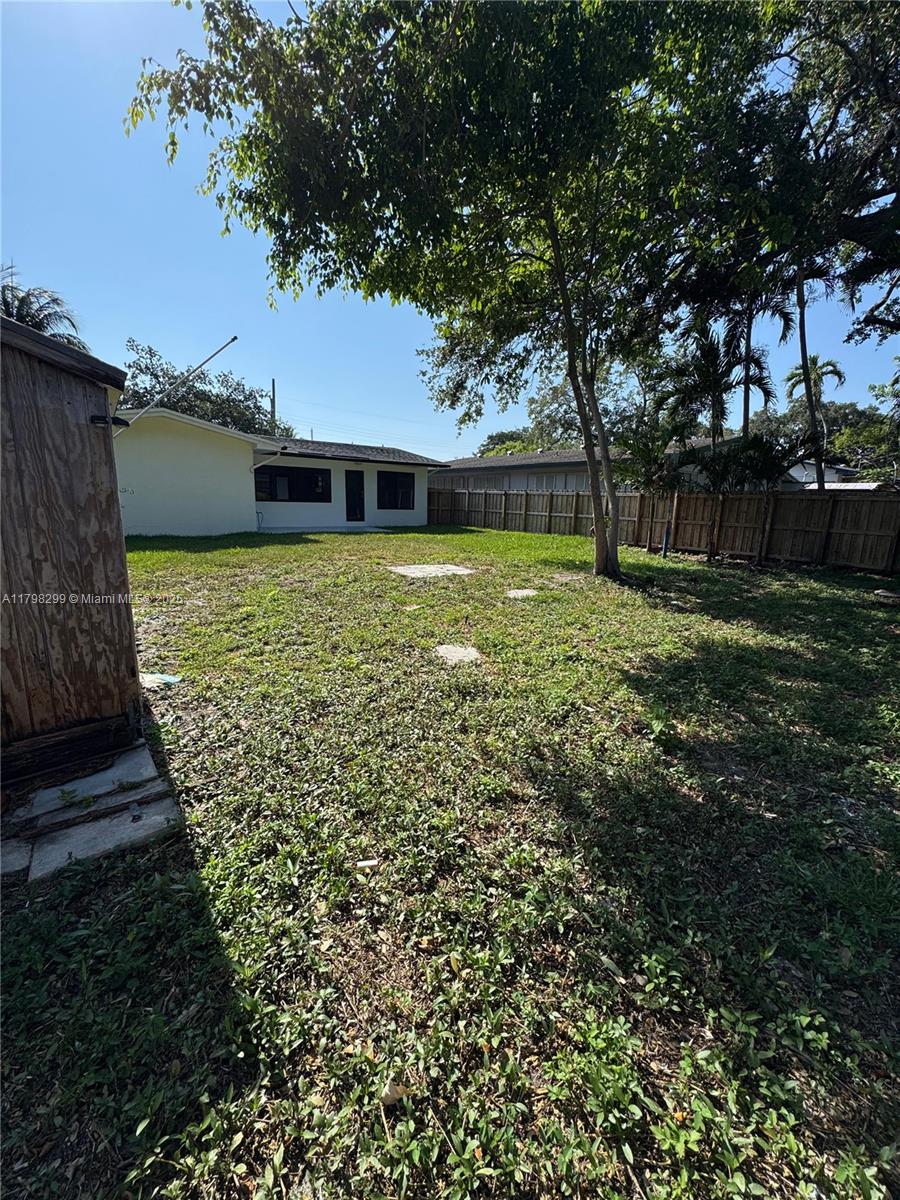
$490,000
2
bds
|
1
ba
|
1,162
sqft
|
built
1962
421 SW 11th Ave, Hallandale Beach, FL 33009
$-134
Cash flow
-1.4%
Cash-on-Cash Return
5.8%
Cap rate
0.7%
Rent to Value Ratio
Active
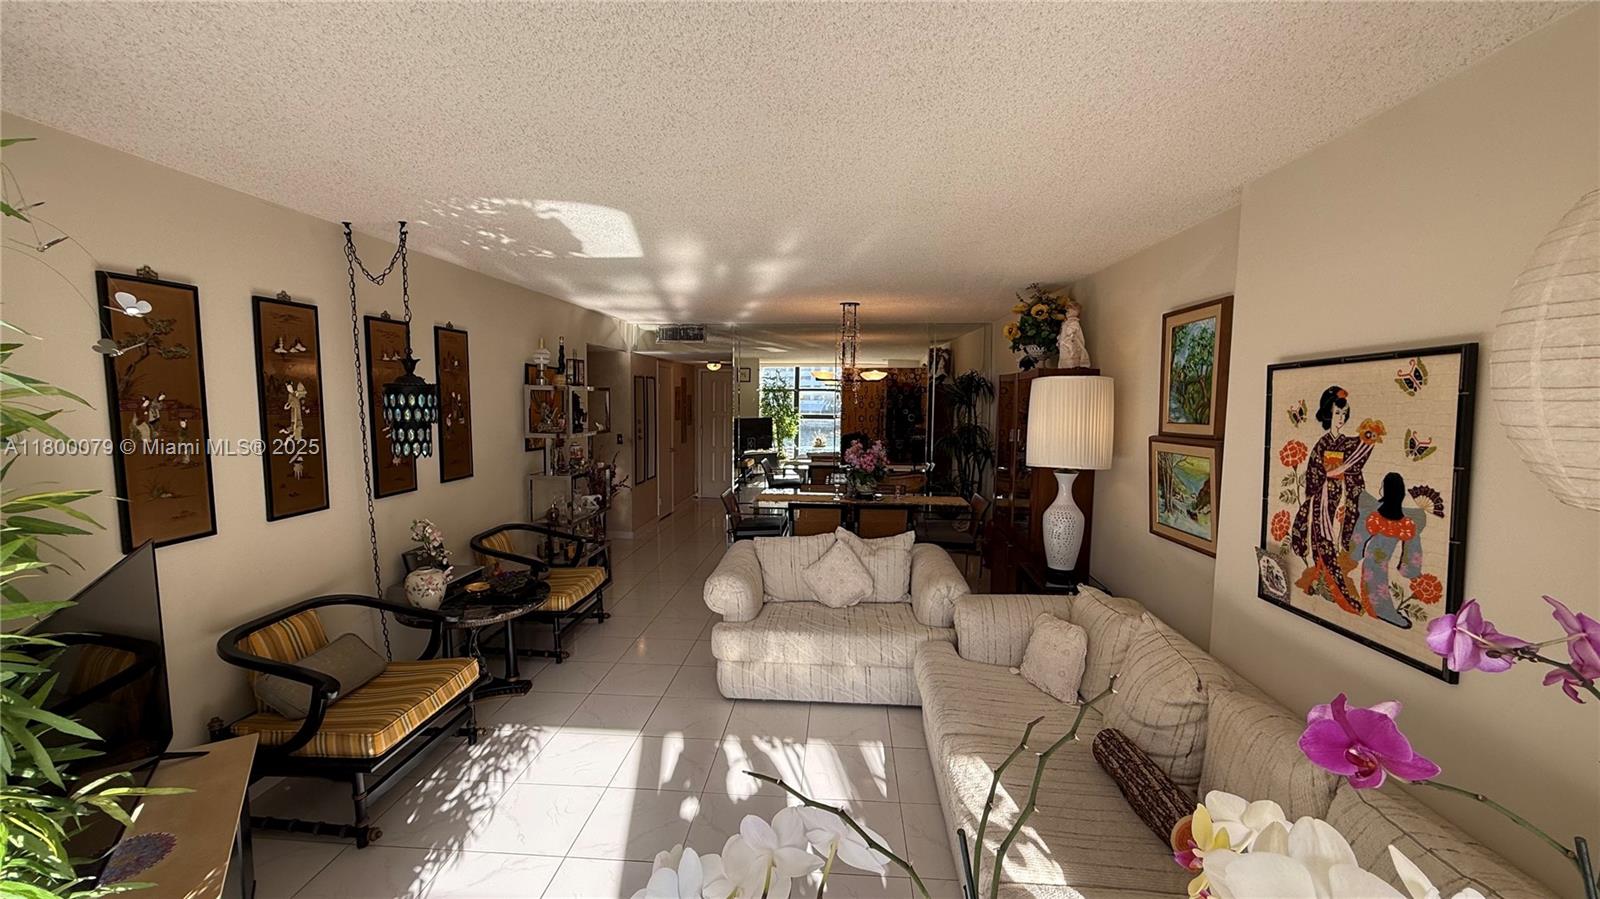
$240,000
1
bds
|
2
ba
|
915
sqft
|
built
1981
400 Leslie Dr, Hallandale Beach, FL 33009
$-147
Cash flow
-3.2%
Cash-on-Cash Return
5.4%
Cap rate
1.0%
Rent to Value Ratio
837 out of 936 properties for sale in Hallandale Beach, FL
Limited Results Shown
Create a free account, or log in to reveal all property listings and enjoy the complete experience.
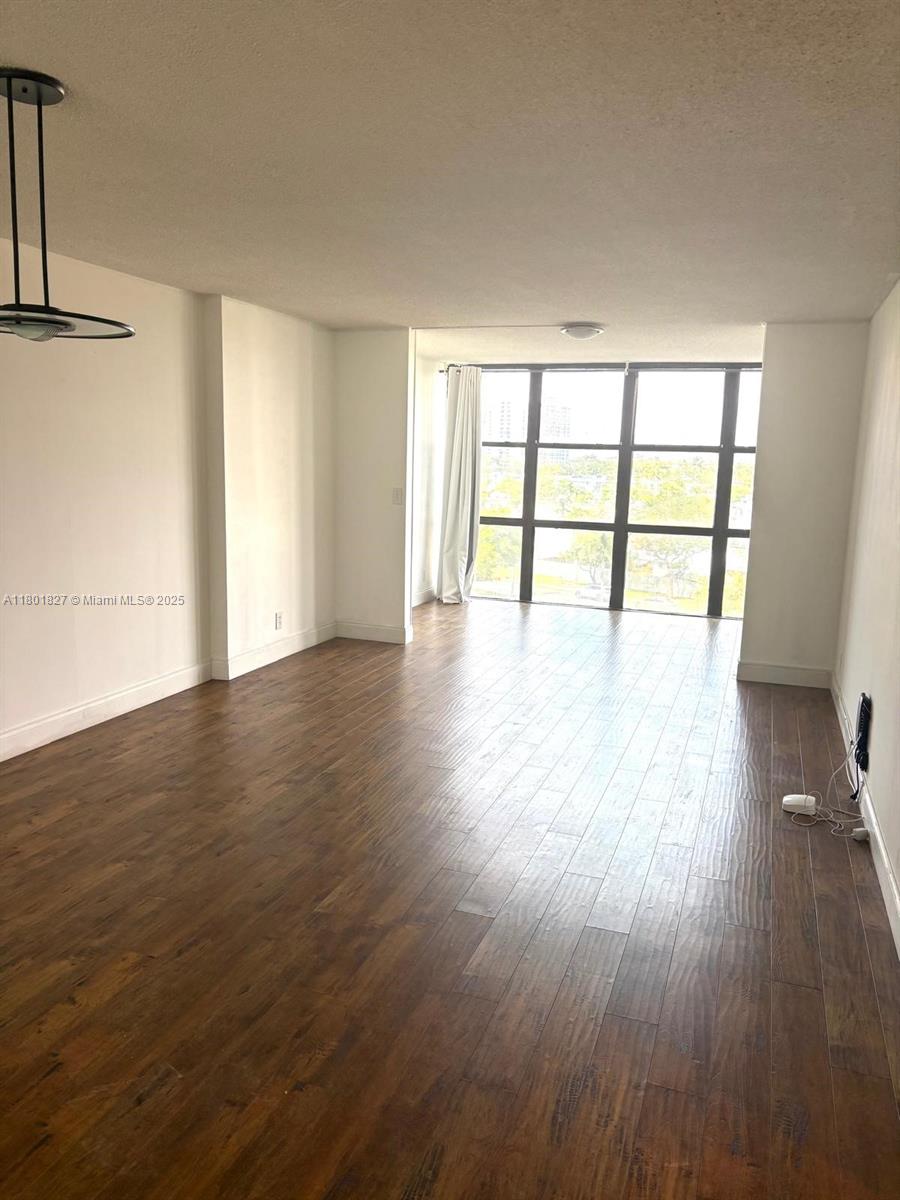
Active
$225,000
1
bds
|
2
ba
|
915
sqft
|
built
1976
1000 Parkview Dr, Hallandale Beach, FL 33009
$-730
Cash flow
-16.9%
Cash-on-Cash Return
2.3%
Cap rate
1.0%
Rent to Value Ratio

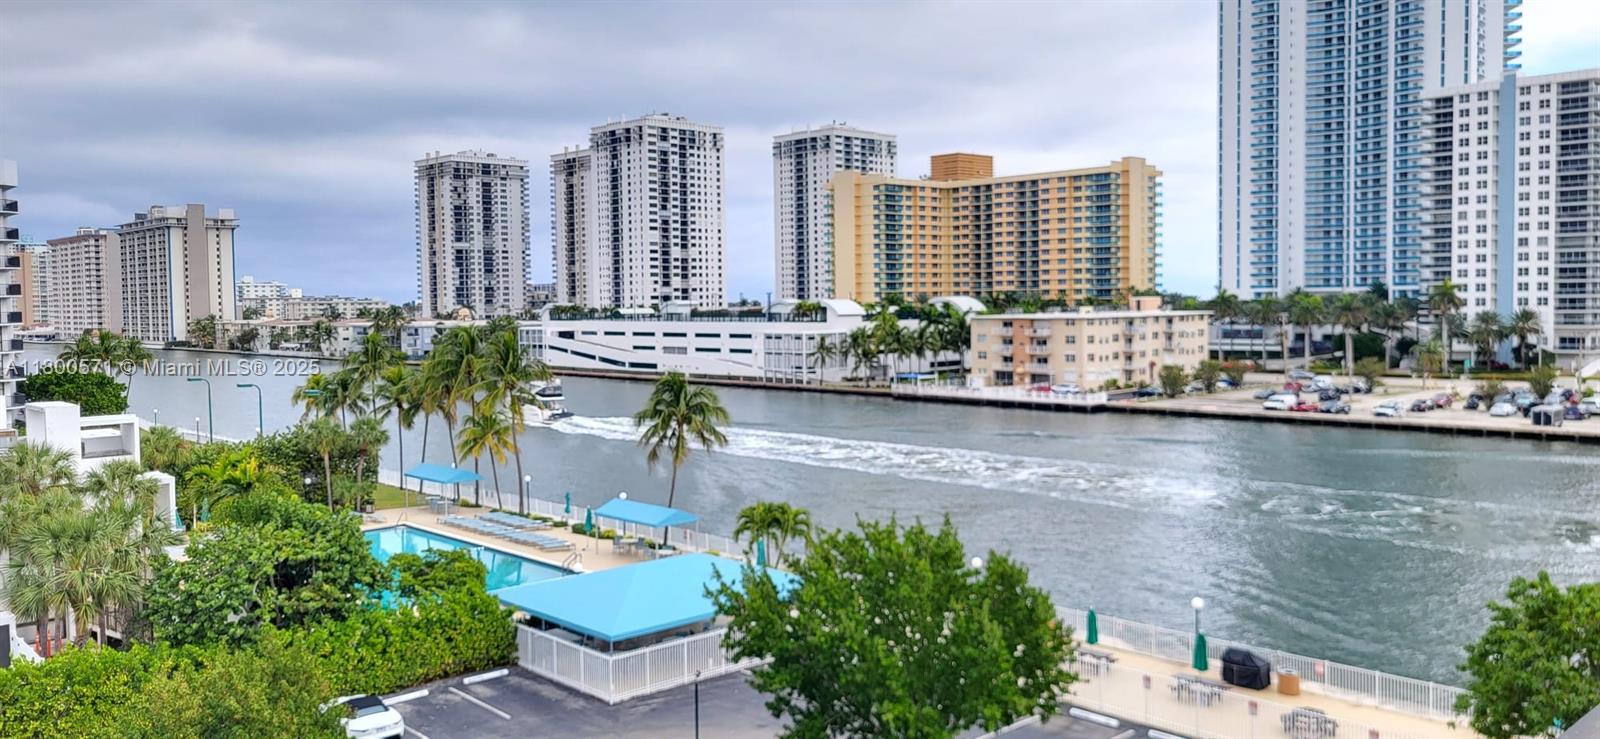
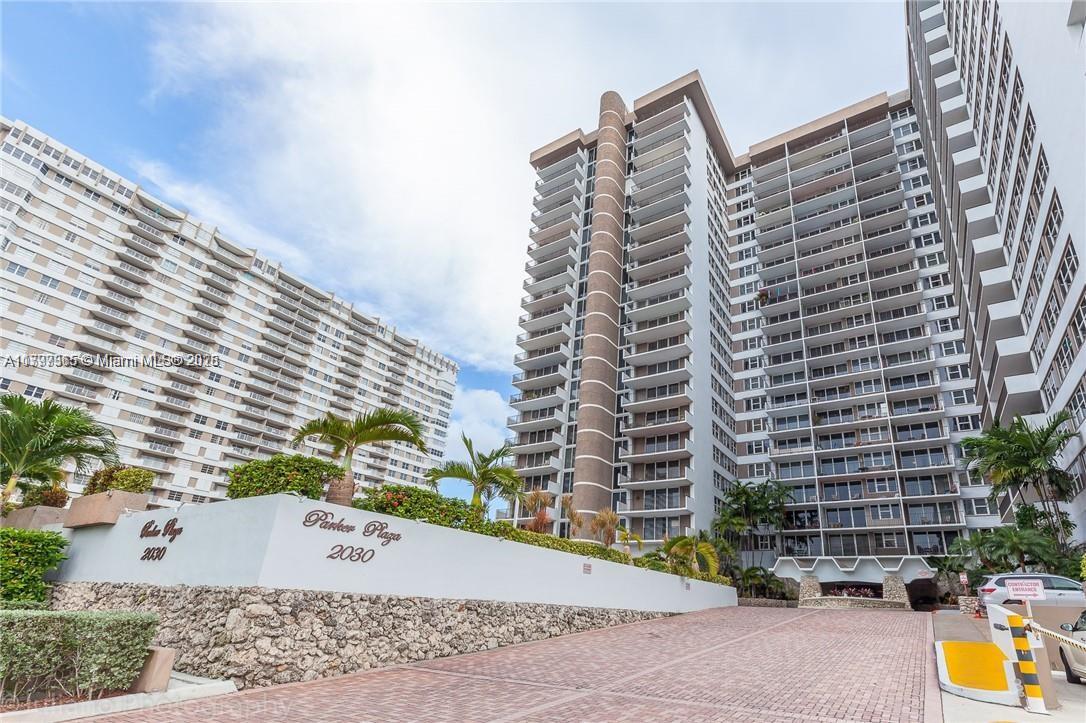
Active
$699,000
2
bds
|
2
ba
|
1,312
sqft
|
built
1970
2030 S Ocean Dr, Hallandale Beach, FL 33009
$-3,149
Cash flow
-23.5%
Cash-on-Cash Return
0.7%
Cap rate
0.5%
Rent to Value Ratio

Active
$599,000
2
bds
|
2
ba
|
1,248
sqft
|
built
1970
2030 S Ocean Dr, Hallandale Beach, FL 33009
$-2,932
Cash flow
-25.5%
Cash-on-Cash Return
0.3%
Cap rate
0.5%
Rent to Value Ratio
Active
$305,000
2
bds
|
2
ba
|
1,130
sqft
|
built
1976
800 Parkview Dr, Hallandale Beach, FL 33009
$-1,057
Cash flow
-18.1%
Cash-on-Cash Return
2.0%
Cap rate
0.9%
Rent to Value Ratio
Active
$810,000
2
bds
|
2
ba
|
1,422
sqft
|
built
1972
3180 S Ocean Dr, Hallandale Beach, FL 33009
$-4,043
Cash flow
-26.0%
Cash-on-Cash Return
0.2%
Cap rate
0.5%
Rent to Value Ratio
Active
$224,000
1
bds
|
2
ba
|
847
sqft
|
built
1969
619 NE 14th Ave, Hallandale Beach, FL 33009
$-182
Cash flow
-4.2%
Cash-on-Cash Return
5.2%
Cap rate
1.0%
Rent to Value Ratio
Active
$449,000
2
bds
|
2
ba
|
1,311
sqft
|
built
1971
137 Golden Isles Dr, Hallandale Beach, FL 33009
$-1,861
Cash flow
-21.6%
Cash-on-Cash Return
1.2%
Cap rate
0.6%
Rent to Value Ratio
Active
$359,000
1
bds
|
2
ba
|
1,300
sqft
|
built
1974
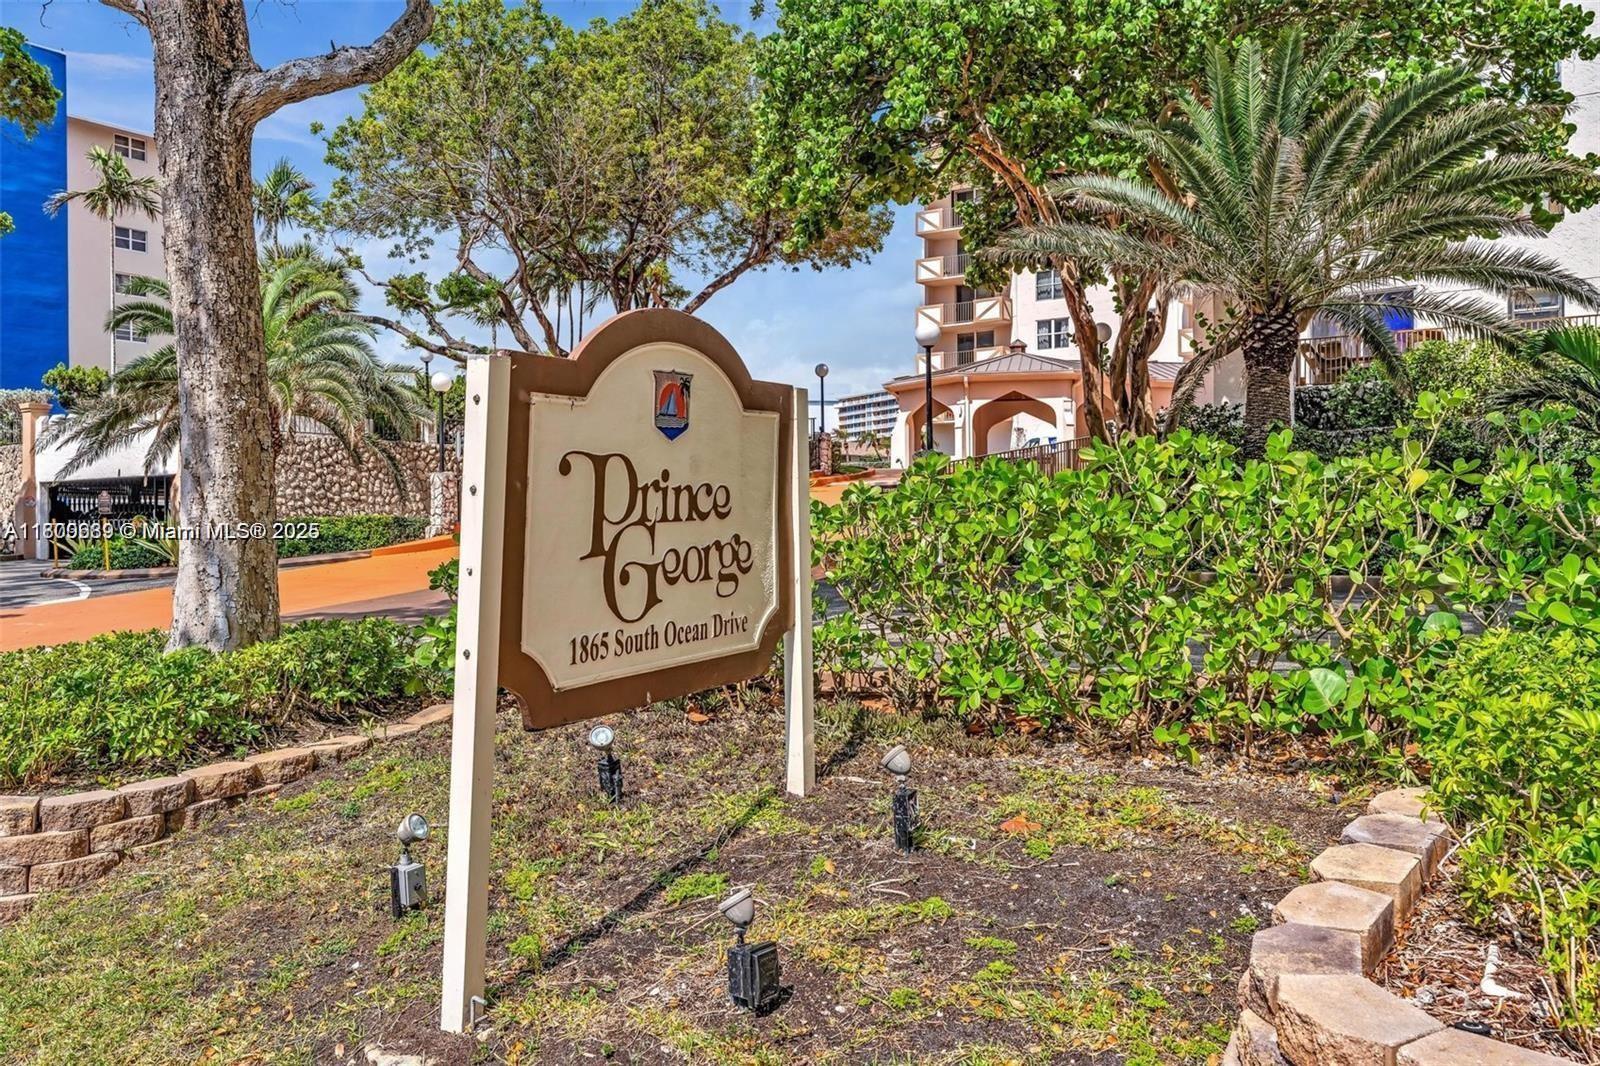
1865 S Ocean Dr, Hallandale Beach, FL 33009
$-1,398
Cash flow
-20.3%
Cash-on-Cash Return
1.5%
Cap rate
0.8%
Rent to Value Ratio
Active
$499,000
5
bds
|
2
ba
|
1,706
sqft
|
built
1952
520 NW 2nd Ave, Hallandale Beach, FL 33009
$-215
Cash flow
-2.2%
Cash-on-Cash Return
5.6%
Cap rate
0.8%
Rent to Value Ratio
Active
$975,000
3
bds
|
3
ba
|
3,084
sqft
|
built
2012
611 SW 8th St, Hallandale Beach, FL 33009
$-2,062
Cash flow
-11.0%
Cash-on-Cash Return
3.6%
Cap rate
0.5%
Rent to Value Ratio

Active
$215,000
1
bds
|
2
ba
|
1,075
sqft
|
built
1976
800 Parkview Dr, Hallandale Beach, FL 33009
$-878
Cash flow
-21.3%
Cash-on-Cash Return
1.2%
Cap rate
1.0%
Rent to Value Ratio
Active
$290,000
2
bds
|
2
ba
|
1,260
sqft
|
built
1974
400 NE 12th Ave, Hallandale Beach, FL 33009
$-623
Cash flow
-11.2%
Cash-on-Cash Return
3.6%
Cap rate
0.9%
Rent to Value Ratio
Active
$3,600,000
6
bds
|
5
ba
|
6,001
sqft
|
built
1959
418 Tamarind Dr, Hallandale Beach, FL 33009
$-17,320
Cash flow
-25.1%
Cash-on-Cash Return
0.4%
Cap rate
0.3%
Rent to Value Ratio
Active
$240,000
1
bds
|
2
ba
|
915
sqft
|
built
1981
400 Leslie Dr, Hallandale Beach, FL 33009
$-147
Cash flow
-3.2%
Cash-on-Cash Return
5.4%
Cap rate
1.0%
Rent to Value Ratio

Active
$595,000
3
bds
|
2
ba
|
1,597
sqft
|
built
2007
1745 E Hallandale Beach Blvd, Hallandale Beach, FL 33009
$-2,945
Cash flow
-25.8%
Cash-on-Cash Return
0.2%
Cap rate
0.7%
Rent to Value Ratio
Active
$490,000
2
bds
|
1
ba
|
1,162
sqft
|
built
1962
421 SW 11th Ave, Hallandale Beach, FL 33009
$-134
Cash flow
-1.4%
Cash-on-Cash Return
5.8%
Cap rate
0.7%
Rent to Value Ratio
Active
$775,000
2
bds
|
3
ba
|
1,696
sqft
|
built
1976
2318 NE 7th St, Hallandale Beach, FL 33009
$-3,399
Cash flow
-22.9%
Cash-on-Cash Return
0.9%
Cap rate
0.4%
Rent to Value Ratio
Active
$319,999
1
bds
|
2
ba
|
828
sqft
|
built
1974
500 Three Islands Blvd, Hallandale Beach, FL 33009
$-1,307
Cash flow
-21.3%
Cash-on-Cash Return
1.2%
Cap rate
0.7%
Rent to Value Ratio
Active
$895,000
2
bds
|
2
ba
|
1,240
sqft
|
built
1971
1980 S Ocean Dr, Hallandale Beach, FL 33009
$-4,429
Cash flow
-25.8%
Cash-on-Cash Return
0.2%
Cap rate
0.3%
Rent to Value Ratio

Active
$268,000
2
bds
|
2
ba
|
1,400
sqft
|
built
1975
600 Three Islands Blvd, Hallandale Beach, FL 33009
$-820
Cash flow
-16.0%
Cash-on-Cash Return
2.5%
Cap rate
1.0%
Rent to Value Ratio
Active
$498,000
2
bds
|
2
ba
|
1,354
sqft
|
built
2007
1745 E Hallandale Beach Blvd, Hallandale Beach, FL 33009
$-2,181
Cash flow
-22.8%
Cash-on-Cash Return
0.9%
Cap rate
0.6%
Rent to Value Ratio
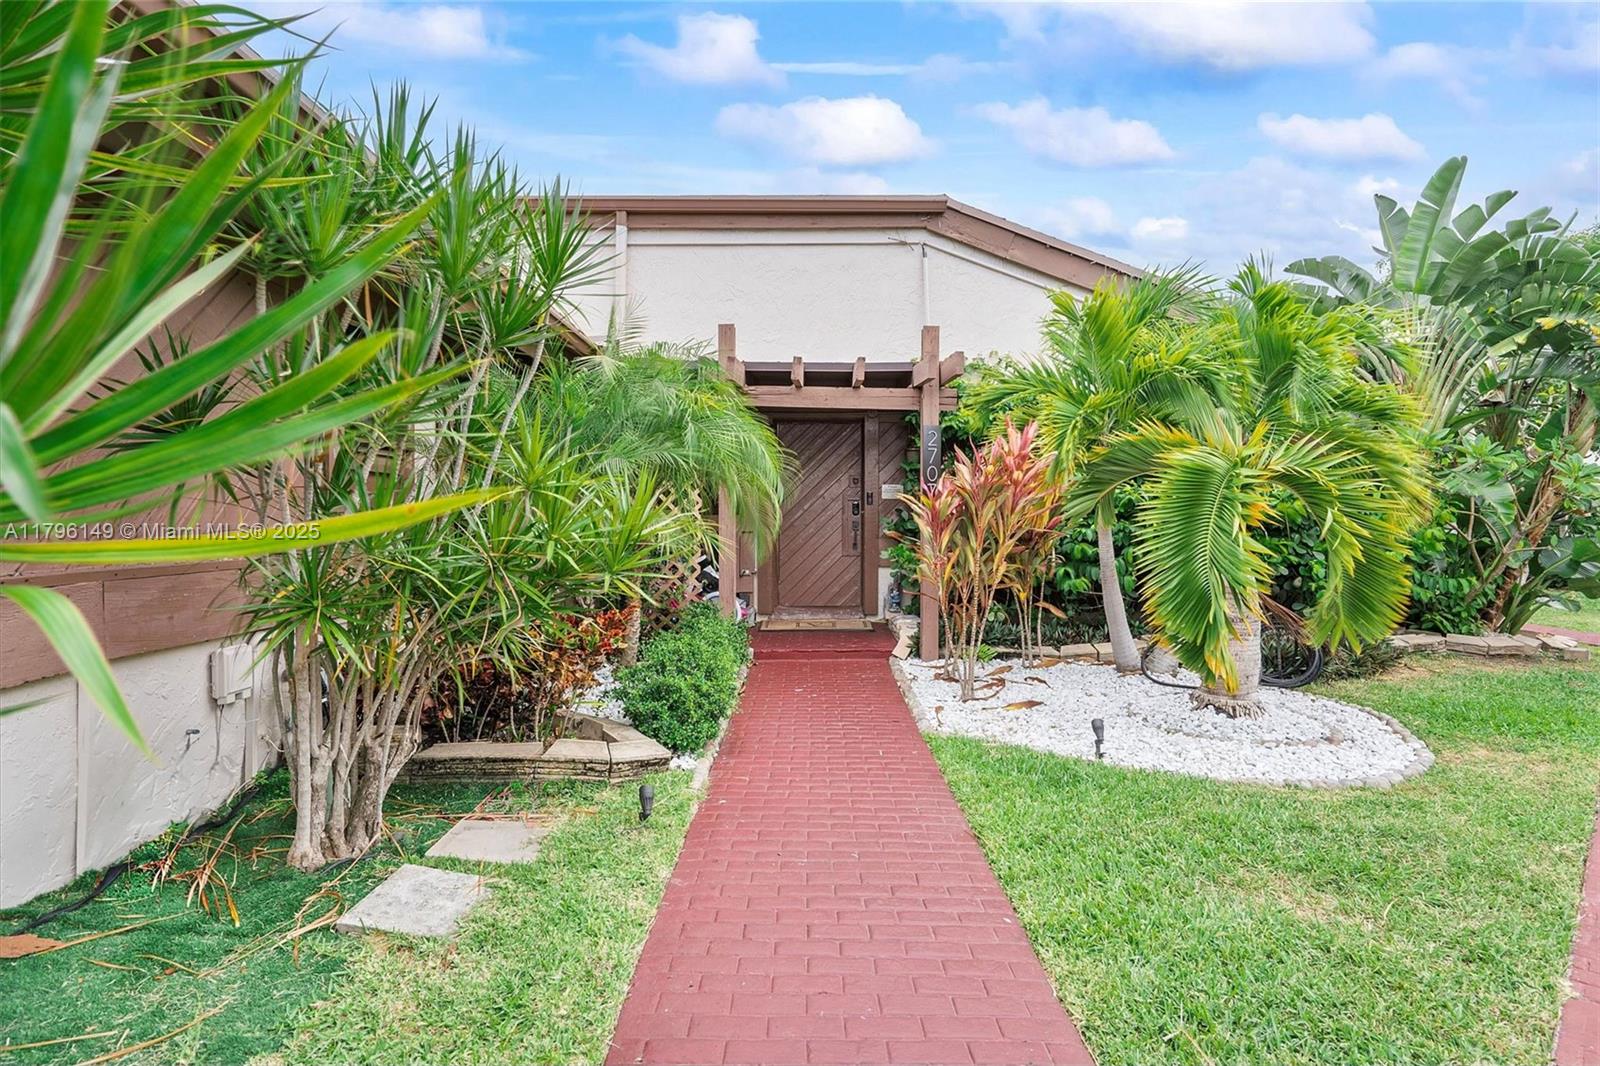
Active
$699,000
3
bds
|
2
ba
|
1,624
sqft
|
built
1980
2707 S Parkview Dr, Hallandale Beach, FL 33009
$-2,295
Cash flow
-17.1%
Cash-on-Cash Return
2.2%
Cap rate
0.6%
Rent to Value Ratio
Active
$539,000
2
bds
|
2
ba
|
1,248
sqft
|
built
1970
2030 S Ocean Dr, Hallandale Beach, FL 33009
$-1,926
Cash flow
-18.6%
Cash-on-Cash Return
1.9%
Cap rate
0.6%
Rent to Value Ratio

Active
$445,000
2
bds
|
2
ba
|
1,081
sqft
|
built
2007
1745 E Hallandale Beach Blvd, Hallandale Beach, FL 33009
$-1,927
Cash flow
-22.6%
Cash-on-Cash Return
1.0%
Cap rate
0.7%
Rent to Value Ratio
Active
$319,000
1
bds
|
2
ba
|
828
sqft
|
built
1974
500 Three Islands Blvd, Hallandale Beach, FL 33009
$-965
Cash flow
-15.8%
Cash-on-Cash Return
2.5%
Cap rate
0.8%
Rent to Value Ratio
Active
$369,000
2
bds
|
2
ba
|
1,300
sqft
|
built
1974
1865 S Ocean Dr, Hallandale Beach, FL 33009
$-1,234
Cash flow
-17.4%
Cash-on-Cash Return
2.1%
Cap rate
0.8%
Rent to Value Ratio
Active
$374,900
1
bds
|
2
ba
|
870
sqft
|
built
1972
1985 S Ocean Dr, Hallandale Beach, FL 33009
$-1,560
Cash flow
-21.7%
Cash-on-Cash Return
1.2%
Cap rate
0.7%
Rent to Value Ratio

Active
$229,900
1
bds
|
1
ba
|
730
sqft
|
built
1986
450 Golden Isles Dr, Hallandale Beach, FL 33009
$-794
Cash flow
-18.0%
Cash-on-Cash Return
2.0%
Cap rate
0.9%
Rent to Value Ratio

Active
$345,000
1
bds
|
2
ba
|
870
sqft
|
built
1971
1980 S Ocean Dr, Hallandale Beach, FL 33009
$-1,442
Cash flow
-21.8%
Cash-on-Cash Return
1.1%
Cap rate
0.7%
Rent to Value Ratio
Active
$349,999
2
bds
|
2
ba
|
1,190
sqft
|
built
1980
462 Golden Isles Dr, Hallandale Beach, FL 33009
$-1,141
Cash flow
-17.0%
Cash-on-Cash Return
2.2%
Cap rate
0.8%
Rent to Value Ratio
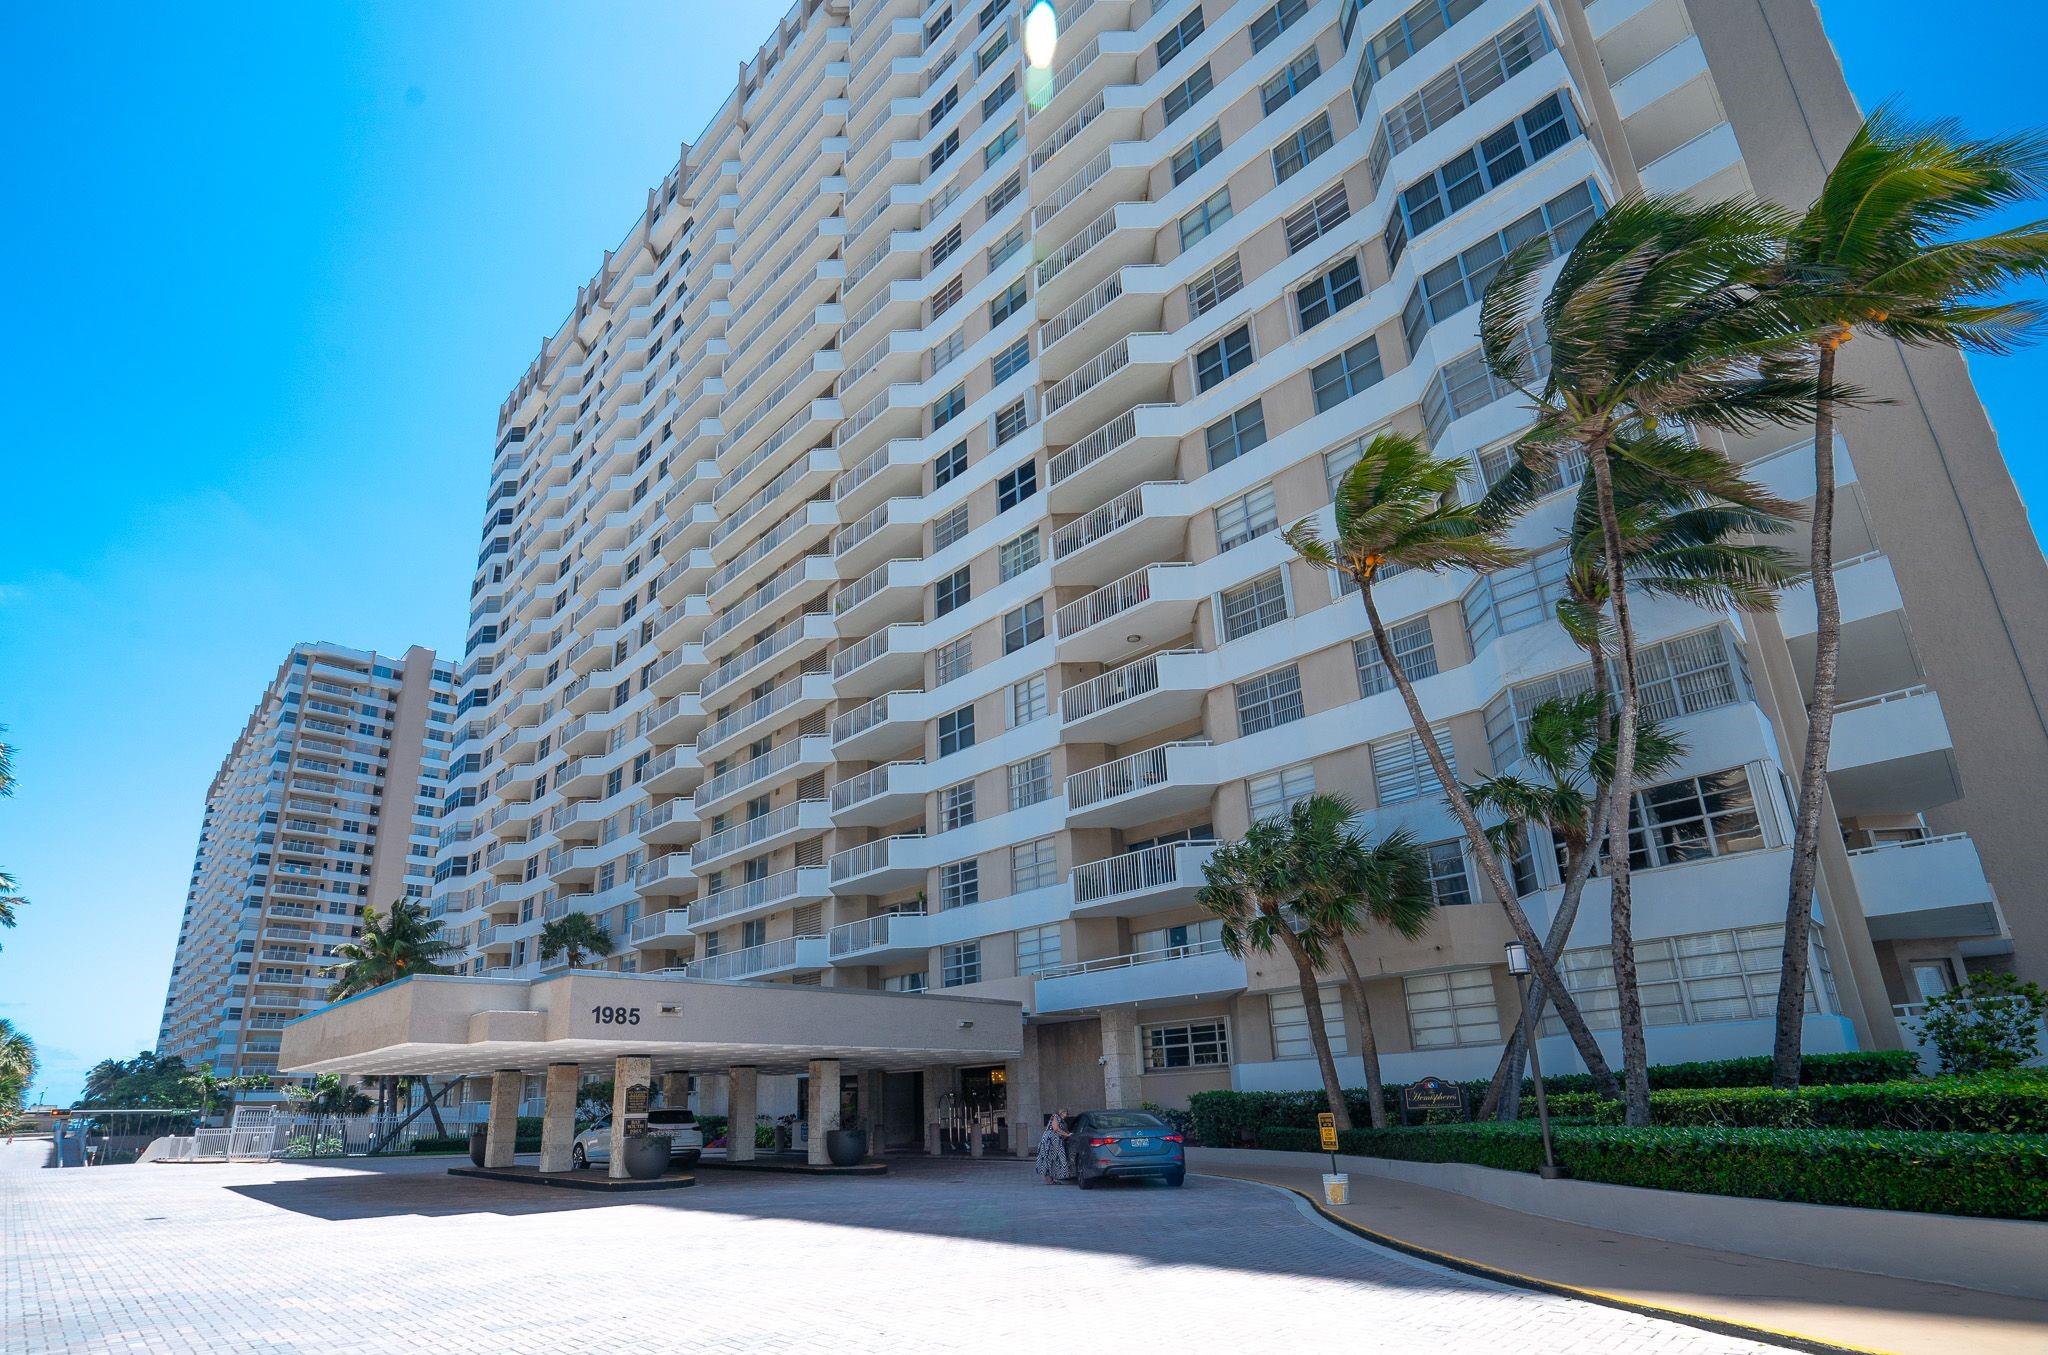
Active
$359,000
1
bds
|
2
ba
|
870
sqft
|
built
1972
1985 S Ocean Dr, Hallandale Beach, FL 33009
$-1,402
Cash flow
-20.4%
Cash-on-Cash Return
1.5%
Cap rate
0.7%
Rent to Value Ratio
Active
$229,000
2
bds
|
2
ba
|
1,092
sqft
|
built
1969
619 NE 14th Ave, Hallandale Beach, FL 33009
$-187
Cash flow
-4.3%
Cash-on-Cash Return
5.2%
Cap rate
1.0%
Rent to Value Ratio

Active
$399,000
2
bds
|
2
ba
|
1,500
sqft
|
built
1974
500 Three Islands Blvd, Hallandale Beach, FL 33009
$-362
Cash flow
-4.7%
Cash-on-Cash Return
5.1%
Cap rate
0.9%
Rent to Value Ratio
Active
$269,000
1
bds
|
1
ba
|
870
sqft
|
built
1971
1980 S Ocean Dr, Hallandale Beach, FL 33009
$-1,028
Cash flow
-19.9%
Cash-on-Cash Return
1.6%
Cap rate
0.9%
Rent to Value Ratio
Active
$329,000
2
bds
|
2
ba
|
1,092
sqft
|
built
1970
301 NE 14th Ave, Hallandale Beach, FL 33009
$-967
Cash flow
-15.3%
Cash-on-Cash Return
2.6%
Cap rate
0.8%
Rent to Value Ratio

Active
$575,000
4
bds
|
3
ba
|
1,500
sqft
|
built
1956
722 SW 10th St, Hallandale Beach, FL 33009
$-1,182
Cash flow
-10.7%
Cash-on-Cash Return
3.7%
Cap rate
0.6%
Rent to Value Ratio
Active
$284,900
2
bds
|
2
ba
|
965
sqft
|
built
1980
250 Layne Blvd, Hallandale Beach, FL 33009
$-954
Cash flow
-17.5%
Cash-on-Cash Return
2.1%
Cap rate
0.8%
Rent to Value Ratio
Active
$337,800
2
bds
|
2
ba
|
1,420
sqft
|
built
1973
100 Golden Isles Dr, Hallandale Beach, FL 33009
$-996
Cash flow
-15.4%
Cash-on-Cash Return
2.6%
Cap rate
0.9%
Rent to Value Ratio
Active
$499,000
2
bds
|
2
ba
|
1,248
sqft
|
built
1970
2030 S Ocean Dr, Hallandale Beach, FL 33009
$-2,459
Cash flow
-25.7%
Cash-on-Cash Return
0.2%
Cap rate
0.6%
Rent to Value Ratio
Active
$260,000
2
bds
|
2
ba
|
1,020
sqft
|
built
1974
701 Three Islands Blvd, Hallandale Beach, FL 33009
$-704
Cash flow
-14.1%
Cash-on-Cash Return
2.9%
Cap rate
1.0%
Rent to Value Ratio