Hallandale Beach, FL Investment Properties for Sale
Browse homes for sale and investment properties in Hallandale Beach, FL. Refine your search by price, property type, or more.
Best cash flowing properties in Hallandale Beach, FL
Active
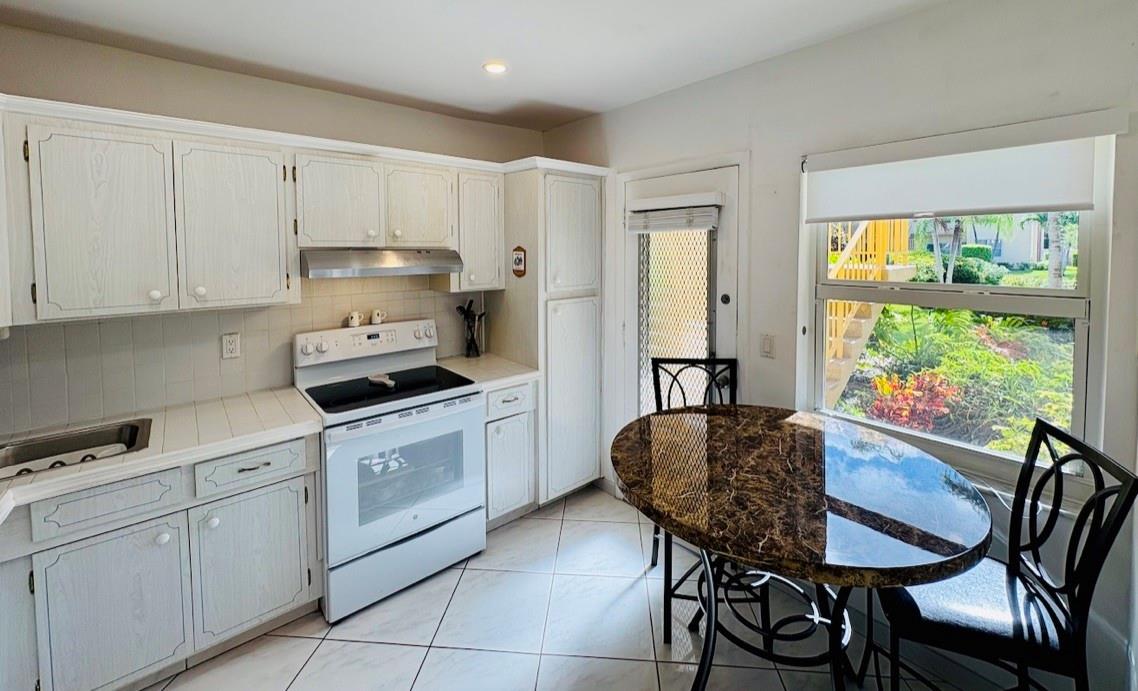
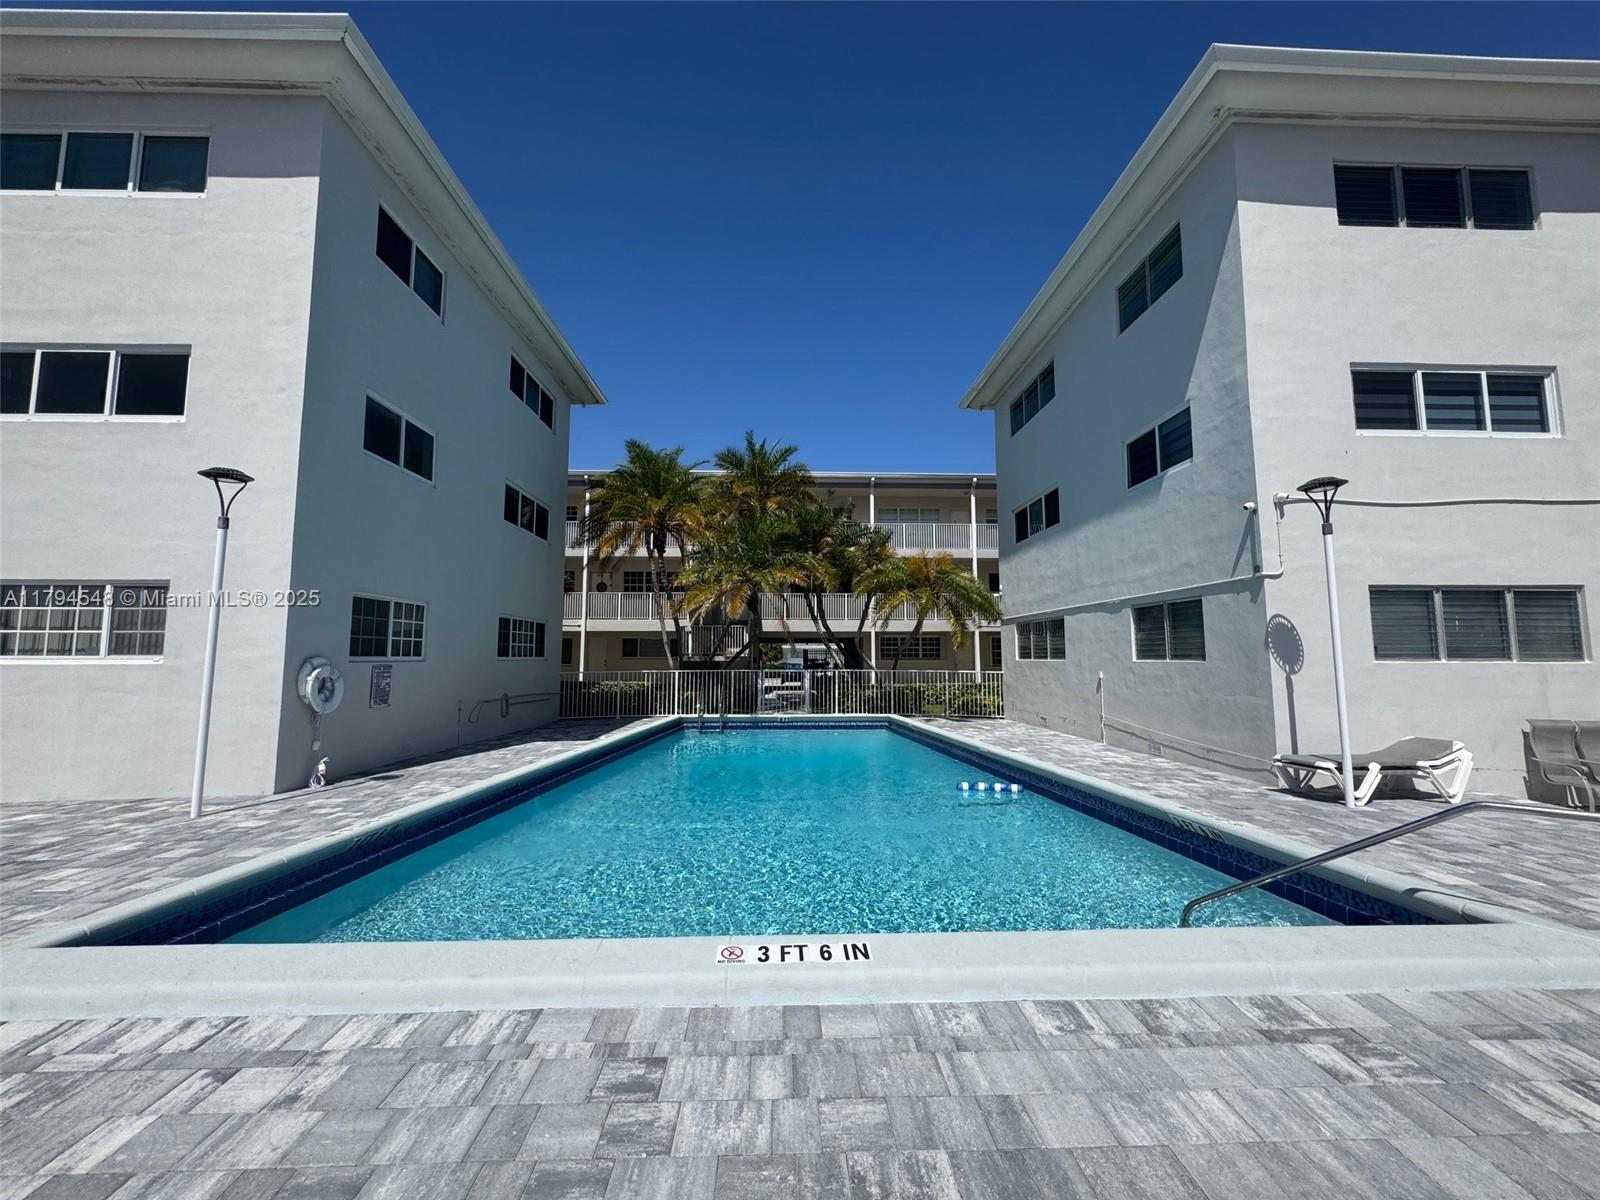
$179,900
1
bds
|
2
ba
|
1,071
sqft
|
built
1967
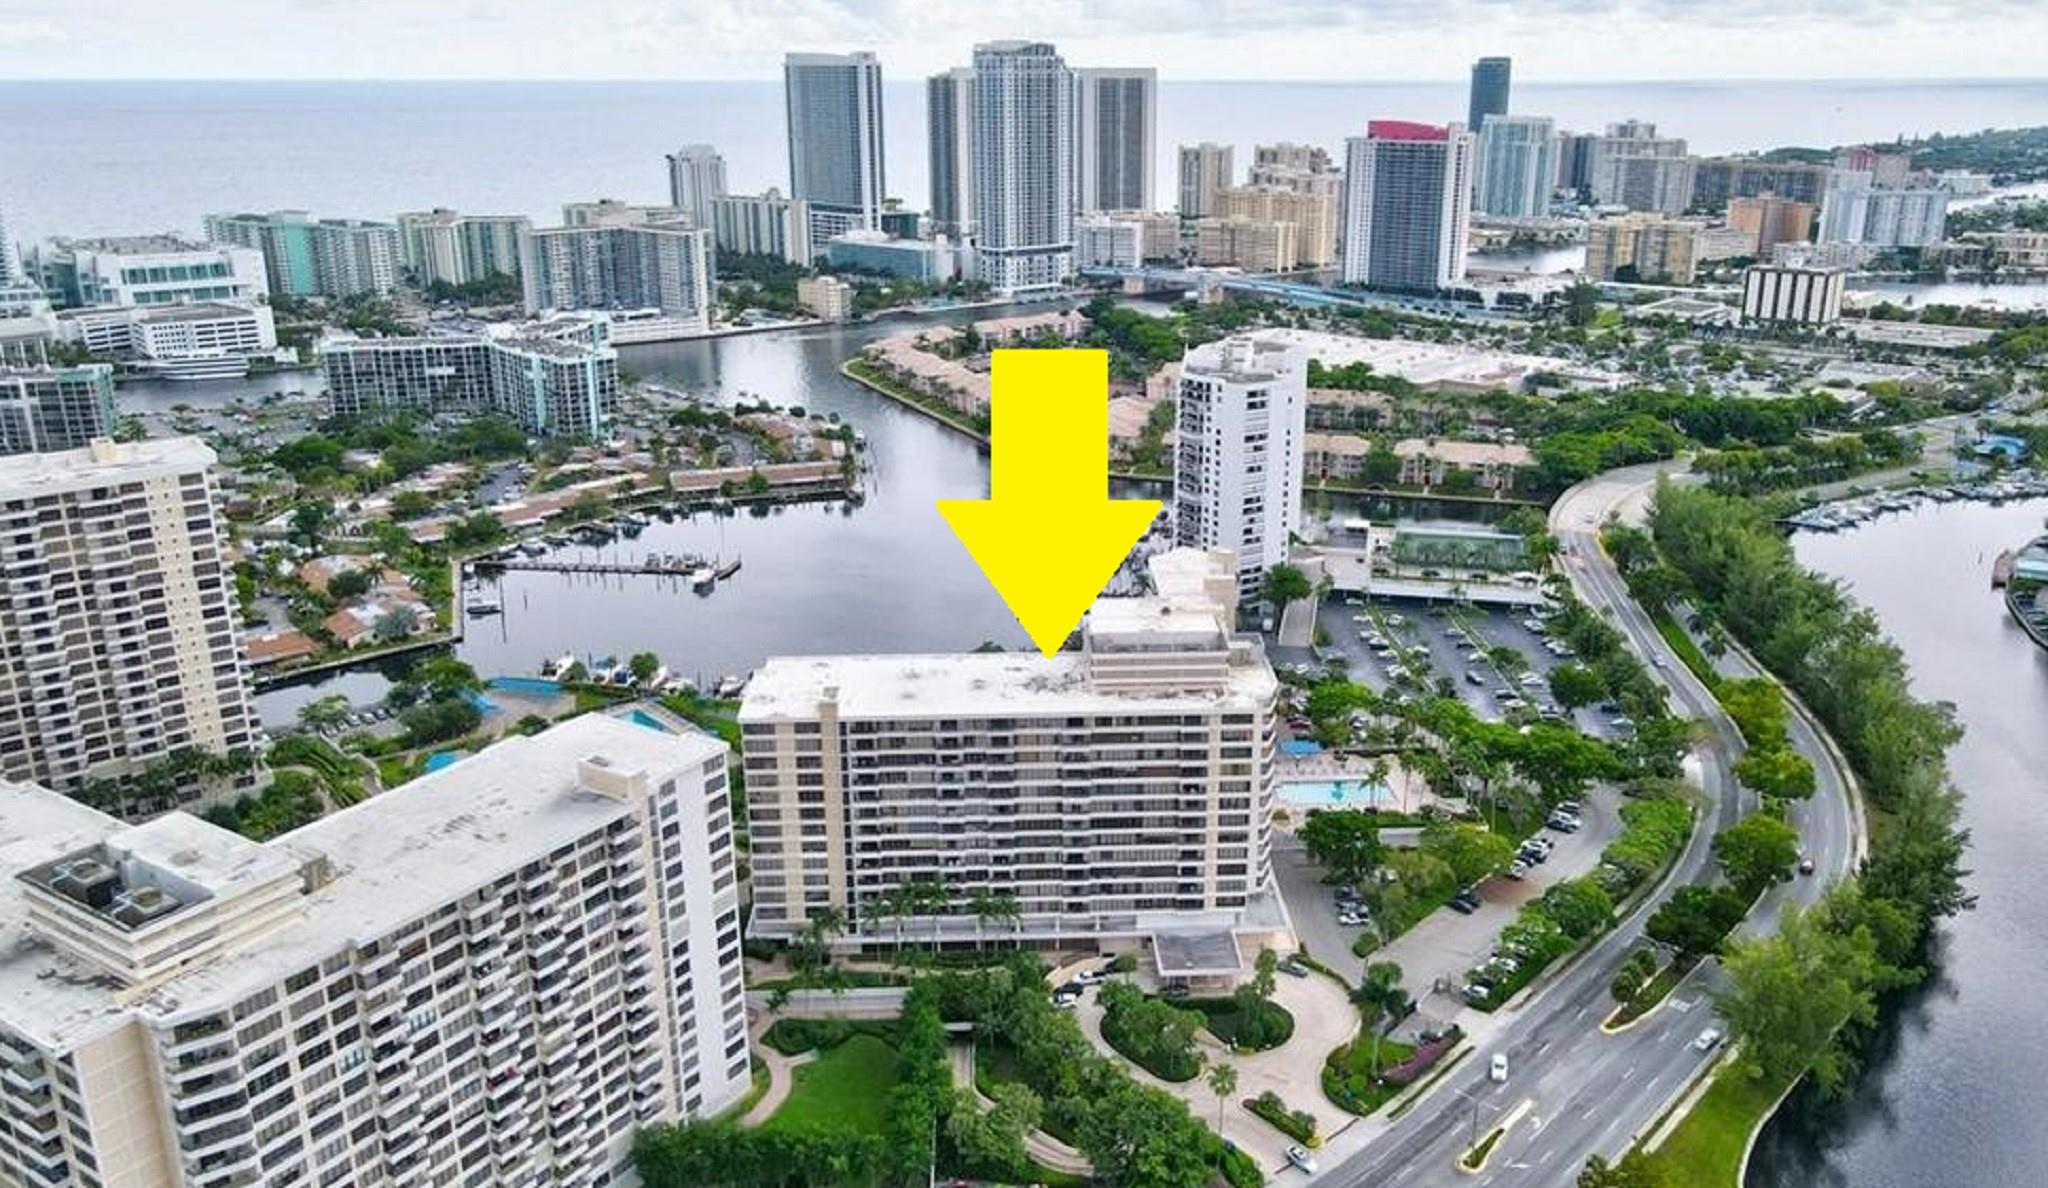
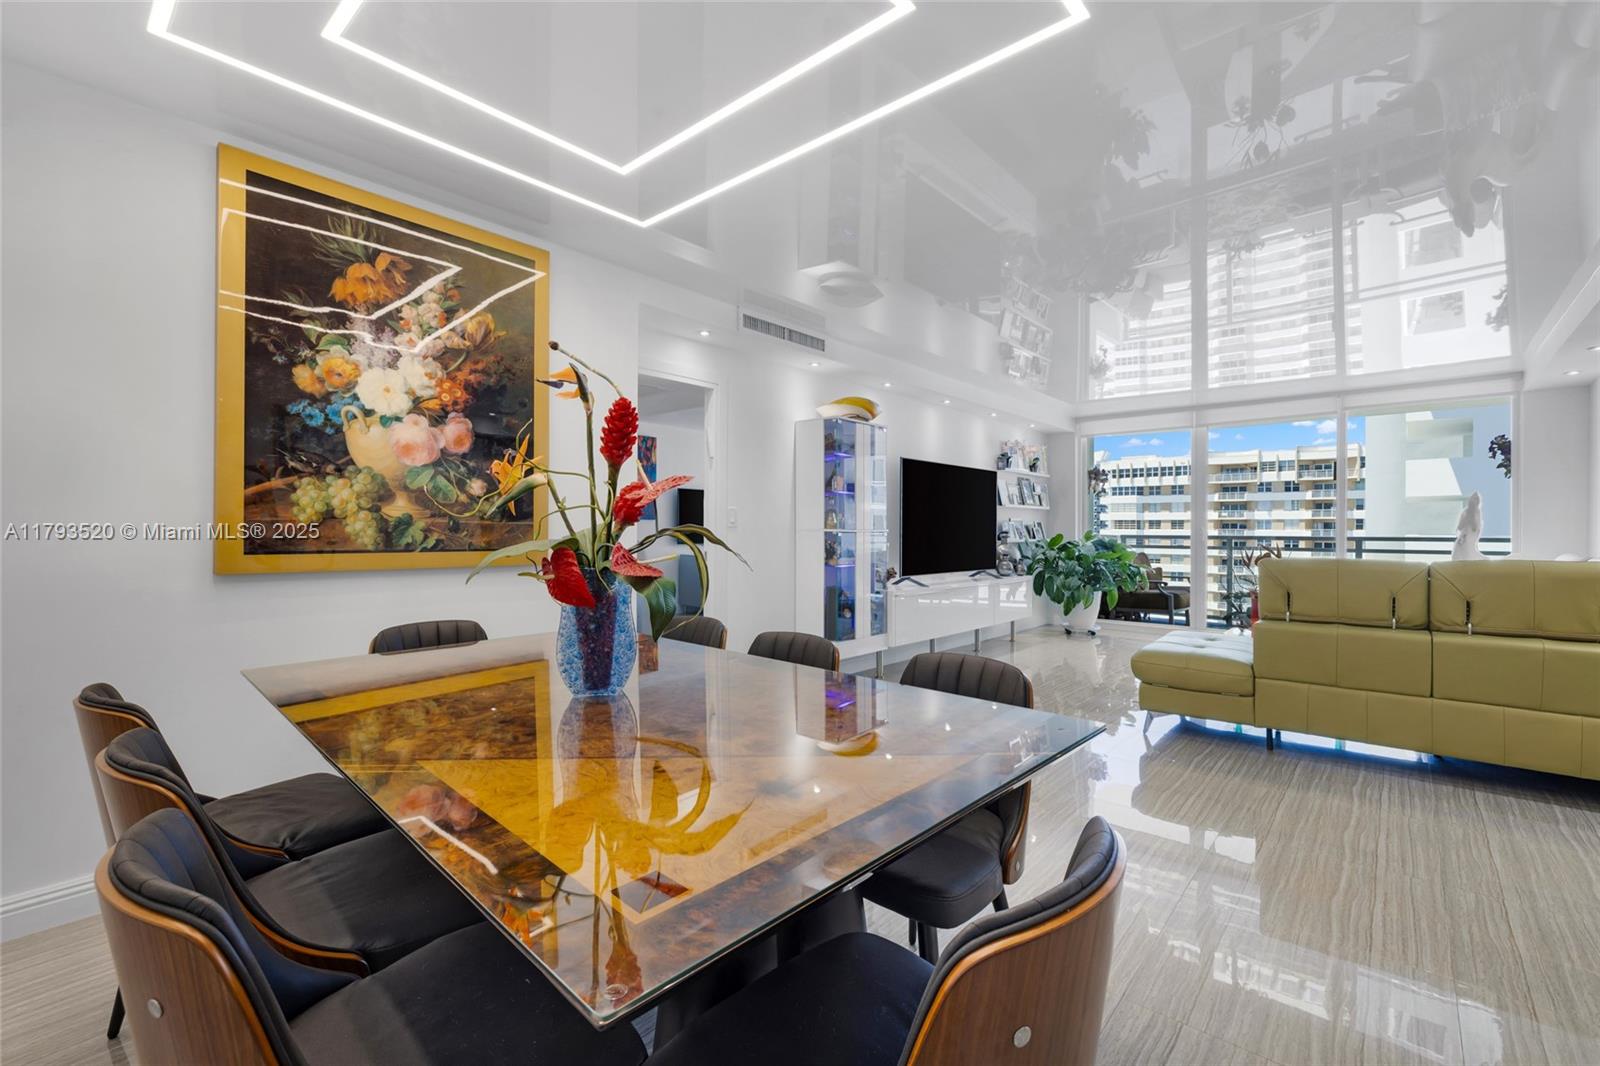
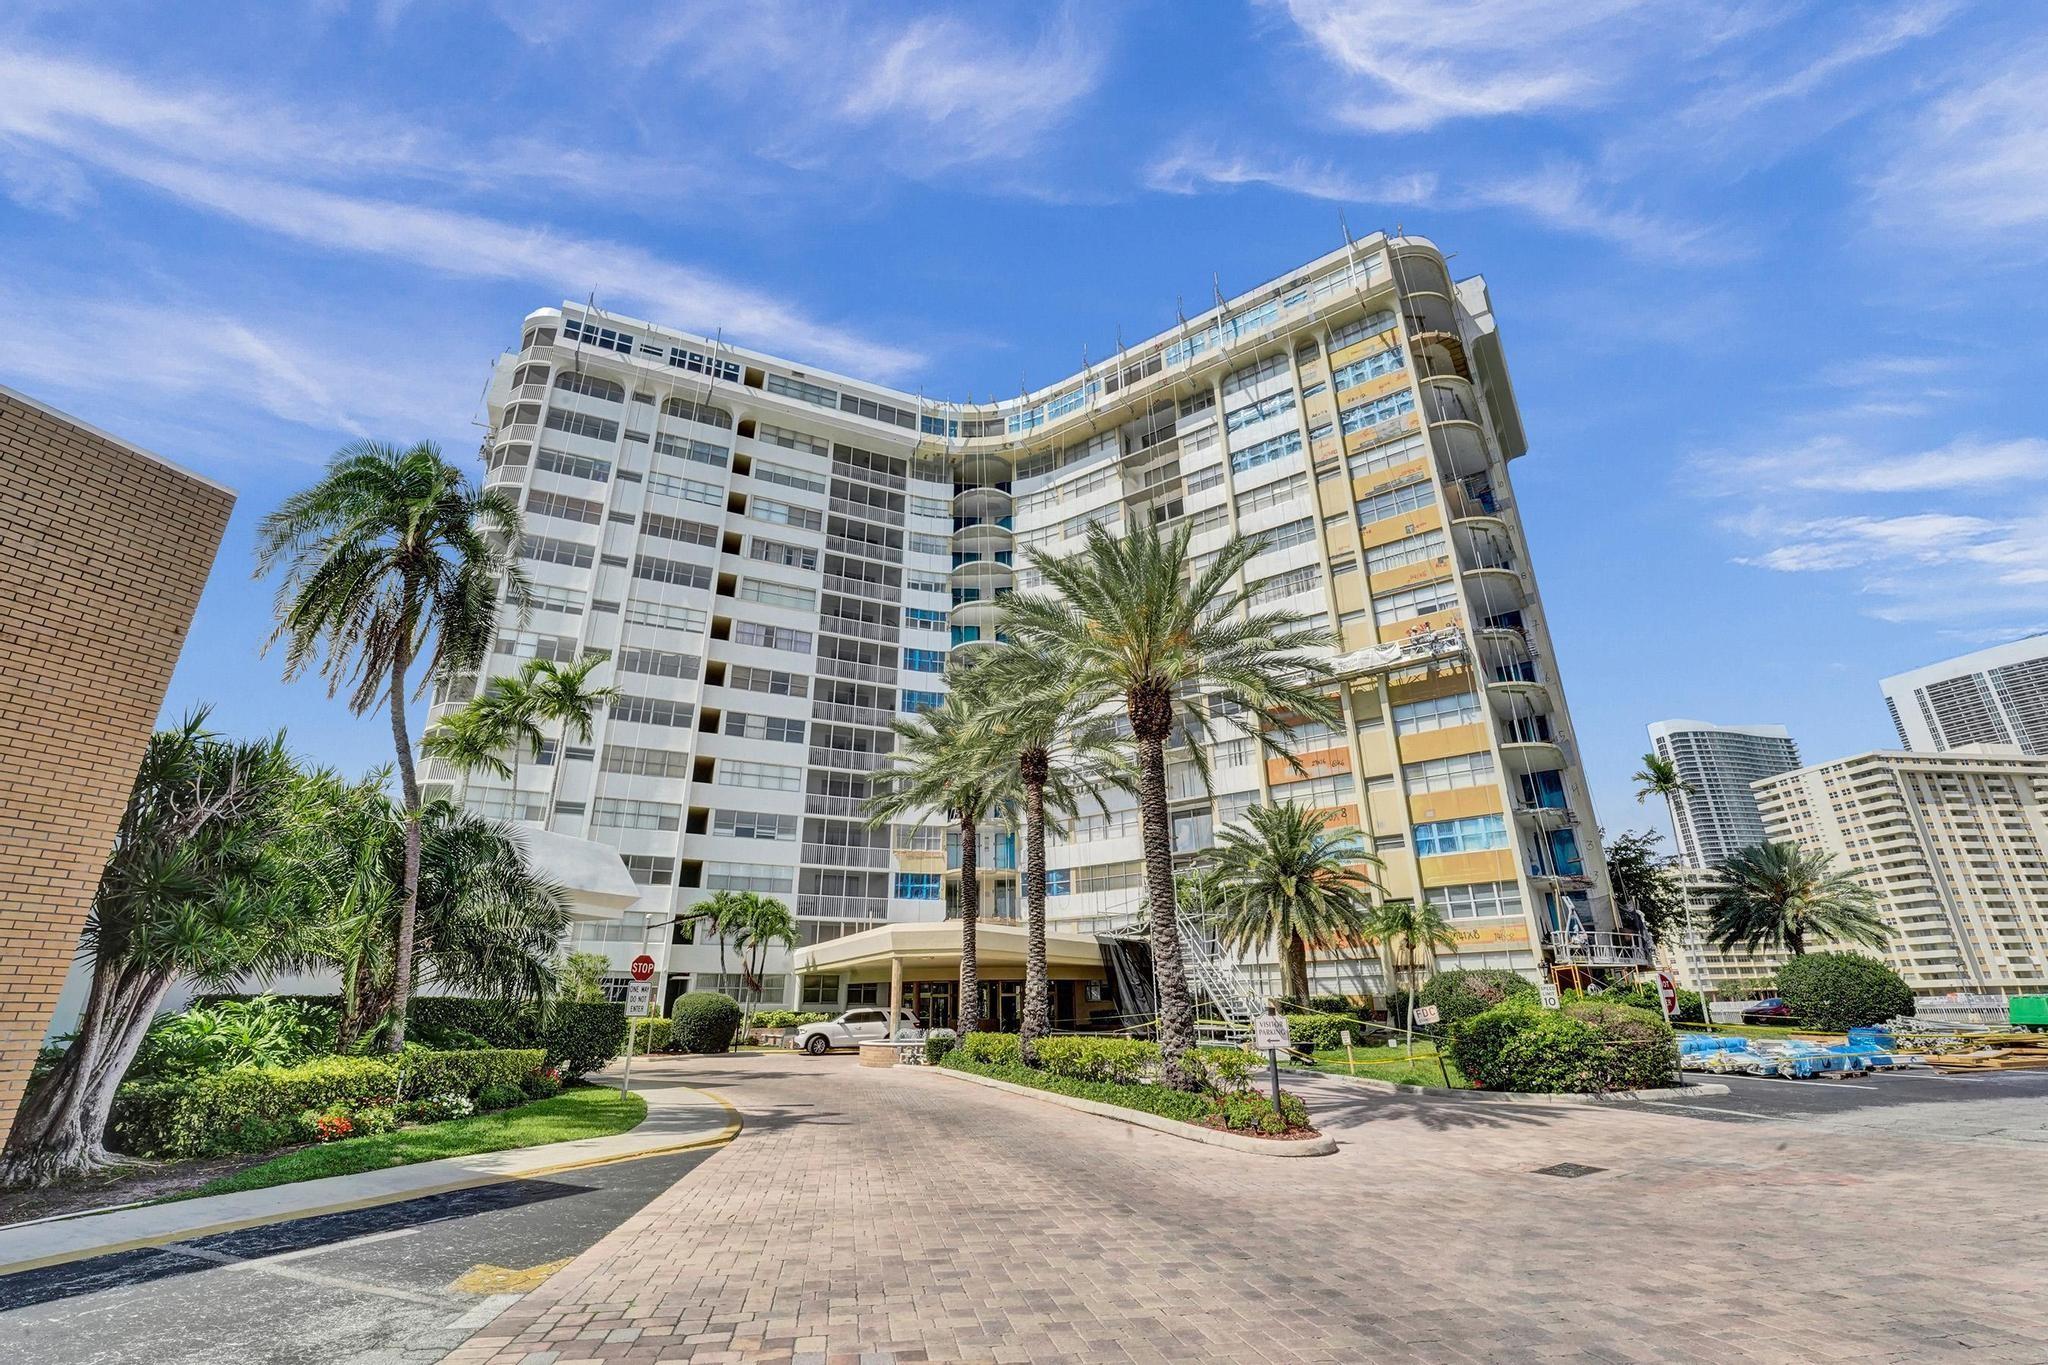
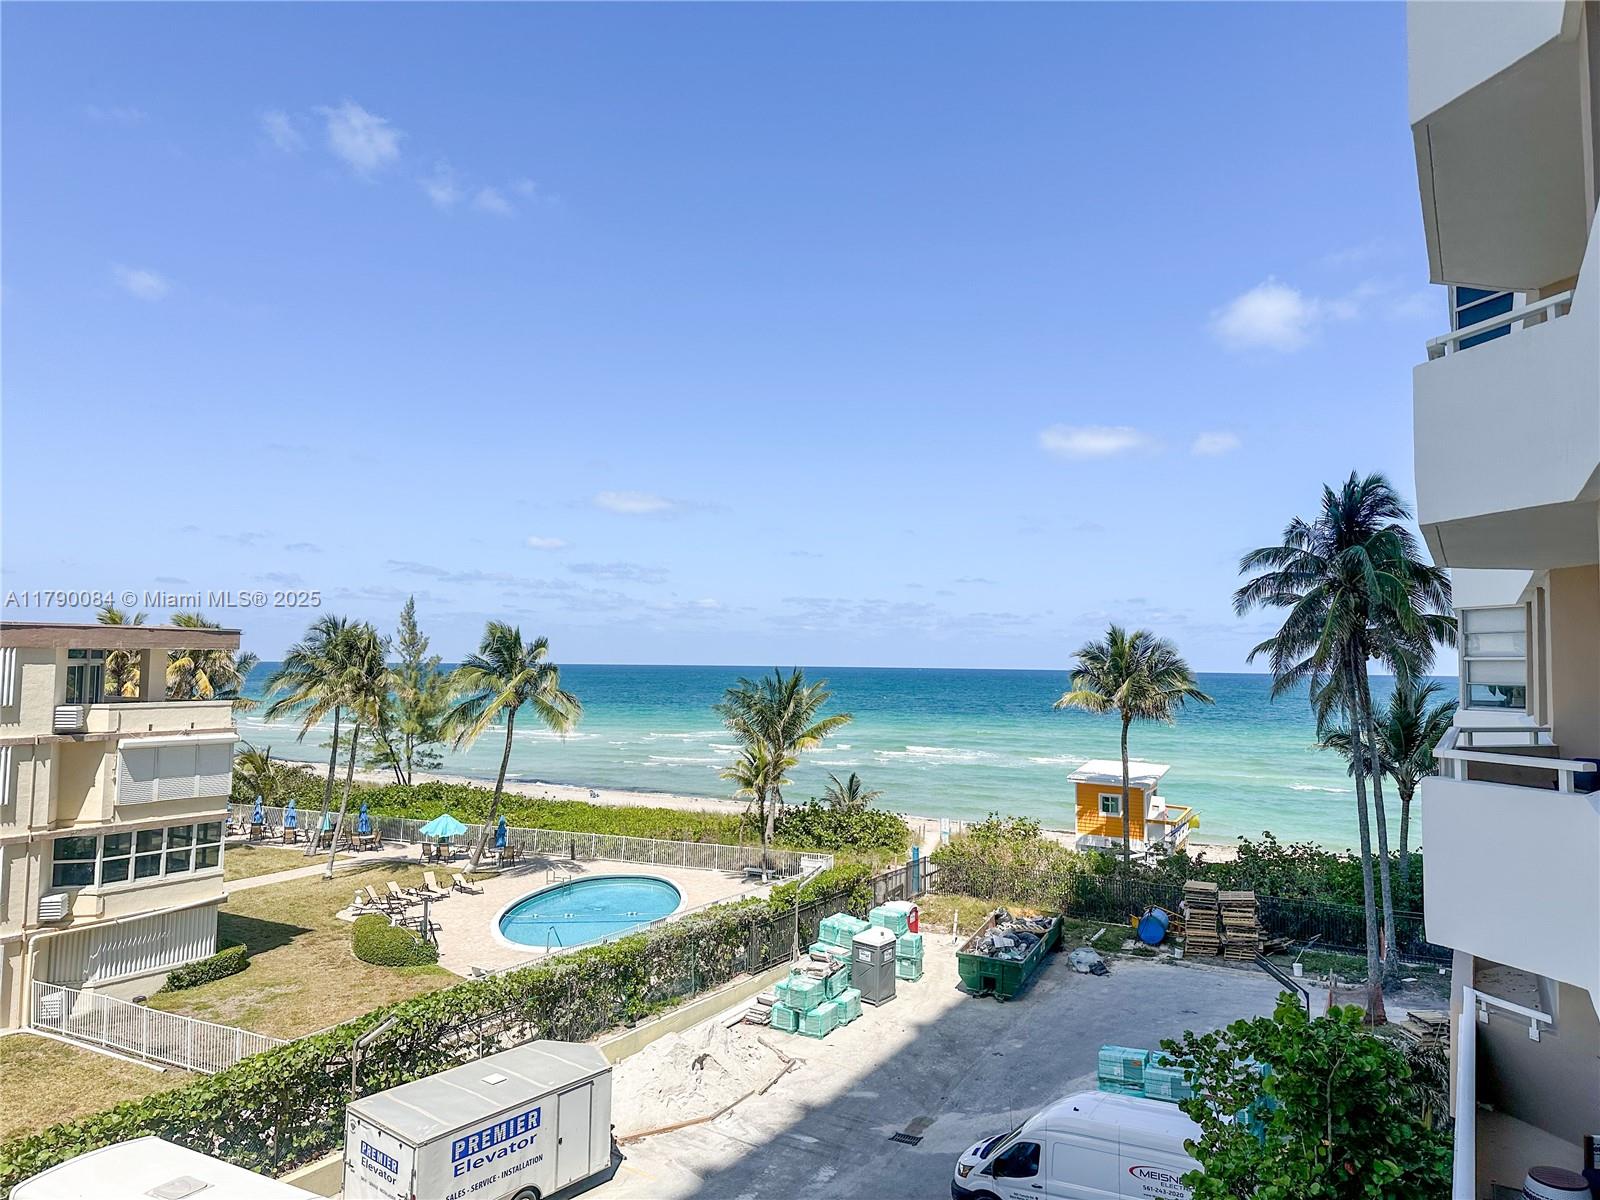
1250 Atlantic Shores Blvd, Hallandale Beach, FL 33009
$179
Cash flow
5.2%
Cash-on-Cash Return
7.3%
Cap rate
1.1%
Rent to Value Ratio
Active
$229,000
2
bds
|
2
ba
|
1,092
sqft
|
built
1969
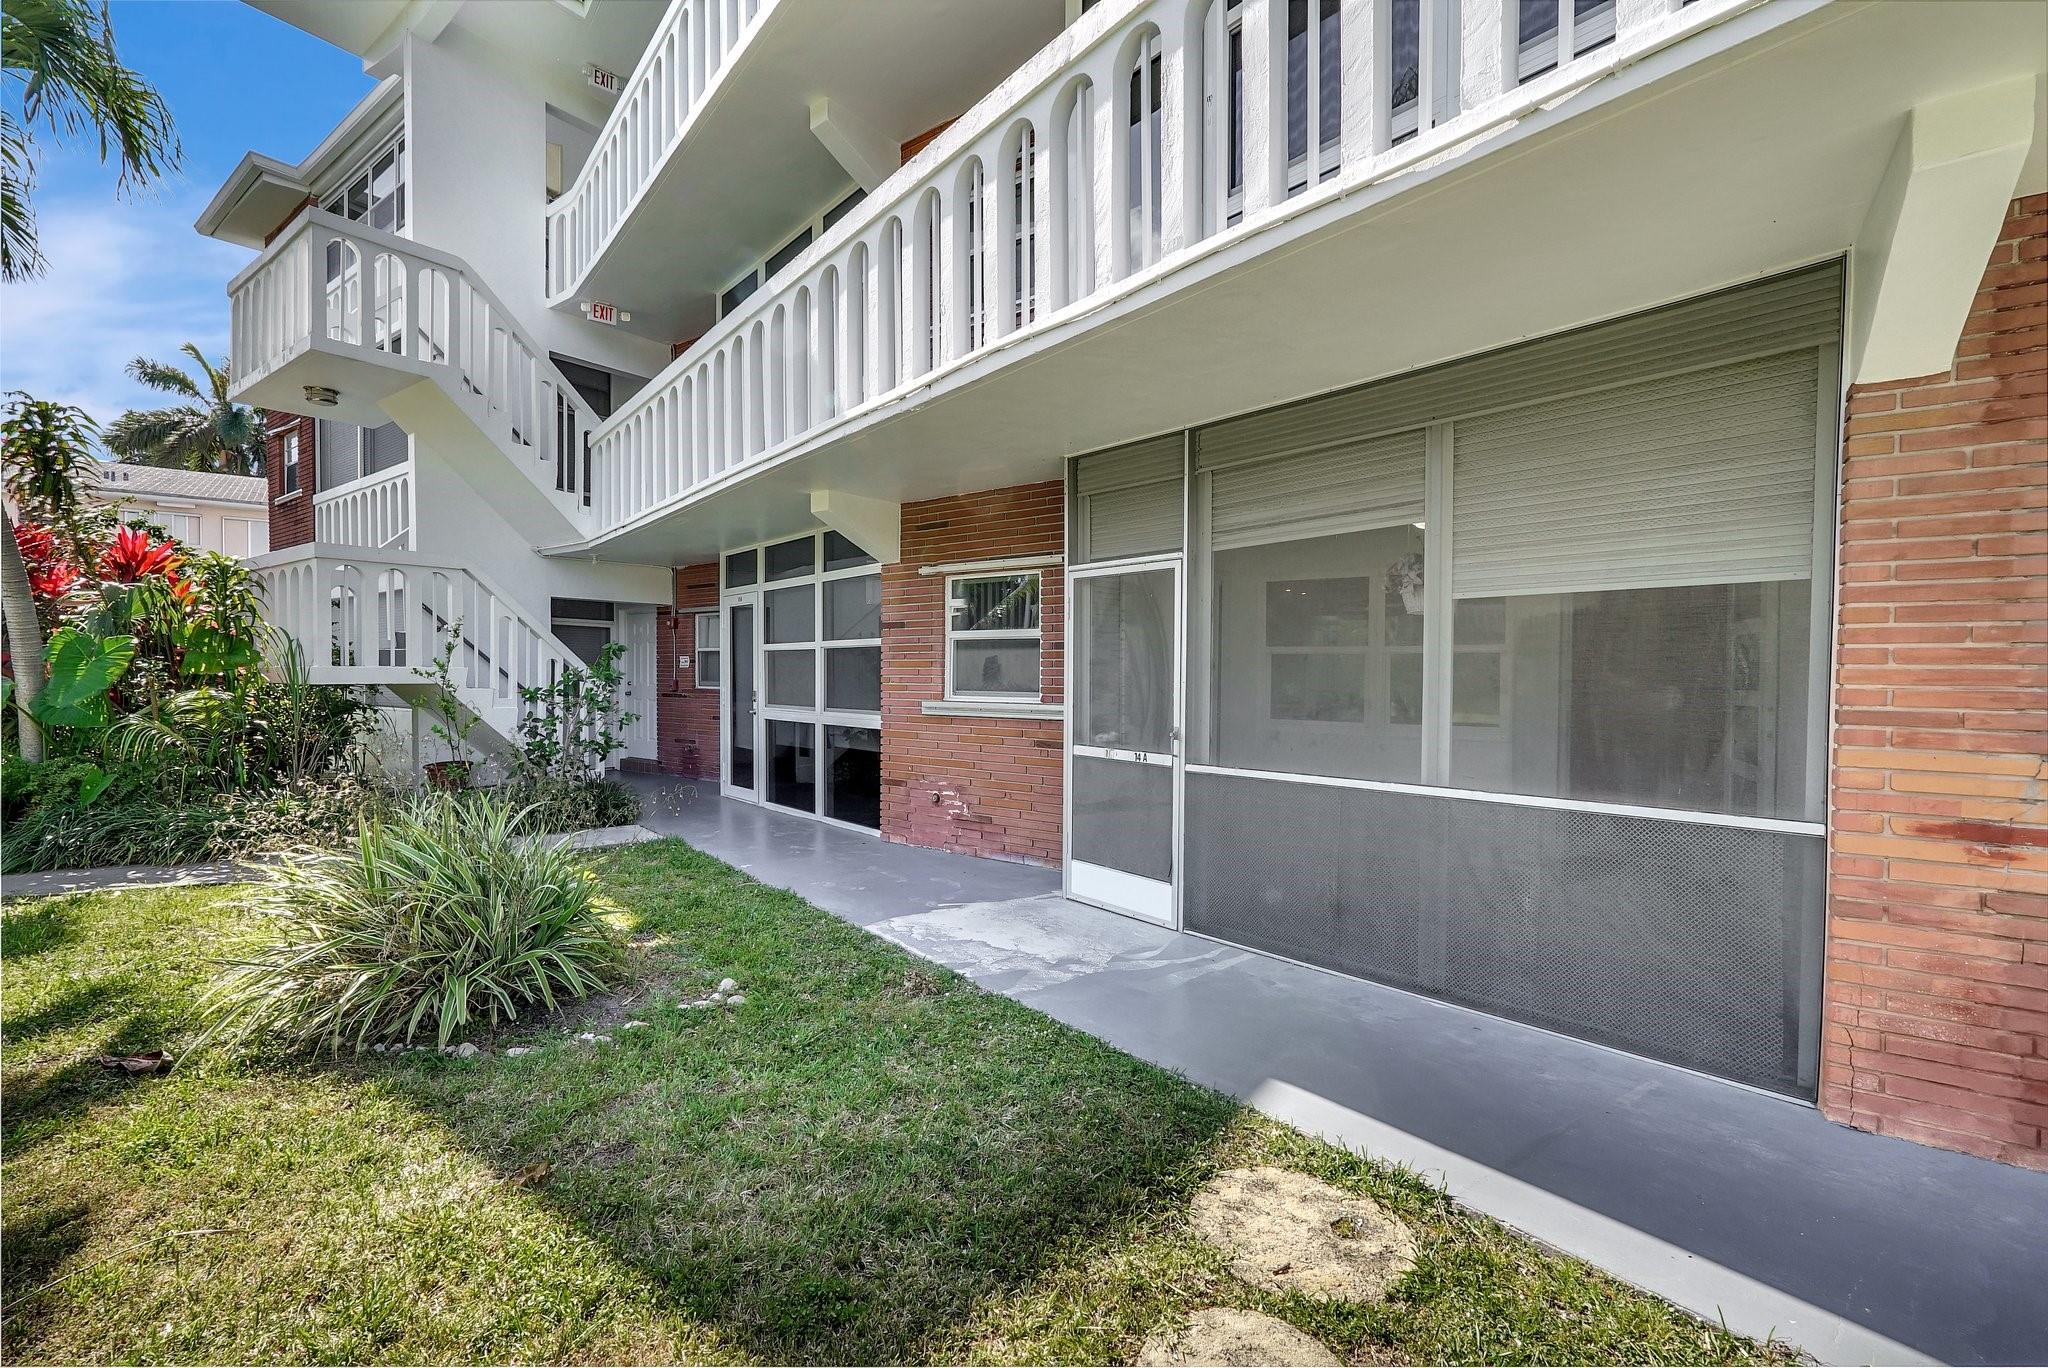
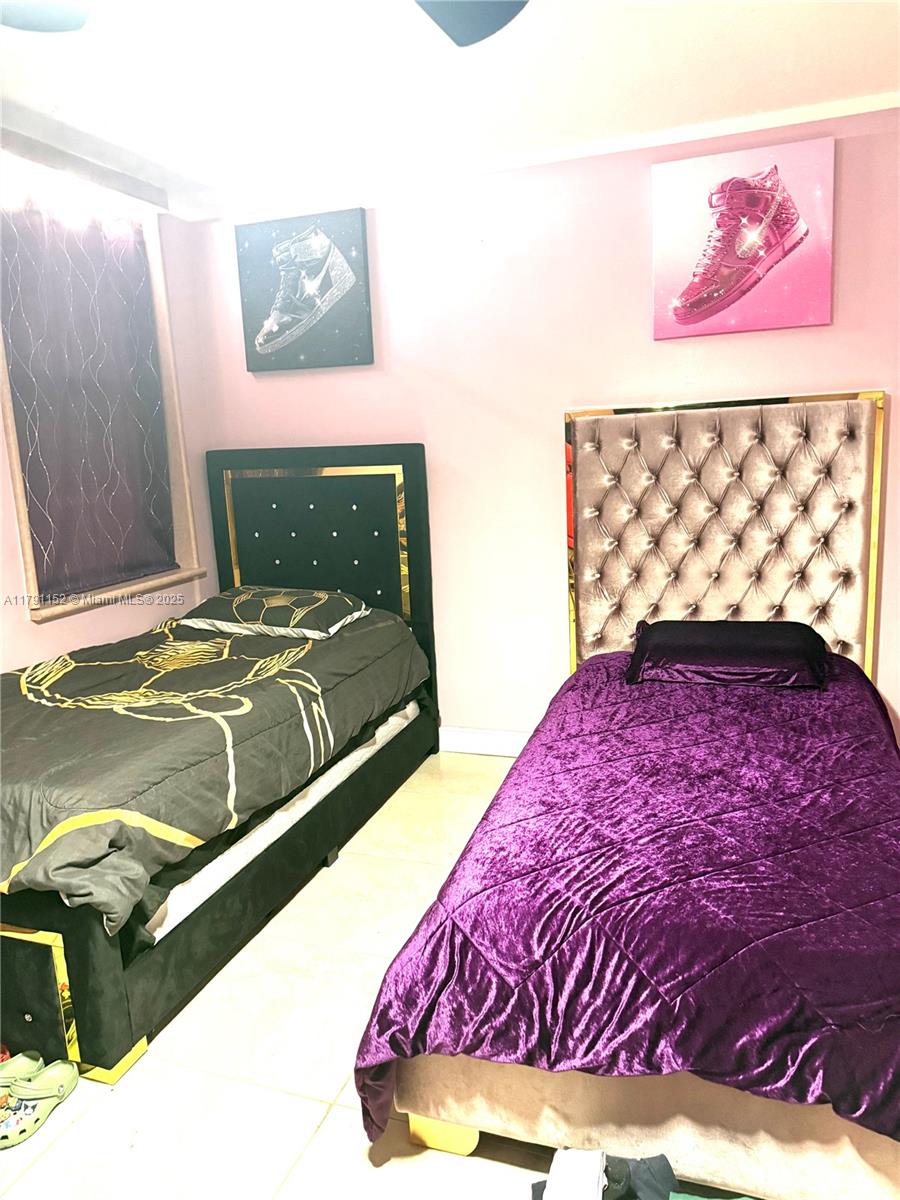
619 NE 14th Ave, Hallandale Beach, FL 33009
$-187
Cash flow
-4.3%
Cash-on-Cash Return
5.2%
Cap rate
1.0%
Rent to Value Ratio
741 out of 826 properties for sale in Hallandale Beach, FL
Limited Results Shown
Create a free account, or log in to reveal all property listings and enjoy the complete experience.
Active
$498,000
2
bds
|
2
ba
|
1,354
sqft
|
built
2007
1745 E Hallandale Beach Blvd, Hallandale Beach, FL 33009
$-2,181
Cash flow
-22.8%
Cash-on-Cash Return
0.9%
Cap rate
0.6%
Rent to Value Ratio
Active
$539,000
2
bds
|
2
ba
|
1,248
sqft
|
built
1970
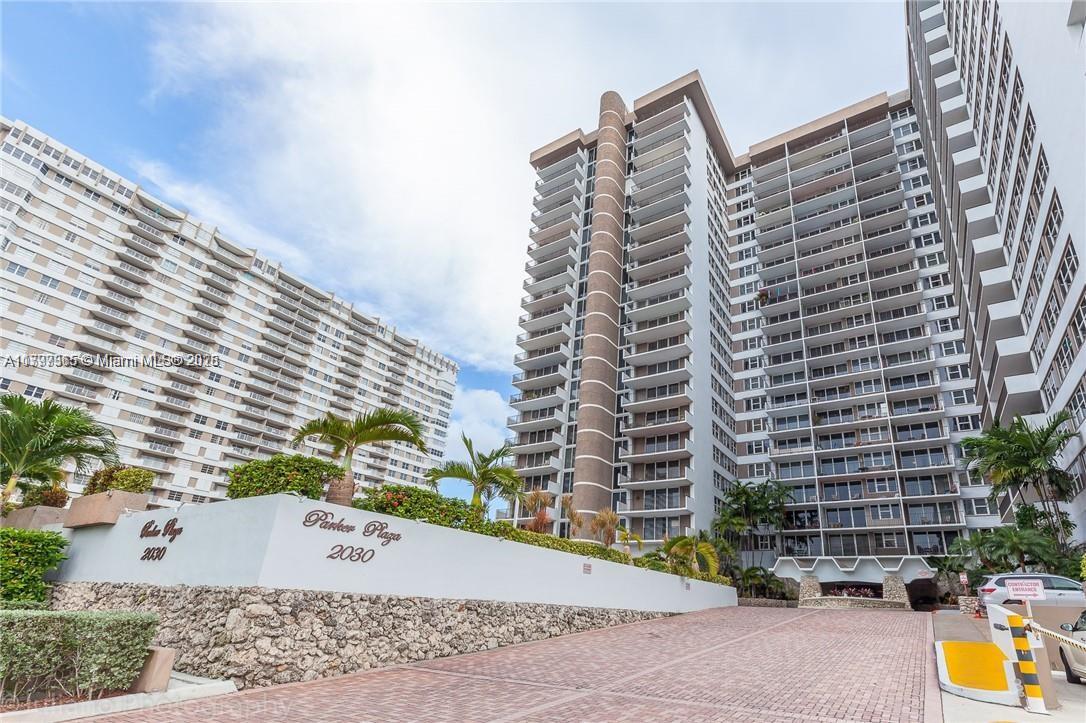
2030 S Ocean Dr, Hallandale Beach, FL 33009
$-1,926
Cash flow
-18.6%
Cash-on-Cash Return
1.9%
Cap rate
0.6%
Rent to Value Ratio

Active
$445,000
2
bds
|
2
ba
|
1,081
sqft
|
built
2007
1745 E Hallandale Beach Blvd, Hallandale Beach, FL 33009
$-1,927
Cash flow
-22.6%
Cash-on-Cash Return
1.0%
Cap rate
0.7%
Rent to Value Ratio
Active
$369,000
2
bds
|
2
ba
|
1,300
sqft
|
built
1974
1865 S Ocean Dr, Hallandale Beach, FL 33009
$-1,234
Cash flow
-17.4%
Cash-on-Cash Return
2.1%
Cap rate
0.8%
Rent to Value Ratio
Active
$319,000
1
bds
|
2
ba
|
828
sqft
|
built
1974
500 Three Islands Blvd, Hallandale Beach, FL 33009
$-965
Cash flow
-15.8%
Cash-on-Cash Return
2.5%
Cap rate
0.8%
Rent to Value Ratio
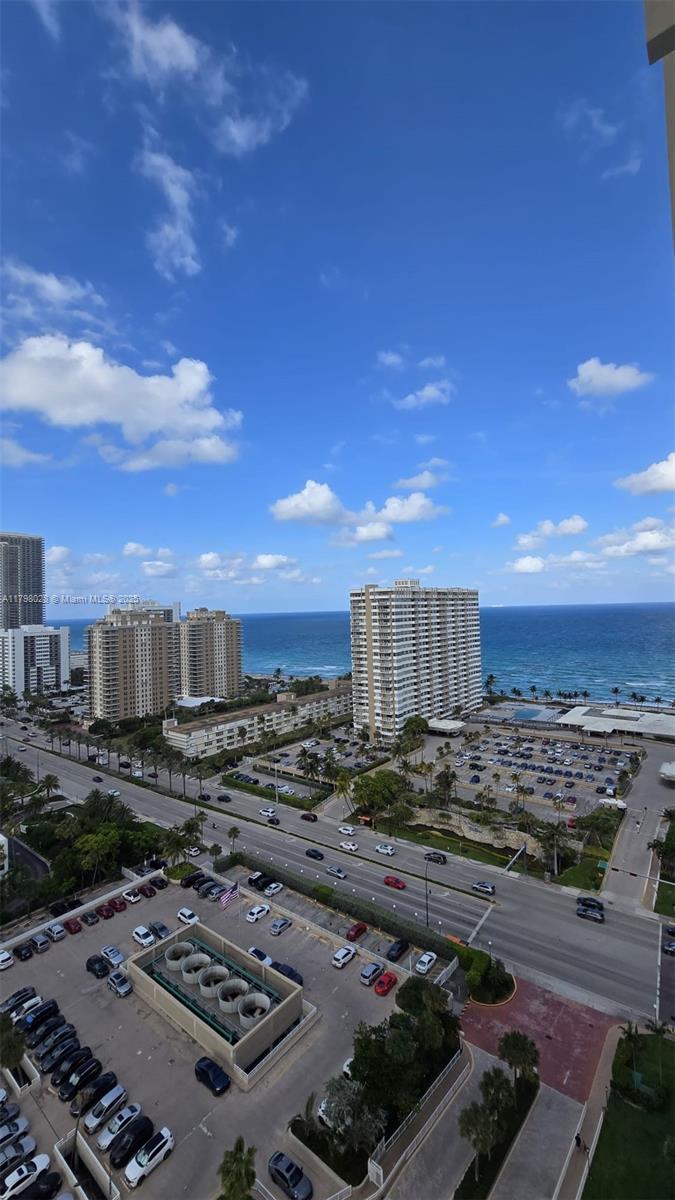
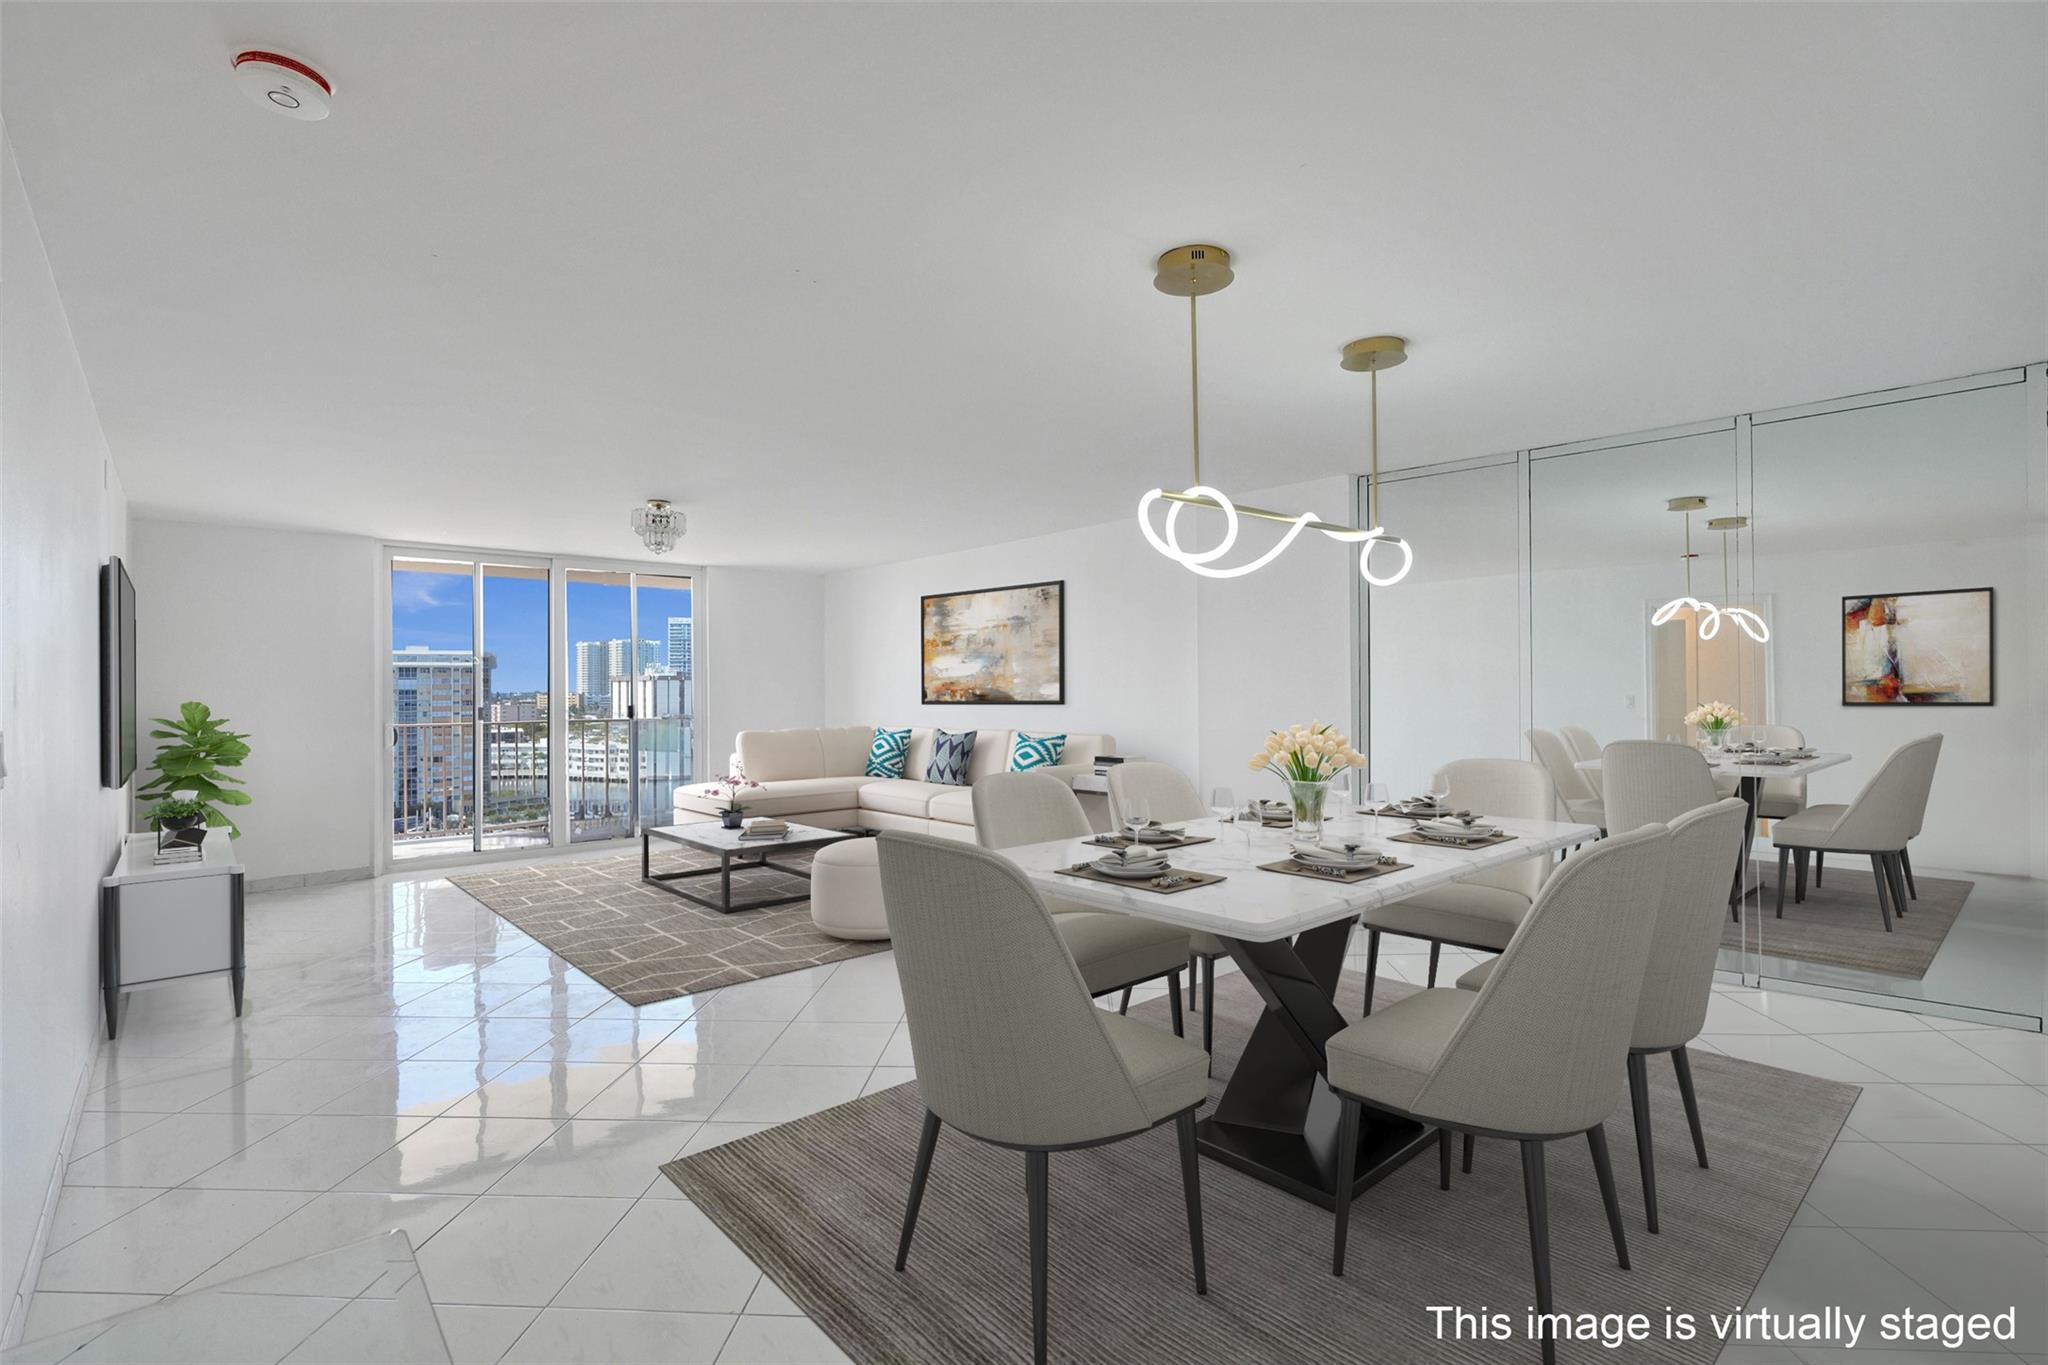
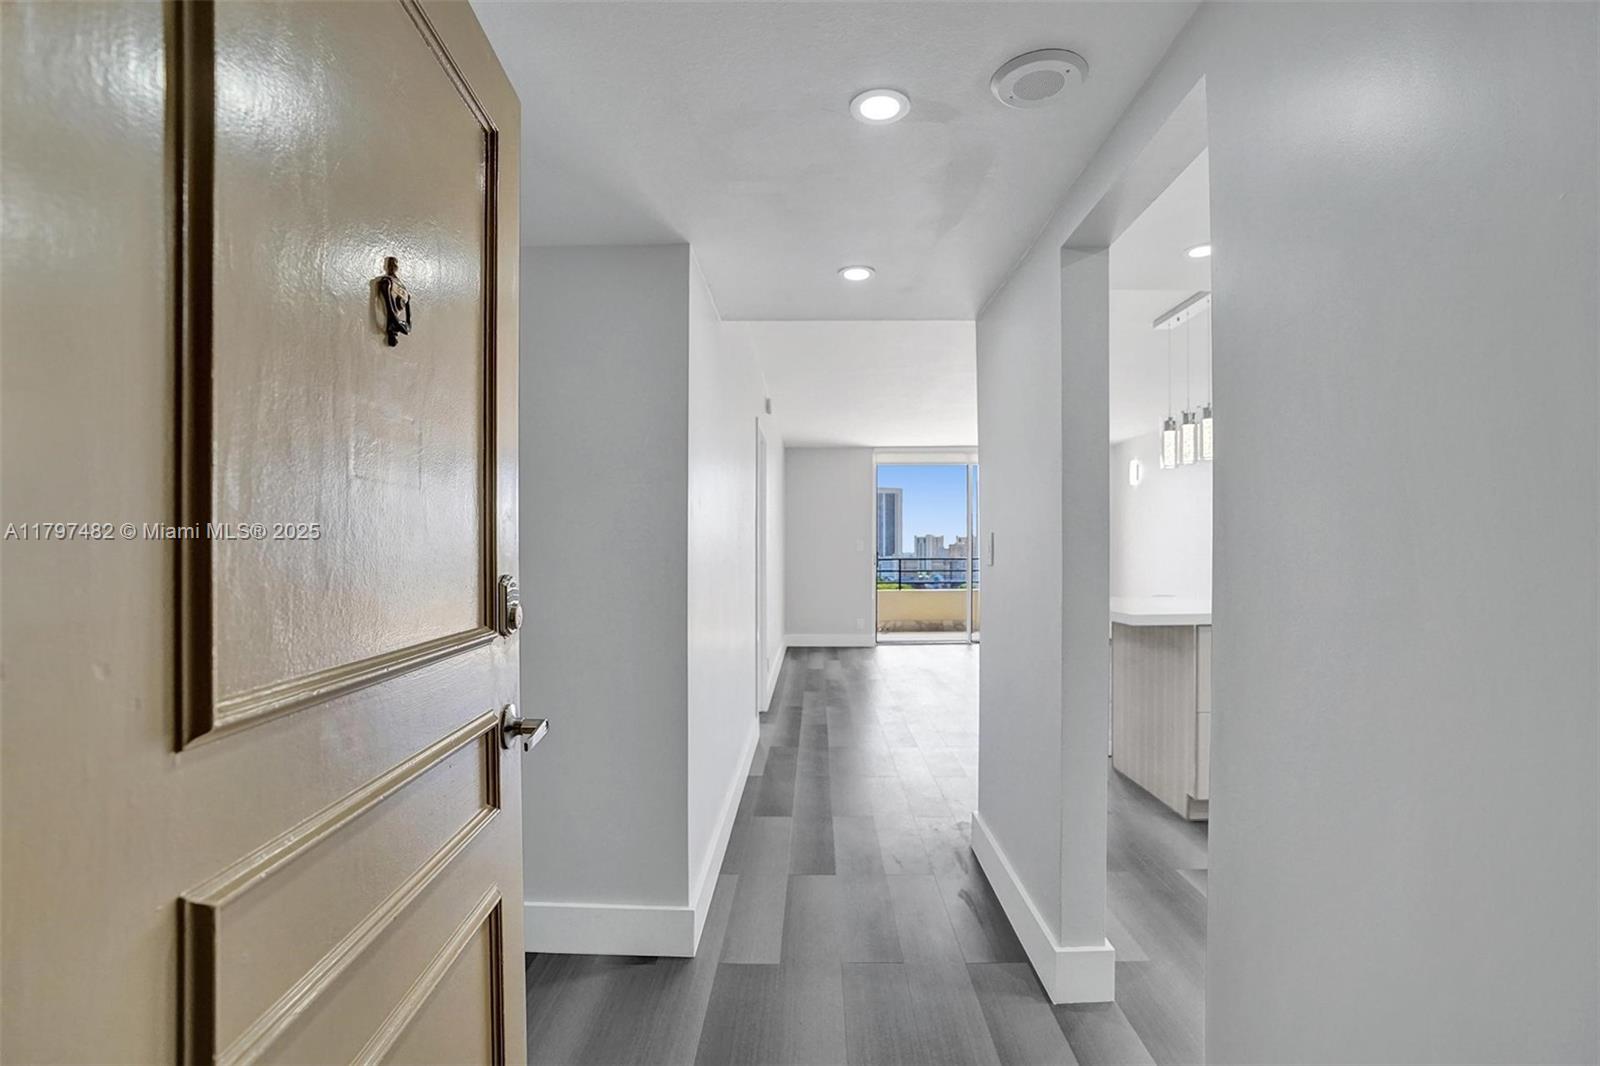
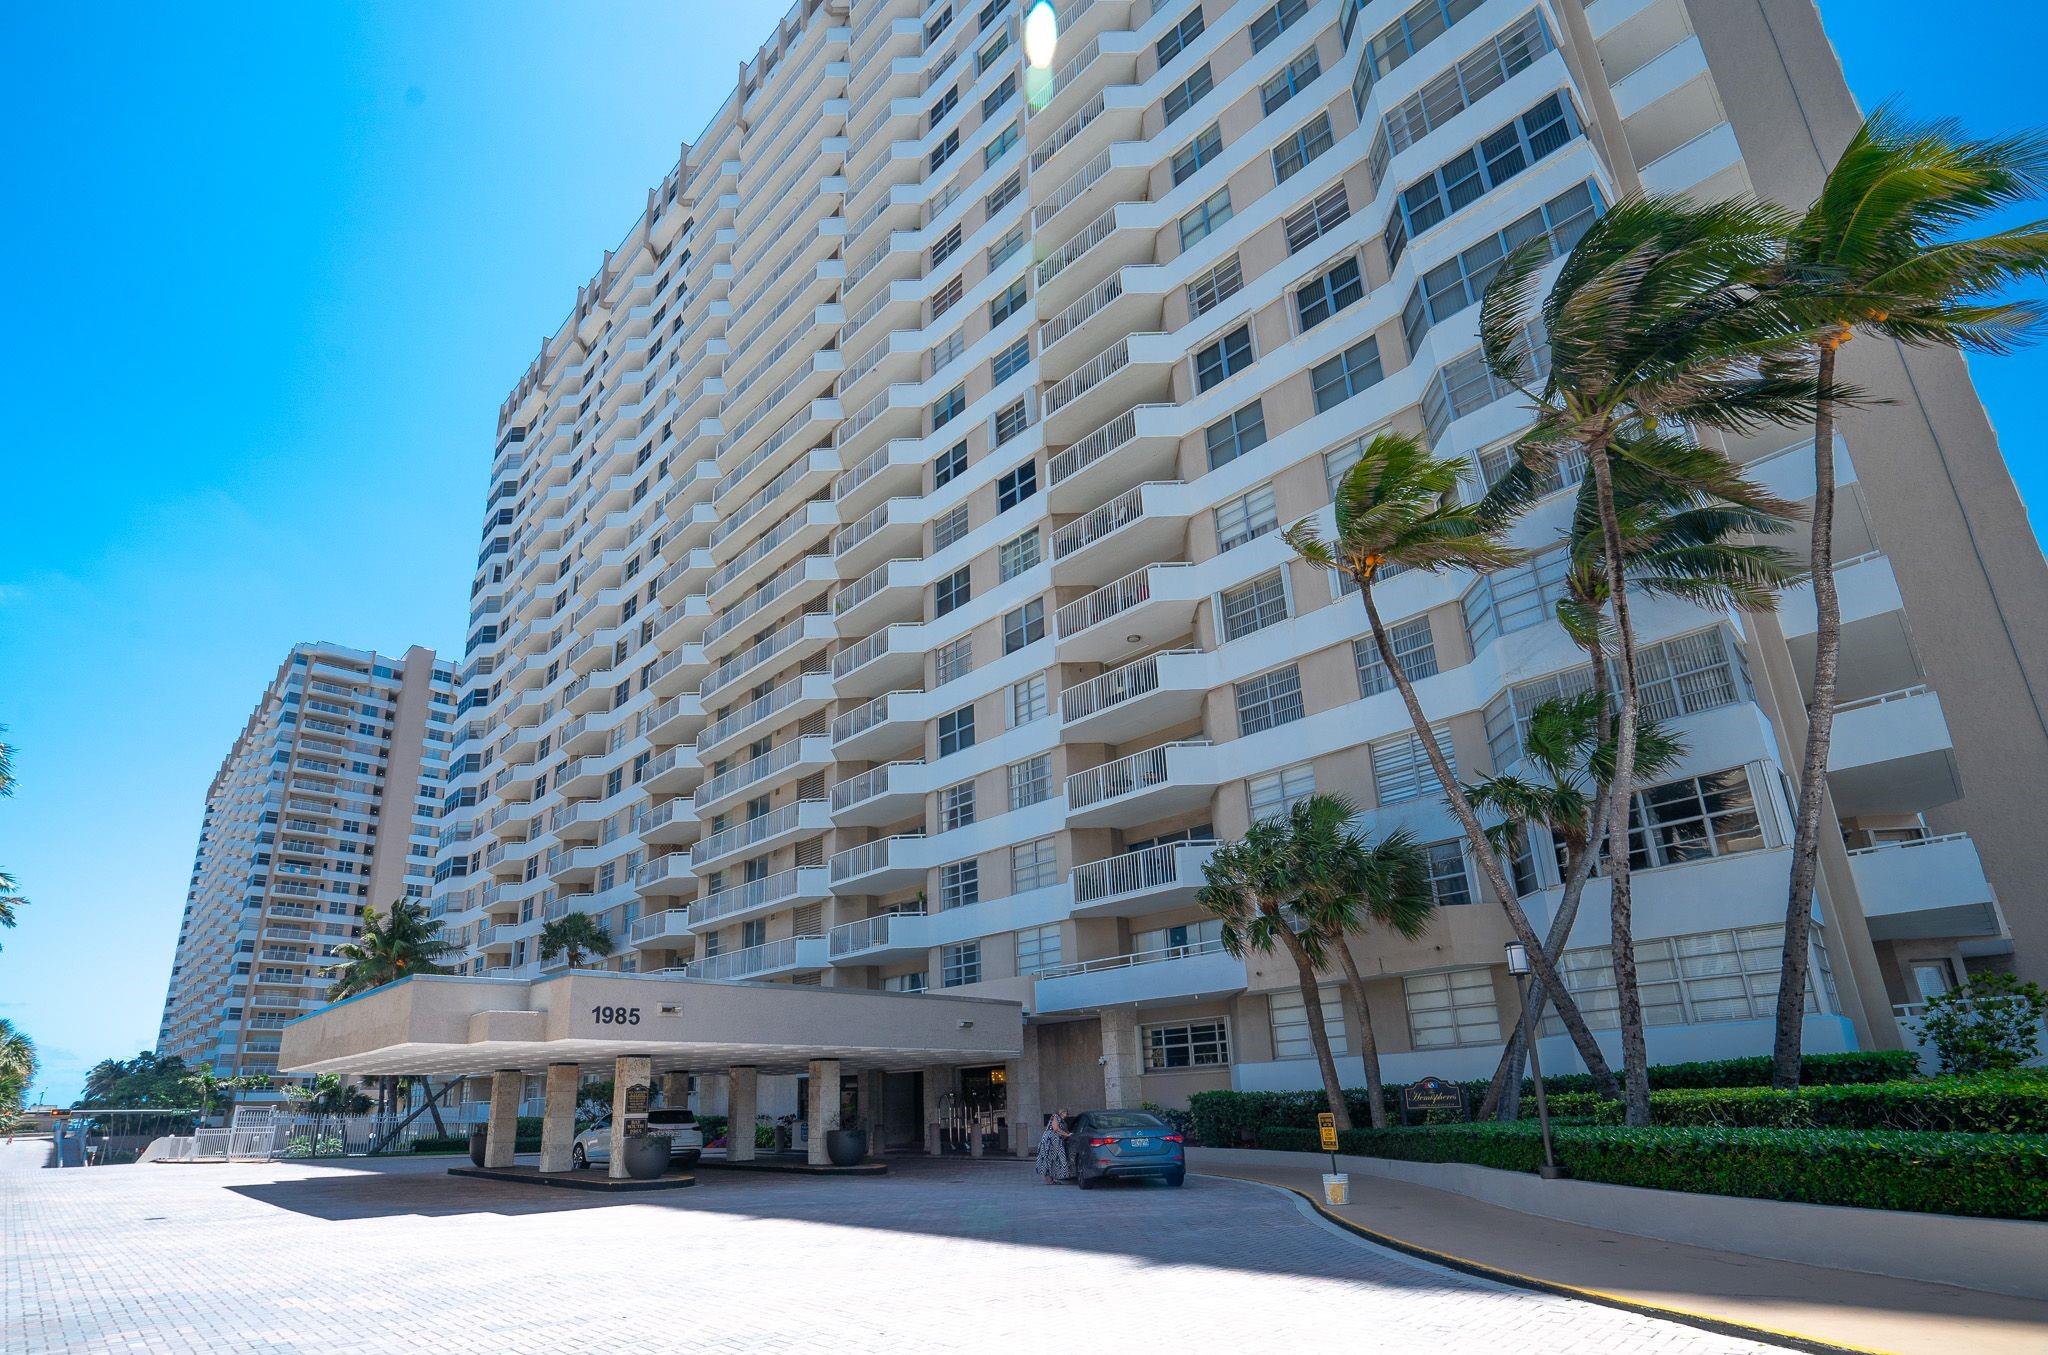
Active
$374,900
1
bds
|
2
ba
|
870
sqft
|
built
1972
1985 S Ocean Dr, Hallandale Beach, FL 33009
$-1,560
Cash flow
-21.7%
Cash-on-Cash Return
1.2%
Cap rate
0.7%
Rent to Value Ratio

Active
$229,900
1
bds
|
1
ba
|
730
sqft
|
built
1986
450 Golden Isles Dr, Hallandale Beach, FL 33009
$-794
Cash flow
-18.0%
Cash-on-Cash Return
2.0%
Cap rate
0.9%
Rent to Value Ratio

Active
$345,000
1
bds
|
2
ba
|
870
sqft
|
built
1971
1980 S Ocean Dr, Hallandale Beach, FL 33009
$-1,442
Cash flow
-21.8%
Cash-on-Cash Return
1.1%
Cap rate
0.7%
Rent to Value Ratio
Active
$359,000
1
bds
|
2
ba
|
870
sqft
|
built
1972
1985 S Ocean Dr, Hallandale Beach, FL 33009
$-1,402
Cash flow
-20.4%
Cash-on-Cash Return
1.5%
Cap rate
0.7%
Rent to Value Ratio
Active
$349,999
2
bds
|
2
ba
|
1,190
sqft
|
built
1980
462 Golden Isles Dr, Hallandale Beach, FL 33009
$-1,141
Cash flow
-17.0%
Cash-on-Cash Return
2.2%
Cap rate
0.8%
Rent to Value Ratio
Active
$229,000
2
bds
|
2
ba
|
1,092
sqft
|
built
1969
619 NE 14th Ave, Hallandale Beach, FL 33009
$-187
Cash flow
-4.3%
Cash-on-Cash Return
5.2%
Cap rate
1.0%
Rent to Value Ratio

Active
$399,000
2
bds
|
2
ba
|
1,500
sqft
|
built
1974
500 Three Islands Blvd, Hallandale Beach, FL 33009
$-362
Cash flow
-4.7%
Cash-on-Cash Return
5.1%
Cap rate
0.9%
Rent to Value Ratio
Active
$269,000
1
bds
|
1
ba
|
870
sqft
|
built
1971
1980 S Ocean Dr, Hallandale Beach, FL 33009
$-1,028
Cash flow
-19.9%
Cash-on-Cash Return
1.6%
Cap rate
0.9%
Rent to Value Ratio
Active
$329,000
2
bds
|
2
ba
|
1,092
sqft
|
built
1970
301 NE 14th Ave, Hallandale Beach, FL 33009
$-967
Cash flow
-15.3%
Cash-on-Cash Return
2.6%
Cap rate
0.8%
Rent to Value Ratio
Active
$284,900
2
bds
|
2
ba
|
965
sqft
|
built
1980
250 Layne Blvd, Hallandale Beach, FL 33009
$-954
Cash flow
-17.5%
Cash-on-Cash Return
2.1%
Cap rate
0.8%
Rent to Value Ratio
Active
$337,800
2
bds
|
2
ba
|
1,420
sqft
|
built
1973
100 Golden Isles Dr, Hallandale Beach, FL 33009
$-996
Cash flow
-15.4%
Cash-on-Cash Return
2.6%
Cap rate
0.9%
Rent to Value Ratio
Active
$499,000
2
bds
|
2
ba
|
1,248
sqft
|
built
1970
2030 S Ocean Dr, Hallandale Beach, FL 33009
$-2,459
Cash flow
-25.7%
Cash-on-Cash Return
0.2%
Cap rate
0.6%
Rent to Value Ratio
Active
$260,000
2
bds
|
2
ba
|
1,020
sqft
|
built
1974
701 Three Islands Blvd, Hallandale Beach, FL 33009
$-704
Cash flow
-14.1%
Cash-on-Cash Return
2.9%
Cap rate
1.0%
Rent to Value Ratio

Active
$375,000
2
bds
|
2
ba
|
1,311
sqft
|
built
1971
137 Golden Isles Dr, Hallandale Beach, FL 33009
$-1,619
Cash flow
-22.5%
Cash-on-Cash Return
1.0%
Cap rate
0.7%
Rent to Value Ratio
Pending
$150,000
1
bds
|
1
ba
|
720
sqft
|
built
1965
700 Layne Blvd, Hallandale Beach, FL 33009
$-382
Cash flow
-13.3%
Cash-on-Cash Return
3.1%
Cap rate
1.2%
Rent to Value Ratio
Active
$179,900
1
bds
|
2
ba
|
1,071
sqft
|
built
1967
1250 Atlantic Shores Blvd, Hallandale Beach, FL 33009
$179
Cash flow
5.2%
Cash-on-Cash Return
7.3%
Cap rate
1.1%
Rent to Value Ratio

Active
$199,900
1
bds
|
1
ba
|
800
sqft
|
built
1974
2101 Atlantic Shores Blvd, Hallandale Beach, FL 33009
$-203
Cash flow
-5.3%
Cash-on-Cash Return
4.9%
Cap rate
0.9%
Rent to Value Ratio

Active
$338,000
2
bds
|
2
ba
|
1,210
sqft
|
built
1974
851 Three Islands Blvd, Hallandale Beach, FL 33009
$-1,073
Cash flow
-16.6%
Cash-on-Cash Return
2.3%
Cap rate
0.8%
Rent to Value Ratio
Active
$225,000
1
bds
|
2
ba
|
1,140
sqft
|
built
1974
500 Three Islands Blvd, Hallandale Beach, FL 33009
$-861
Cash flow
-20.0%
Cash-on-Cash Return
1.6%
Cap rate
1.0%
Rent to Value Ratio
Active
$599,000
2
bds
|
2
ba
|
1,248
sqft
|
built
1970
2030 S Ocean Dr, Hallandale Beach, FL 33009
$-1,964
Cash flow
-17.1%
Cash-on-Cash Return
2.2%
Cap rate
0.8%
Rent to Value Ratio
Active
$335,000
2
bds
|
2
ba
|
1,420
sqft
|
built
1973
100 Golden Isles Dr, Hallandale Beach, FL 33009
$-842
Cash flow
-13.1%
Cash-on-Cash Return
3.1%
Cap rate
0.9%
Rent to Value Ratio
Active
$318,000
1
bds
|
2
ba
|
870
sqft
|
built
1971
1950 S Ocean Dr, Hallandale Beach, FL 33009
$-1,477
Cash flow
-24.2%
Cash-on-Cash Return
0.6%
Cap rate
0.7%
Rent to Value Ratio
Active
$385,000
2
bds
|
2
ba
|
1,130
sqft
|
built
1976
1000 Parkview Dr, Hallandale Beach, FL 33009
$-1,476
Cash flow
-20.0%
Cash-on-Cash Return
1.5%
Cap rate
0.8%
Rent to Value Ratio
Active
$310,000
2
bds
|
2
ba
|
1,265
sqft
|
built
1971
137 Golden Isles Dr, Hallandale Beach, FL 33009
$-1,082
Cash flow
-18.2%
Cash-on-Cash Return
2.0%
Cap rate
0.9%
Rent to Value Ratio
Active
$230,000
1
bds
|
2
ba
|
780
sqft
|
built
1969
1817 S Ocean Dr, Hallandale Beach, FL 33009
$-700
Cash flow
-15.9%
Cash-on-Cash Return
2.5%
Cap rate
1.0%
Rent to Value Ratio
Active
$2,399,000
3
bds
|
3
ba
|
2,065
sqft
|
built
2006
1830 S Ocean Dr, Hallandale Beach, FL 33009
$-11,283
Cash flow
-24.5%
Cash-on-Cash Return
0.5%
Cap rate
0.3%
Rent to Value Ratio

Active
$315,000
1
bds
|
2
ba
|
870
sqft
|
built
1972
1985 S Ocean Dr, Hallandale Beach, FL 33009
$-485
Cash flow
-8.0%
Cash-on-Cash Return
4.3%
Cap rate
0.9%
Rent to Value Ratio
Active
$280,700
2
bds
|
2
ba
|
1,280
sqft
|
built
1980
2500 Parkview Dr, Hallandale Beach, FL 33009
$-1,260
Cash flow
-23.4%
Cash-on-Cash Return
0.8%
Cap rate
1.0%
Rent to Value Ratio
Active
$299,000
2
bds
|
2
ba
|
1,285
sqft
|
built
1970
437 Golden Isles Dr, Hallandale Beach, FL 33009
$-570
Cash flow
-9.9%
Cash-on-Cash Return
3.9%
Cap rate
0.9%
Rent to Value Ratio
Active
$266,000
2
bds
|
2
ba
|
1,150
sqft
|
built
1972
427 Golden Isles Dr, Hallandale Beach, FL 33009
$-930
Cash flow
-18.2%
Cash-on-Cash Return
2.0%
Cap rate
1.0%
Rent to Value Ratio
Active
$355,000
2
bds
|
2
ba
|
1,285
sqft
|
built
1970
437 Golden Isles Dr, Hallandale Beach, FL 33009
$-1,146
Cash flow
-16.8%
Cash-on-Cash Return
2.3%
Cap rate
0.7%
Rent to Value Ratio
Active
$189,900
1
bds
|
1
ba
|
613
sqft
|
built
1965
161 NE 10th Ave, Hallandale Beach, FL 33009
$-337
Cash flow
-9.3%
Cash-on-Cash Return
4.0%
Cap rate
0.8%
Rent to Value Ratio
Active
$275,000
2
bds
|
2
ba
|
1,150
sqft
|
built
1972
427 Golden Isles Dr, Hallandale Beach, FL 33009
$-1,023
Cash flow
-19.4%
Cash-on-Cash Return
1.7%
Cap rate
0.9%
Rent to Value Ratio

Active
$1,525,000
2
bds
|
2
ba
|
1,782
sqft
|
built
2005
1850 S Ocean Dr, Hallandale Beach, FL 33009
$-6,181
Cash flow
-21.1%
Cash-on-Cash Return
1.3%
Cap rate
0.5%
Rent to Value Ratio

Active
$540,000
2
bds
|
2
ba
|
1,248
sqft
|
built
1970
2030 S Ocean Dr, Hallandale Beach, FL 33009
$-734
Cash flow
-7.1%
Cash-on-Cash Return
4.5%
Cap rate
0.7%
Rent to Value Ratio