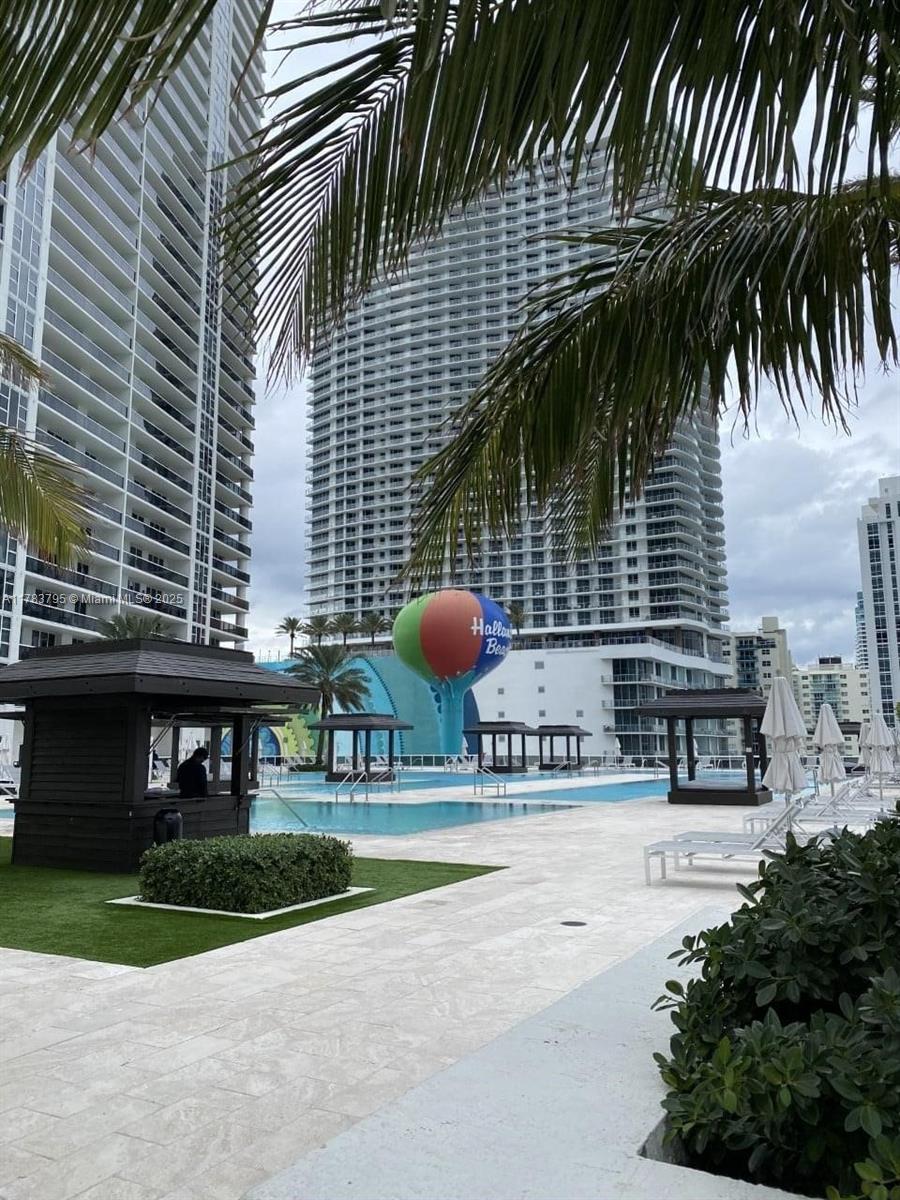
Hallandale Beach, FL Investment Properties for Sale
Browse homes for sale and investment properties in Hallandale Beach, FL. Refine your search by price, property type, or more.
Best cash flowing properties in Hallandale Beach, FL
Active
$159,000
1
bds
|
1
ba
|
320
sqft
|
built
1960
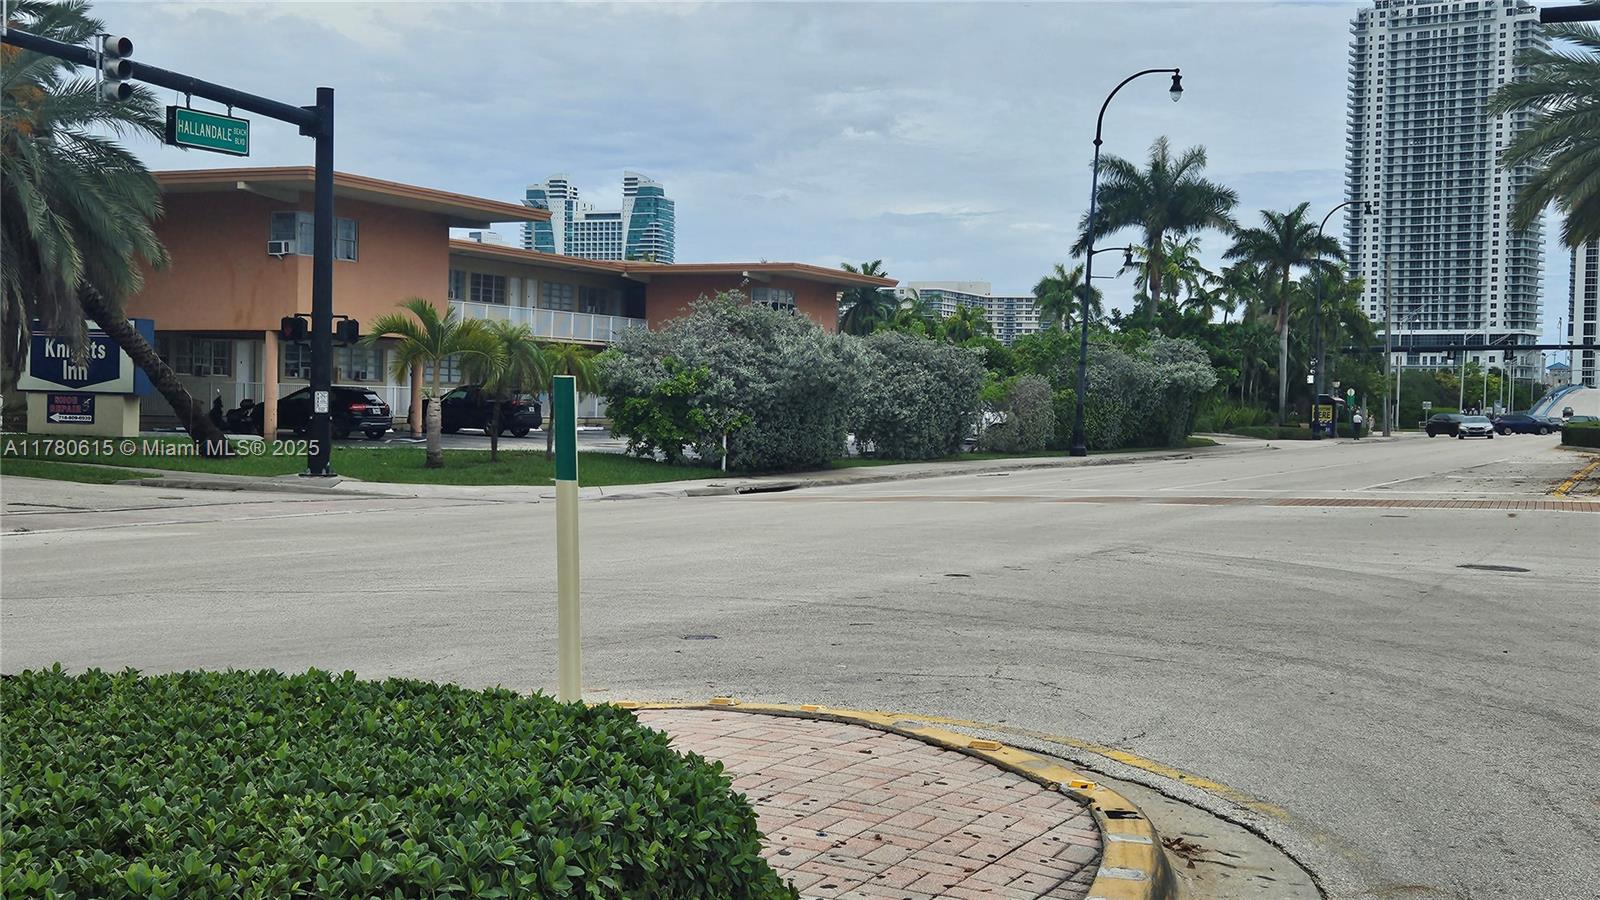
26 Diplomat Pkwy, Hallandale Beach, FL 33009
$-189
Cash flow
-6.2%
Cash-on-Cash Return
4.9%
Cap rate
1.1%
Rent to Value Ratio
Active
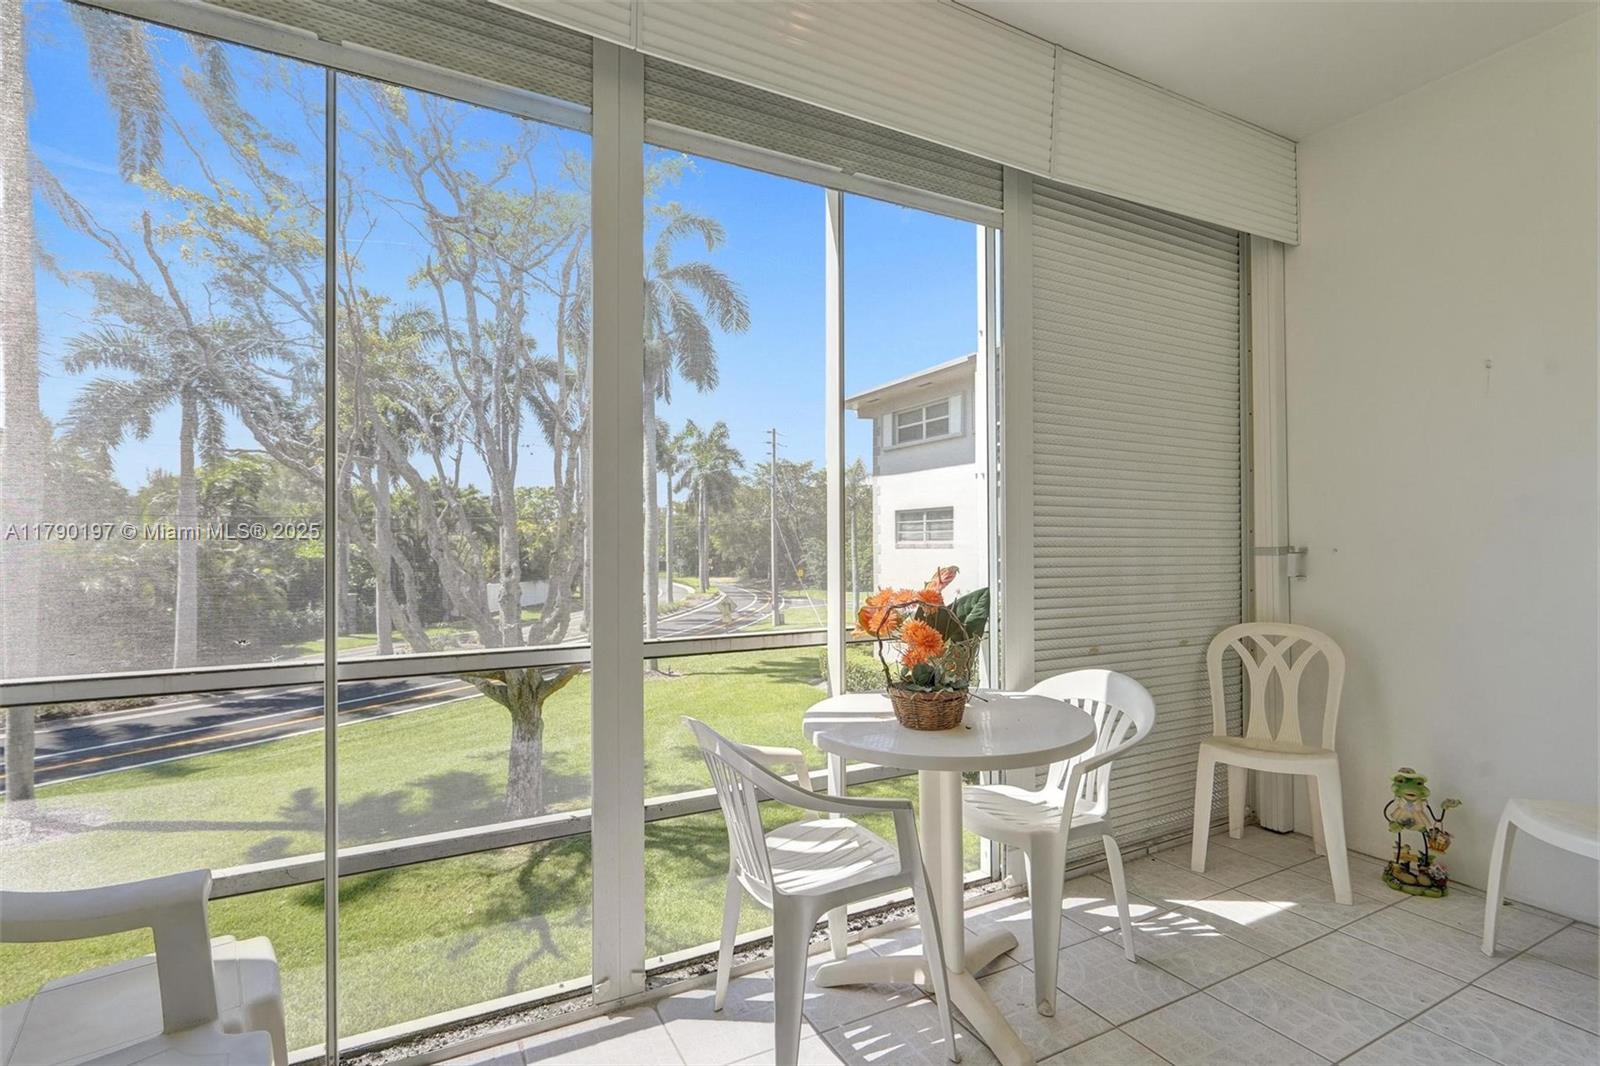
$150,000
1
bds
|
1
ba
|
720
sqft
|
built
1965
700 Layne Blvd, Hallandale Beach, FL 33009
$-412
Cash flow
-14.3%
Cash-on-Cash Return
3.0%
Cap rate
1.3%
Rent to Value Ratio
833 out of 931 properties for sale in Hallandale Beach, FL
Limited Results Shown
Create a free account, or log in to reveal all property listings and enjoy the complete experience.
Active
$2,235,000
bds
|
0
ba
|
3,690
sqft
|
built
1958
700 NE 6th St, Hallandale Beach, FL 33009
$-13,479
Cash flow
-31.5%
Cash-on-Cash Return
-1.0%
Cap rate
0.1%
Rent to Value Ratio
Active
$337,000
2
bds
|
2
ba
|
1,080
sqft
|
built
1966
126 Golden Isles Dr, Hallandale Beach, FL 33009
$-1,274
Cash flow
-19.7%
Cash-on-Cash Return
1.7%
Cap rate
0.8%
Rent to Value Ratio
Active
$299,999
2
bds
|
2
ba
|
1,288
sqft
|
built
1971
137 Golden Isles Dr, Hallandale Beach, FL 33009
$-1,031
Cash flow
-17.9%
Cash-on-Cash Return
2.2%
Cap rate
0.9%
Rent to Value Ratio
Active
$899,000
2
bds
|
2
ba
|
1,466
sqft
|
built
1972
3180 S Ocean Dr, Hallandale Beach, FL 33009
$-4,579
Cash flow
-26.6%
Cash-on-Cash Return
0.2%
Cap rate
0.5%
Rent to Value Ratio
Active
$974,995
5
bds
|
2
ba
|
2,147
sqft
|
built
1963
1024 NE 4th St, Hallandale Beach, FL 33009
$-1,148
Cash flow
-6.1%
Cash-on-Cash Return
4.9%
Cap rate
0.7%
Rent to Value Ratio
Active
$825,000
3
bds
|
3
ba
|
1,740
sqft
|
built
1971
1980 S Ocean Dr, Hallandale Beach, FL 33009
$-3,941
Cash flow
-24.9%
Cash-on-Cash Return
0.6%
Cap rate
0.5%
Rent to Value Ratio
Active
$449,000
3
bds
|
3
ba
|
1,696
sqft
|
built
1978
2204 NE 7th St, Hallandale Beach, FL 33009
$-1,697
Cash flow
-19.7%
Cash-on-Cash Return
1.7%
Cap rate
0.7%
Rent to Value Ratio
Active
$429,500
2
bds
|
2
ba
|
1,311
sqft
|
built
1971
137 Golden Isles Dr, Hallandale Beach, FL 33009
$-1,564
Cash flow
-19.0%
Cash-on-Cash Return
1.9%
Cap rate
0.7%
Rent to Value Ratio
Active
$355,000
2
bds
|
2
ba
|
1,300
sqft
|
built
1970
401 Golden Isles Dr, Hallandale Beach, FL 33009
$-1,753
Cash flow
-25.8%
Cash-on-Cash Return
0.4%
Cap rate
0.7%
Rent to Value Ratio
Active
$469,000
3
bds
|
2
ba
|
1,463
sqft
|
built
1956
720 NW 6th St, Hallandale Beach, FL 33009
$-1,267
Cash flow
-14.1%
Cash-on-Cash Return
3.0%
Cap rate
0.5%
Rent to Value Ratio
Active
$230,000
1
bds
|
1
ba
|
820
sqft
|
built
1974
851 Three Islands Blvd, Hallandale Beach, FL 33009
$-824
Cash flow
-18.7%
Cash-on-Cash Return
2.0%
Cap rate
0.8%
Rent to Value Ratio
Active
$1,099,000
3
bds
|
3
ba
|
1,920
sqft
|
built
1974
1880 S Ocean Dr, Hallandale Beach, FL 33009
$-5,214
Cash flow
-24.8%
Cash-on-Cash Return
0.6%
Cap rate
0.4%
Rent to Value Ratio
Active
$210,000
1
bds
|
1
ba
|
545
sqft
|
built
1970
1965 S Ocean Dr, Hallandale Beach, FL 33009
$-461
Cash flow
-11.5%
Cash-on-Cash Return
3.7%
Cap rate
1.0%
Rent to Value Ratio

Active
$204,900
1
bds
|
2
ba
|
719
sqft
|
built
1970
1801 S Ocean Dr, Hallandale Beach, FL 33009
$-774
Cash flow
-19.7%
Cash-on-Cash Return
1.8%
Cap rate
1.0%
Rent to Value Ratio
Active
$820,000
3
bds
|
3
ba
|
1,549
sqft
|
built
1987
806 NE 4th St, Hallandale Beach, FL 33009
$-2,253
Cash flow
-14.3%
Cash-on-Cash Return
3.0%
Cap rate
0.5%
Rent to Value Ratio
Active
$799,000
2
bds
|
2
ba
|
1,680
sqft
|
built
1980
2667 S Parkview Dr, Hallandale Beach, FL 33009
$-1,250
Cash flow
-8.2%
Cash-on-Cash Return
4.4%
Cap rate
0.9%
Rent to Value Ratio
Active
$275,000
2
bds
|
2
ba
|
1,150
sqft
|
built
1972
427 Golden Isles Dr, Hallandale Beach, FL 33009
$-859
Cash flow
-16.3%
Cash-on-Cash Return
2.5%
Cap rate
0.9%
Rent to Value Ratio
Active
$150,000
1
bds
|
1
ba
|
720
sqft
|
built
1965
700 Layne Blvd, Hallandale Beach, FL 33009
$-412
Cash flow
-14.3%
Cash-on-Cash Return
3.0%
Cap rate
1.3%
Rent to Value Ratio
Active
$325,000
1
bds
|
2
ba
|
828
sqft
|
built
1974
500 Three Islands Blvd, Hallandale Beach, FL 33009
$-1,202
Cash flow
-19.3%
Cash-on-Cash Return
1.8%
Cap rate
0.8%
Rent to Value Ratio
Active
$299,000
2
bds
|
2
ba
|
1,150
sqft
|
built
1972
427 Golden Isles Dr, Hallandale Beach, FL 33009
$-661
Cash flow
-11.5%
Cash-on-Cash Return
3.6%
Cap rate
1.0%
Rent to Value Ratio
Active
$250,000
1
bds
|
2
ba
|
1,075
sqft
|
built
1979
600 Parkview Dr, Hallandale Beach, FL 33009
$-998
Cash flow
-20.8%
Cash-on-Cash Return
1.5%
Cap rate
0.9%
Rent to Value Ratio
Active
$829,995
3
bds
|
2
ba
|
1,892
sqft
|
built
1956
1124 NE 6th St, Hallandale Beach, FL 33009
$-1,260
Cash flow
-7.9%
Cash-on-Cash Return
4.5%
Cap rate
0.7%
Rent to Value Ratio
Active
$850,000
3
bds
|
3
ba
|
1,780
sqft
|
built
1971
1950 S Ocean Dr, Hallandale Beach, FL 33009
$-1,253
Cash flow
-7.7%
Cash-on-Cash Return
4.5%
Cap rate
0.7%
Rent to Value Ratio
Active
$170,000
1
bds
|
1
ba
|
620
sqft
|
built
1973
410 SE 4th Ave, Hallandale Beach, FL 33009
$-442
Cash flow
-13.6%
Cash-on-Cash Return
3.2%
Cap rate
0.9%
Rent to Value Ratio
Active
$775,000
1
bds
|
1
ba
|
844
sqft
|
built
2006
1830 S Ocean Dr, Hallandale Beach, FL 33009
$-2,420
Cash flow
-16.3%
Cash-on-Cash Return
2.5%
Cap rate
0.7%
Rent to Value Ratio
Active
$299,000
1
bds
|
2
ba
|
950
sqft
|
built
1980
2500 Parkview Dr, Hallandale Beach, FL 33009
$-1,354
Cash flow
-23.6%
Cash-on-Cash Return
0.9%
Cap rate
0.8%
Rent to Value Ratio
Active
$320,000
2
bds
|
2
ba
|
1,092
sqft
|
built
1971
3161 S Ocean Dr, Hallandale Beach, FL 33009
$-669
Cash flow
-10.9%
Cash-on-Cash Return
3.8%
Cap rate
0.9%
Rent to Value Ratio
Active
$279,000
2
bds
|
2
ba
|
945
sqft
|
built
1980
1913 S Ocean Dr, Hallandale Beach, FL 33009
$-946
Cash flow
-17.7%
Cash-on-Cash Return
2.2%
Cap rate
0.9%
Rent to Value Ratio
Active
$295,000
1
bds
|
2
ba
|
950
sqft
|
built
1980
2500 Parkview Dr, Hallandale Beach, FL 33009
$-1,408
Cash flow
-24.9%
Cash-on-Cash Return
0.6%
Cap rate
0.7%
Rent to Value Ratio
Active
$715,000
2
bds
|
1
ba
|
1,086
sqft
|
built
2005
1850 S Ocean Dr, Hallandale Beach, FL 33009
$-2,983
Cash flow
-21.8%
Cash-on-Cash Return
1.3%
Cap rate
0.6%
Rent to Value Ratio
Active
$464,000
2
bds
|
2
ba
|
1,125
sqft
|
built
1970
121 Golden Isles Dr, Hallandale Beach, FL 33009
$-1,301
Cash flow
-14.6%
Cash-on-Cash Return
2.9%
Cap rate
0.8%
Rent to Value Ratio
Active
$235,000
2
bds
|
2
ba
|
1,075
sqft
|
built
1979
600 Parkview Dr, Hallandale Beach, FL 33009
$-723
Cash flow
-16.1%
Cash-on-Cash Return
2.6%
Cap rate
1.1%
Rent to Value Ratio
Active
$621,000
2
bds
|
2
ba
|
1,100
sqft
|
built
1979
3140 S Ocean Dr, Hallandale Beach, FL 33009
$-2,416
Cash flow
-20.3%
Cash-on-Cash Return
1.6%
Cap rate
0.6%
Rent to Value Ratio

Active
$329,000
2
bds
|
2
ba
|
1,400
sqft
|
built
1975
600 Three Islands Blvd, Hallandale Beach, FL 33009
$-1,555
Cash flow
-24.7%
Cash-on-Cash Return
0.6%
Cap rate
0.9%
Rent to Value Ratio

Active
$325,000
2
bds
|
2
ba
|
1,100
sqft
|
built
1972
1833 S Ocean Dr, Hallandale Beach, FL 33009
$-1,425
Cash flow
-22.9%
Cash-on-Cash Return
1.0%
Cap rate
0.8%
Rent to Value Ratio
Active
$410,000
2
bds
|
2
ba
|
1,052
sqft
|
built
2007
1755 E Hallandale Beach Blvd, Hallandale Beach, FL 33009
$-1,615
Cash flow
-20.6%
Cash-on-Cash Return
1.6%
Cap rate
0.8%
Rent to Value Ratio
Active
$259,625
1
bds
|
2
ba
|
915
sqft
|
built
1976
800 Parkview Dr, Hallandale Beach, FL 33009
$-1,124
Cash flow
-22.6%
Cash-on-Cash Return
1.1%
Cap rate
0.8%
Rent to Value Ratio
Active
$319,000
1
bds
|
2
ba
|
1,000
sqft
|
built
1975
600 Three Islands Blvd, Hallandale Beach, FL 33009
$-1,076
Cash flow
-17.6%
Cash-on-Cash Return
2.2%
Cap rate
0.8%
Rent to Value Ratio
Active
$159,000
1
bds
|
1
ba
|
320
sqft
|
built
1960
26 Diplomat Pkwy, Hallandale Beach, FL 33009
$-189
Cash flow
-6.2%
Cash-on-Cash Return
4.9%
Cap rate
1.1%
Rent to Value Ratio
Active
$239,900
1
bds
|
2
ba
|
780
sqft
|
built
1969
1825 S Ocean Dr, Hallandale Beach, FL 33009
$-783
Cash flow
-17.0%
Cash-on-Cash Return
2.4%
Cap rate
0.9%
Rent to Value Ratio