Hallandale Beach, FL Investment Properties for Sale
Browse homes for sale and investment properties in Hallandale Beach, FL. Refine your search by price, property type, or more.
Best cash flowing properties in Hallandale Beach, FL
Active
$355,000
2
bds
|
2
ba
|
1,075
sqft
|
built
1981
200 Leslie Dr, Hallandale Beach, FL 33009
n/a
Cash flow
n/a
Cash-on-Cash Return
n/a
Cap rate
n/a
Rent to Value Ratio
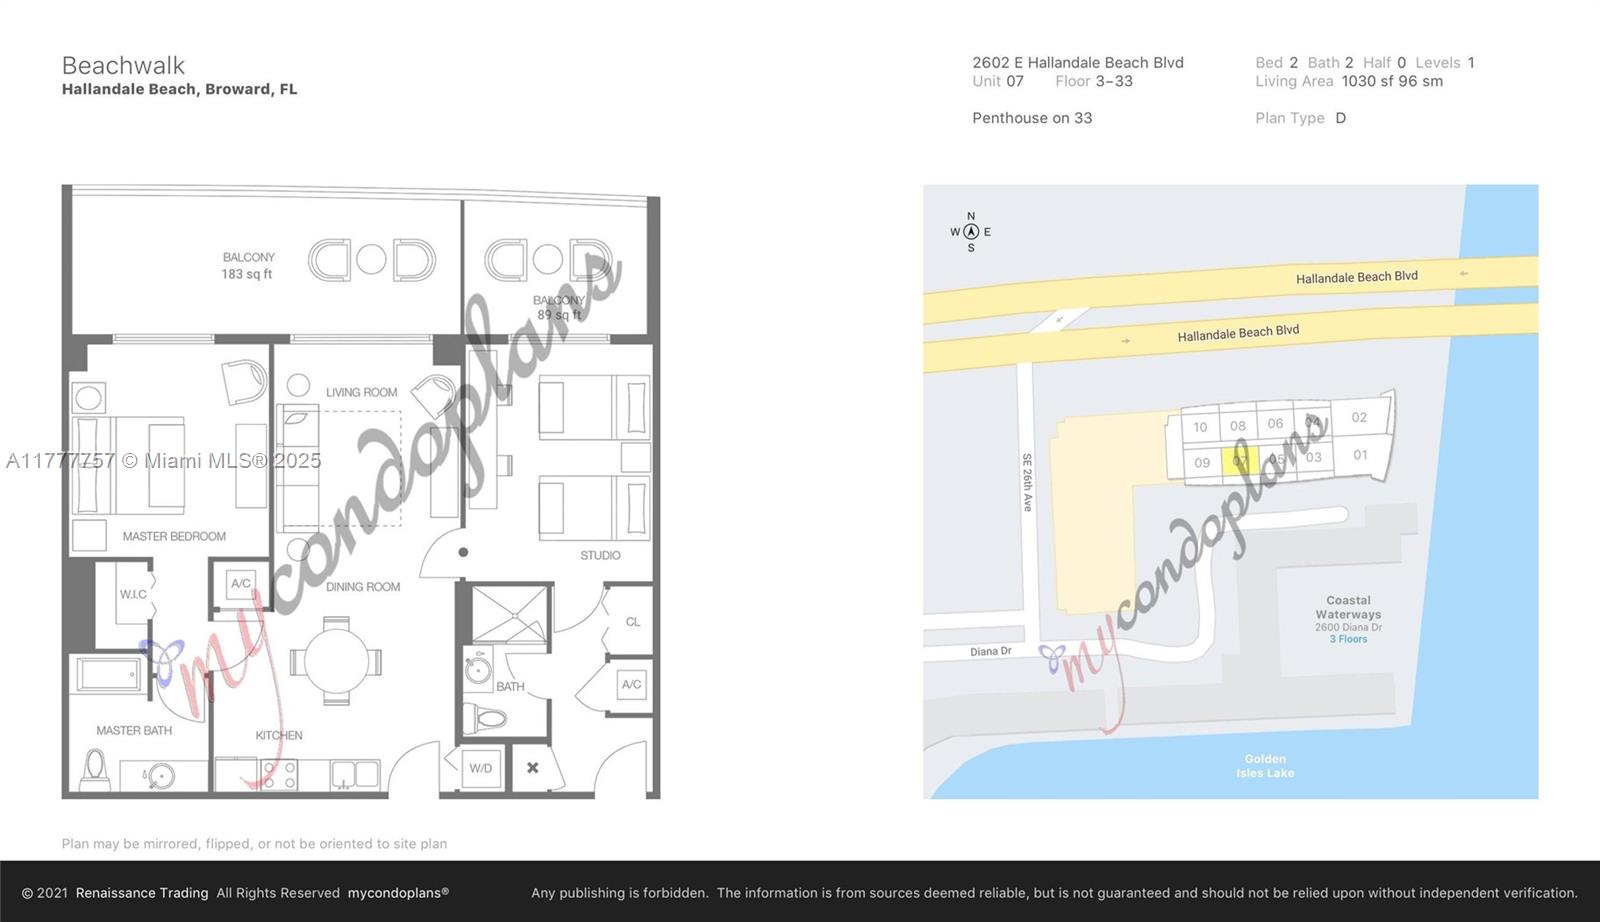
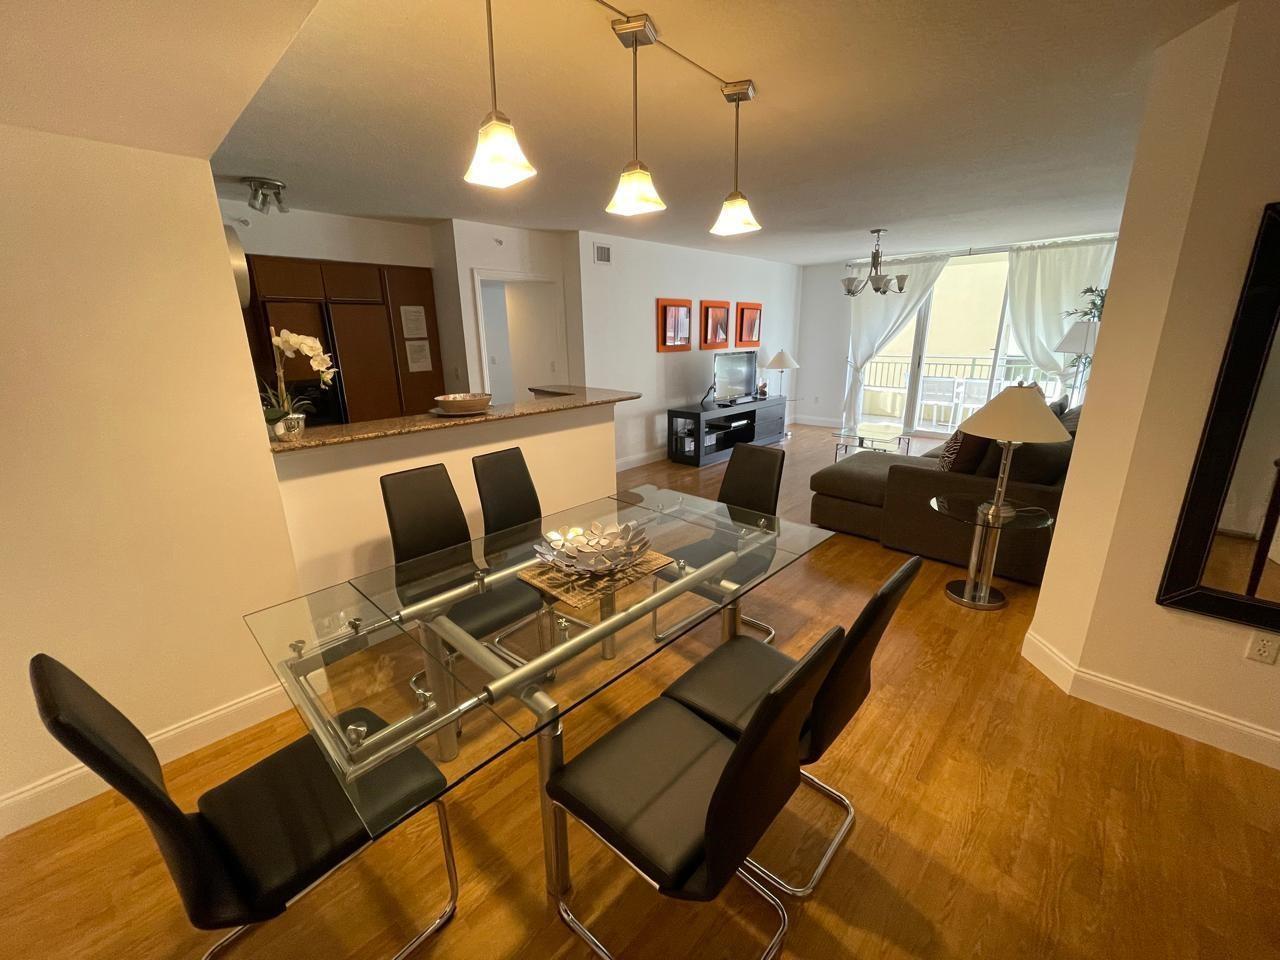
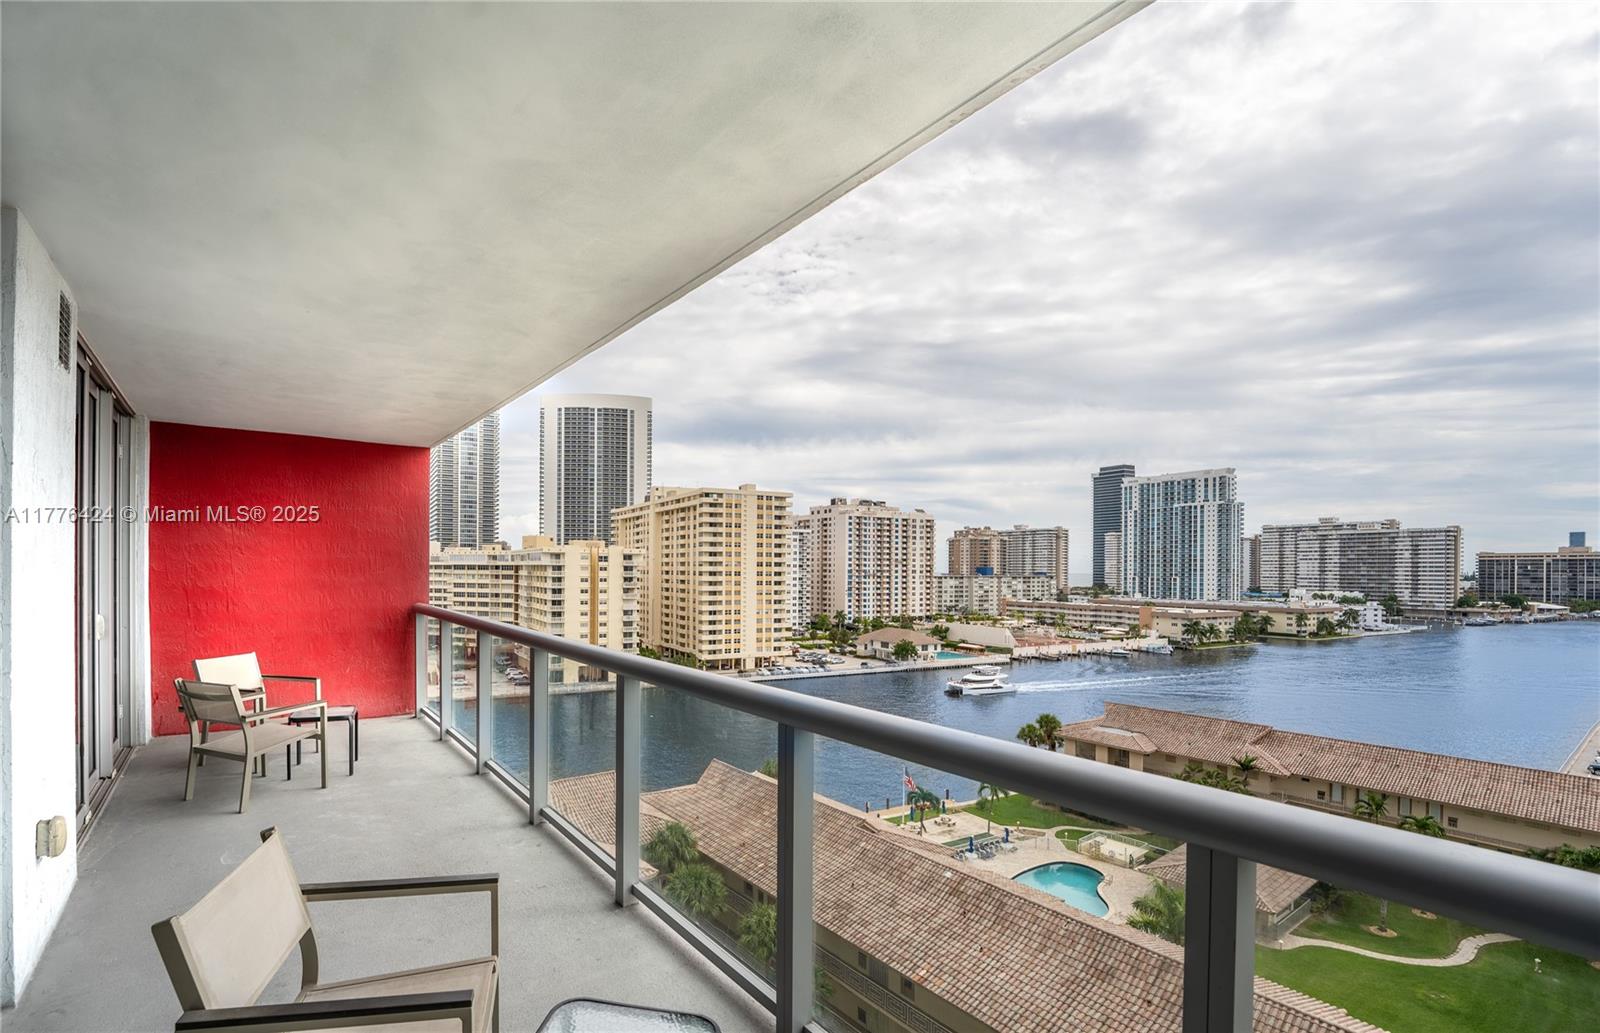
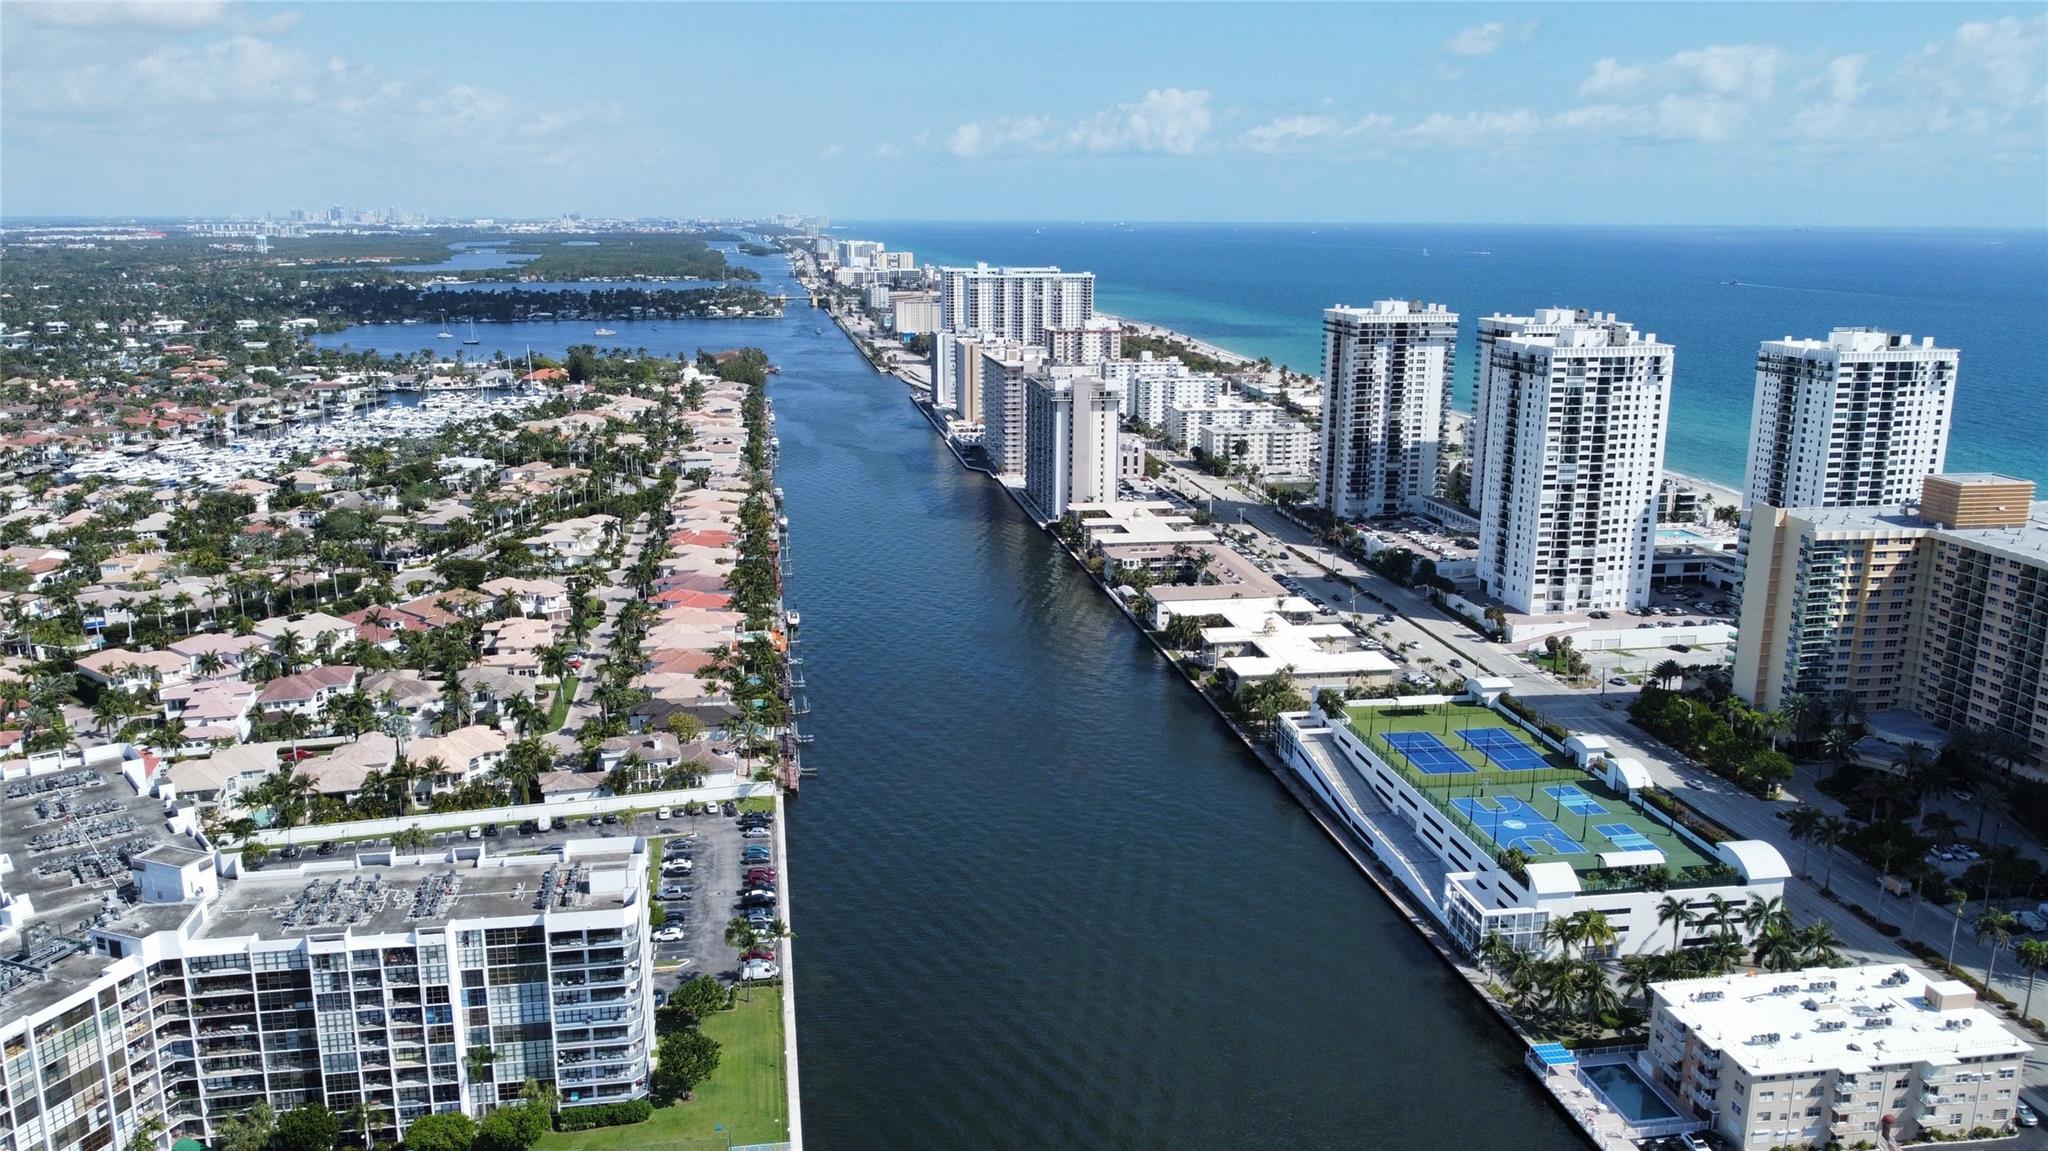
Active
$428,000
2
bds
|
2
ba
|
1,030
sqft
|
built
2015
2602 E Hallandale Beach Blvd, Hallandale Beach, FL 33009
n/a
Cash flow
n/a
Cash-on-Cash Return
n/a
Cap rate
n/a
Rent to Value Ratio
737 out of 821 properties for sale in Hallandale Beach, FL
Limited Results Shown
Create a free account, or log in to reveal all property listings and enjoy the complete experience.
Active
$259,625
1
bds
|
2
ba
|
915
sqft
|
built
1976
800 Parkview Dr, Hallandale Beach, FL 33009
$-1,094
Cash flow
-22.0%
Cash-on-Cash Return
1.1%
Cap rate
0.8%
Rent to Value Ratio
Active
$319,000
1
bds
|
2
ba
|
1,000
sqft
|
built
1975
600 Three Islands Blvd, Hallandale Beach, FL 33009
$-1,039
Cash flow
-17.0%
Cash-on-Cash Return
2.2%
Cap rate
0.8%
Rent to Value Ratio
Active
$159,000
1
bds
|
1
ba
|
320
sqft
|
built
1960
26 Diplomat Pkwy, Hallandale Beach, FL 33009
$-170
Cash flow
-5.6%
Cash-on-Cash Return
4.9%
Cap rate
1.1%
Rent to Value Ratio
Active
$239,900
1
bds
|
2
ba
|
780
sqft
|
built
1969
1825 S Ocean Dr, Hallandale Beach, FL 33009
$-756
Cash flow
-16.4%
Cash-on-Cash Return
2.4%
Cap rate
0.9%
Rent to Value Ratio
Active
$225,000
2
bds
|
2
ba
|
1,200
sqft
|
built
1974
2101 Atlantic Shores Blvd, Hallandale Beach, FL 33009
$-556
Cash flow
-12.9%
Cash-on-Cash Return
3.2%
Cap rate
1.1%
Rent to Value Ratio

Active
$595,000
2
bds
|
2
ba
|
1,180
sqft
|
built
2004
201 Golden Isles Dr, Hallandale Beach, FL 33009
$-1,491
Cash flow
-13.1%
Cash-on-Cash Return
3.1%
Cap rate
0.6%
Rent to Value Ratio
Active
$239,000
1
bds
|
2
ba
|
950
sqft
|
built
1980
2500 Parkview Dr, Hallandale Beach, FL 33009
$-832
Cash flow
-18.2%
Cash-on-Cash Return
2.0%
Cap rate
1.0%
Rent to Value Ratio
Active
$224,000
1
bds
|
1
ba
|
697
sqft
|
built
1998
500 NE 3rd St, Hallandale Beach, FL 33009
$-580
Cash flow
-13.5%
Cash-on-Cash Return
3.0%
Cap rate
0.8%
Rent to Value Ratio
Active
$389,000
2
bds
|
2
ba
|
1,710
sqft
|
built
1974
1865 S Ocean Dr, Hallandale Beach, FL 33009
$-1,432
Cash flow
-19.2%
Cash-on-Cash Return
1.7%
Cap rate
0.8%
Rent to Value Ratio
Active
$265,000
1
bds
|
2
ba
|
828
sqft
|
built
1974
500 Three Islands Blvd, Hallandale Beach, FL 33009
$-1,058
Cash flow
-20.8%
Cash-on-Cash Return
1.4%
Cap rate
0.8%
Rent to Value Ratio

Active
$349,000
1
bds
|
2
ba
|
850
sqft
|
built
1979
3140 S Ocean Dr, Hallandale Beach, FL 33009
$-1,236
Cash flow
-18.5%
Cash-on-Cash Return
1.9%
Cap rate
0.8%
Rent to Value Ratio
Active
$635,000
2
bds
|
2
ba
|
1,240
sqft
|
built
1971
1950 S Ocean Dr, Hallandale Beach, FL 33009
$-2,646
Cash flow
-21.7%
Cash-on-Cash Return
1.1%
Cap rate
0.6%
Rent to Value Ratio

Active
$344,900
2
bds
|
2
ba
|
1,000
sqft
|
built
1968
430 Golden Isles Dr, Hallandale Beach, FL 33009
$-890
Cash flow
-13.5%
Cash-on-Cash Return
3.1%
Cap rate
0.8%
Rent to Value Ratio
Active
$219,000
1
bds
|
2
ba
|
646
sqft
|
built
1970
1801 S Ocean Dr, Hallandale Beach, FL 33009
$-494
Cash flow
-11.8%
Cash-on-Cash Return
3.4%
Cap rate
1.1%
Rent to Value Ratio

Active
$160,000
1
bds
|
1
ba
|
348
sqft
|
built
1960
26 Diplomat Pkwy, Hallandale Beach, FL 33009
$-133
Cash flow
-4.3%
Cash-on-Cash Return
5.2%
Cap rate
1.1%
Rent to Value Ratio
Active
$299,900
2
bds
|
2
ba
|
1,176
sqft
|
built
1969
1817 S Ocean Dr, Hallandale Beach, FL 33009
$-1,203
Cash flow
-20.9%
Cash-on-Cash Return
1.3%
Cap rate
0.9%
Rent to Value Ratio
Active
$735,000
1
bds
|
1
ba
|
844
sqft
|
built
2006
1830 S Ocean Dr, Hallandale Beach, FL 33009
$-2,587
Cash flow
-18.4%
Cash-on-Cash Return
1.9%
Cap rate
0.6%
Rent to Value Ratio
Active
$220,000
1
bds
|
2
ba
|
719
sqft
|
built
1970
1801 S Ocean Dr, Hallandale Beach, FL 33009
$-776
Cash flow
-18.4%
Cash-on-Cash Return
1.9%
Cap rate
1.0%
Rent to Value Ratio
Active
$440,000
2
bds
|
2
ba
|
1,030
sqft
|
built
2015
2602 E Hallandale Beach Blvd, Hallandale Beach, FL 33009
n/a
Cash flow
n/a
Cash-on-Cash Return
n/a
Cap rate
n/a
Rent to Value Ratio
Active
$745,000
2
bds
|
2
ba
|
1,130
sqft
|
built
2002
2080 S Ocean Dr, Hallandale Beach, FL 33009
$-3,159
Cash flow
-22.1%
Cash-on-Cash Return
1.1%
Cap rate
0.5%
Rent to Value Ratio
Active
$488,000
2
bds
|
2
ba
|
1,030
sqft
|
built
2015
2602 E Hallandale Beach Blvd, Hallandale Beach, FL 33009
n/a
Cash flow
n/a
Cash-on-Cash Return
n/a
Cap rate
n/a
Rent to Value Ratio

Active
$325,000
2
bds
|
2
ba
|
1,075
sqft
|
built
1979
600 Parkview Dr, Hallandale Beach, FL 33009
$-1,197
Cash flow
-19.2%
Cash-on-Cash Return
1.7%
Cap rate
0.8%
Rent to Value Ratio
Active
$390,000
2
bds
|
2
ba
|
1,130
sqft
|
built
1976
800 Parkview Dr, Hallandale Beach, FL 33009
$-1,009
Cash flow
-13.5%
Cash-on-Cash Return
3.0%
Cap rate
0.7%
Rent to Value Ratio
Active
$289,000
2
bds
|
2
ba
|
1,400
sqft
|
built
1977
600 Three Islands Blvd, Hallandale Beach, FL 33009
$-1,150
Cash flow
-20.8%
Cash-on-Cash Return
1.4%
Cap rate
1.1%
Rent to Value Ratio

Active
$280,000
2
bds
|
2
ba
|
1,130
sqft
|
built
1981
200 Leslie Dr, Hallandale Beach, FL 33009
$-706
Cash flow
-13.2%
Cash-on-Cash Return
3.1%
Cap rate
1.0%
Rent to Value Ratio
Active
$550,000
2
bds
|
2
ba
|
1,275
sqft
|
built
1970
1965 S Ocean Dr, Hallandale Beach, FL 33009
$-1,297
Cash flow
-12.3%
Cash-on-Cash Return
3.3%
Cap rate
0.6%
Rent to Value Ratio
Active
$350,000
1
bds
|
2
ba
|
870
sqft
|
built
1972
1985 S Ocean Dr, Hallandale Beach, FL 33009
$-1,458
Cash flow
-21.7%
Cash-on-Cash Return
1.1%
Cap rate
0.7%
Rent to Value Ratio
Active
$269,000
1
bds
|
1
ba
|
749
sqft
|
built
1968
1893 S Ocean Dr, Hallandale Beach, FL 33009
$-900
Cash flow
-17.5%
Cash-on-Cash Return
2.1%
Cap rate
0.7%
Rent to Value Ratio
Active
$499,000
2
bds
|
1
ba
|
999
sqft
|
built
2007
1945 S Ocean Dr, Hallandale Beach, FL 33009
$-1,691
Cash flow
-17.7%
Cash-on-Cash Return
2.1%
Cap rate
0.7%
Rent to Value Ratio
Active
$358,000
2
bds
|
2
ba
|
1,300
sqft
|
built
1970
401 Golden Isles Dr, Hallandale Beach, FL 33009
$-1,546
Cash flow
-22.5%
Cash-on-Cash Return
1.0%
Cap rate
0.8%
Rent to Value Ratio
Active
$540,000
4
bds
|
3
ba
|
2,154
sqft
|
built
1970
437 Golden Isles Dr, Hallandale Beach, FL 33009
n/a
Cash flow
n/a
Cash-on-Cash Return
n/a
Cap rate
n/a
Rent to Value Ratio
Active
$275,000
2
bds
|
2
ba
|
924
sqft
|
built
1974
501 Three Islands Blvd, Hallandale Beach, FL 33009
$-995
Cash flow
-18.9%
Cash-on-Cash Return
1.8%
Cap rate
0.7%
Rent to Value Ratio
Active
$640,000
2
bds
|
2
ba
|
1,240
sqft
|
built
1971
1950 S Ocean Dr, Hallandale Beach, FL 33009
$-2,760
Cash flow
-22.5%
Cash-on-Cash Return
1.0%
Cap rate
0.6%
Rent to Value Ratio
Active
$330,000
2
bds
|
2
ba
|
1,400
sqft
|
built
1975
600 Three Islands Blvd, Hallandale Beach, FL 33009
$-1,429
Cash flow
-22.6%
Cash-on-Cash Return
0.9%
Cap rate
0.8%
Rent to Value Ratio
Active
$200,000
1
bds
|
2
ba
|
847
sqft
|
built
1969
619 NE 14th Ave, Hallandale Beach, FL 33009
$-378
Cash flow
-9.9%
Cash-on-Cash Return
3.9%
Cap rate
1.0%
Rent to Value Ratio
Active
$282,000
1
bds
|
1
ba
|
851
sqft
|
built
1972
3180 S Ocean Dr, Hallandale Beach, FL 33009
$-1,206
Cash flow
-22.3%
Cash-on-Cash Return
1.0%
Cap rate
0.9%
Rent to Value Ratio
Active
$428,000
2
bds
|
2
ba
|
1,030
sqft
|
built
2015
2602 E Hallandale Beach Blvd, Hallandale Beach, FL 33009
n/a
Cash flow
n/a
Cash-on-Cash Return
n/a
Cap rate
n/a
Rent to Value Ratio
Active
$170,000
1
bds
|
1
ba
|
580
sqft
|
built
1963
230 SW 11th Ave, Hallandale Beach, FL 33009
$-340
Cash flow
-10.4%
Cash-on-Cash Return
3.7%
Cap rate
0.9%
Rent to Value Ratio
Active
$895,000
2
bds
|
3
ba
|
2,305
sqft
|
built
1975
1920 S Ocean Dr, Hallandale Beach, FL 33009
$-1,689
Cash flow
-9.8%
Cash-on-Cash Return
3.9%
Cap rate
0.7%
Rent to Value Ratio
Active
$355,000
2
bds
|
2
ba
|
1,075
sqft
|
built
1981
200 Leslie Dr, Hallandale Beach, FL 33009
n/a
Cash flow
n/a
Cash-on-Cash Return
n/a
Cap rate
n/a
Rent to Value Ratio