Hallandale Beach, FL Investment Properties for Sale
Browse homes for sale and investment properties in Hallandale Beach, FL. Refine your search by price, property type, or more.
Best cash flowing properties in Hallandale Beach, FL
Active
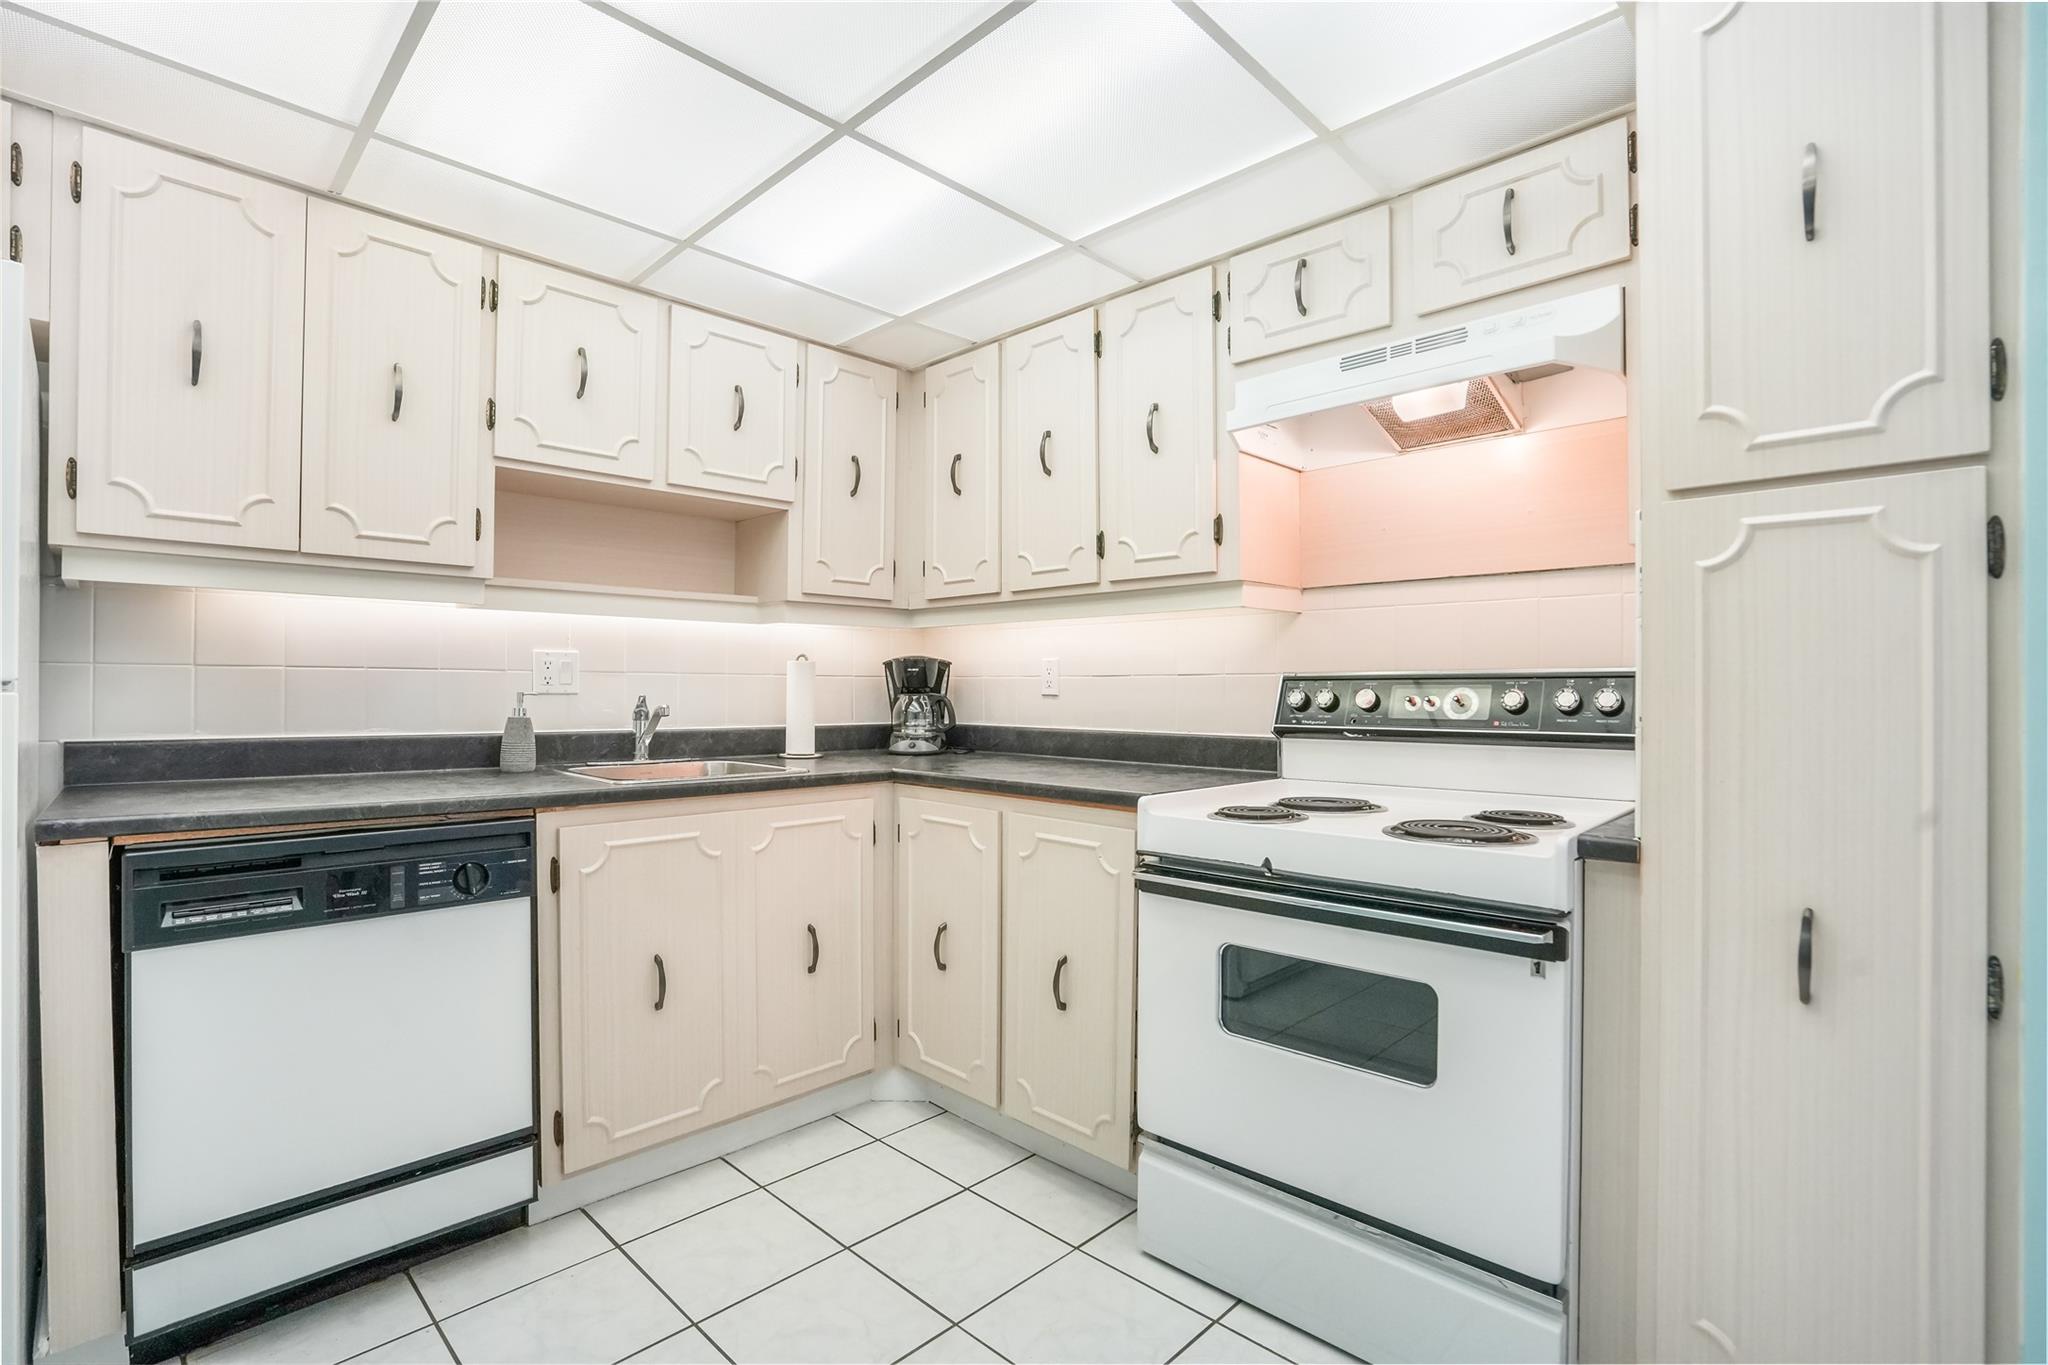
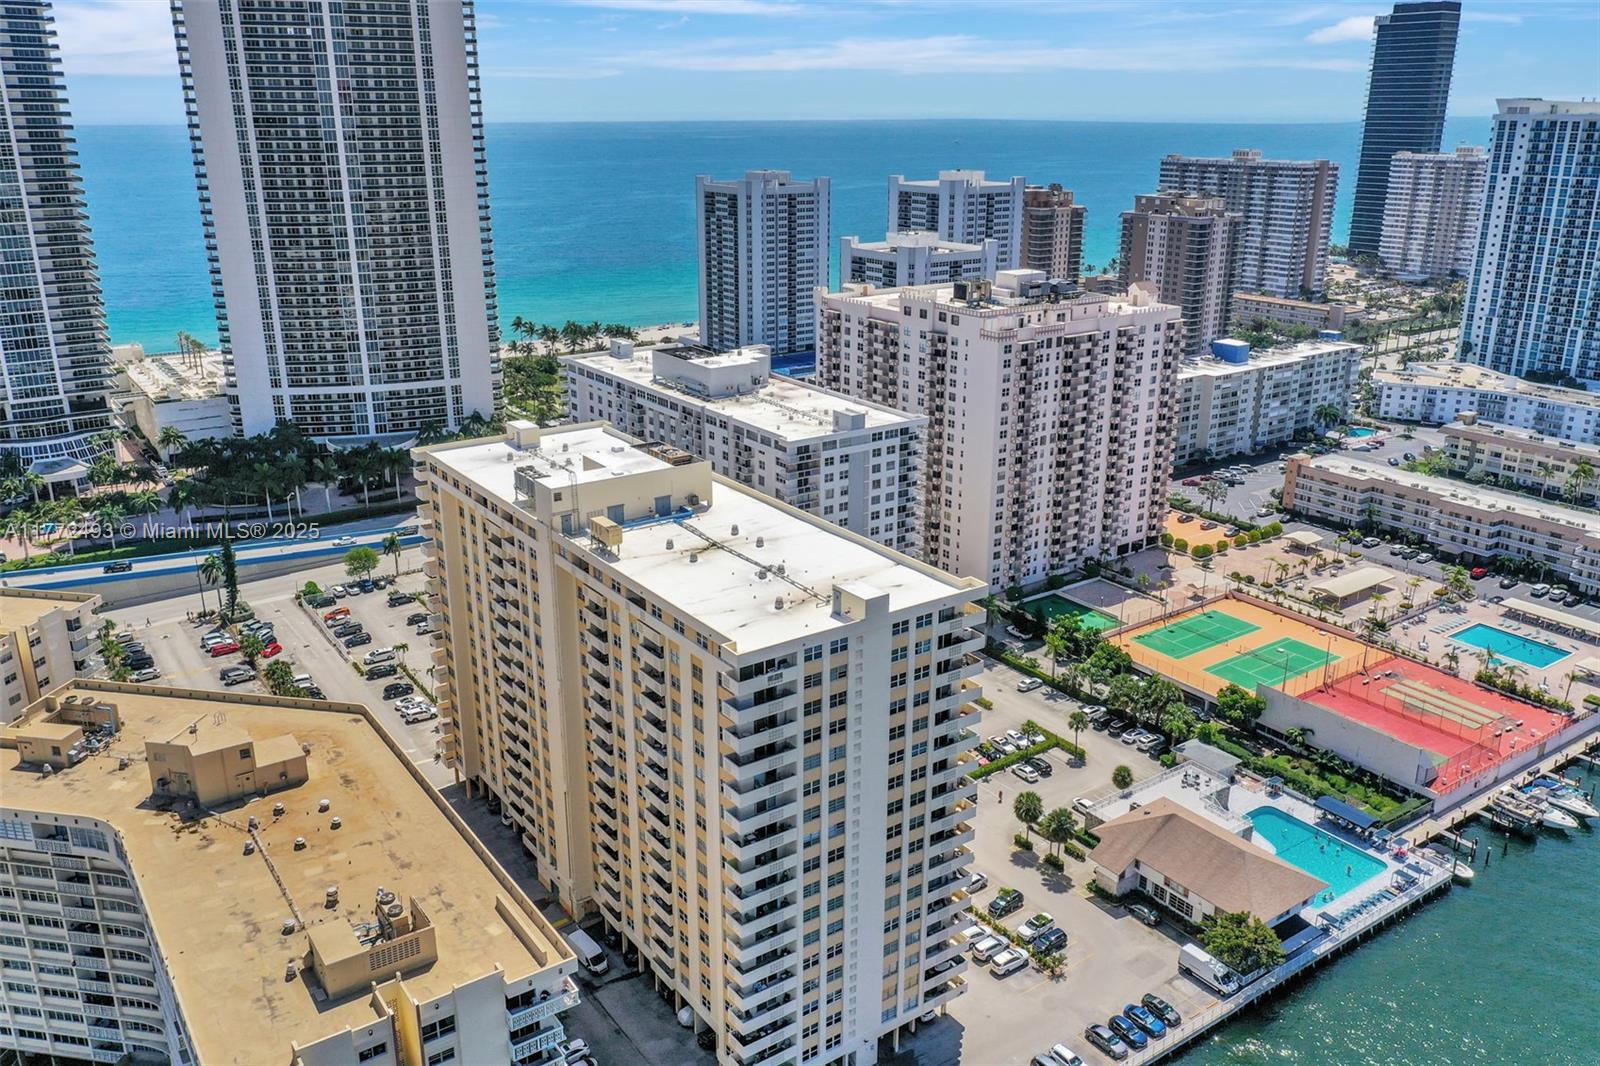
$239,900
1
bds
|
2
ba
|
817
sqft
|
built
1968
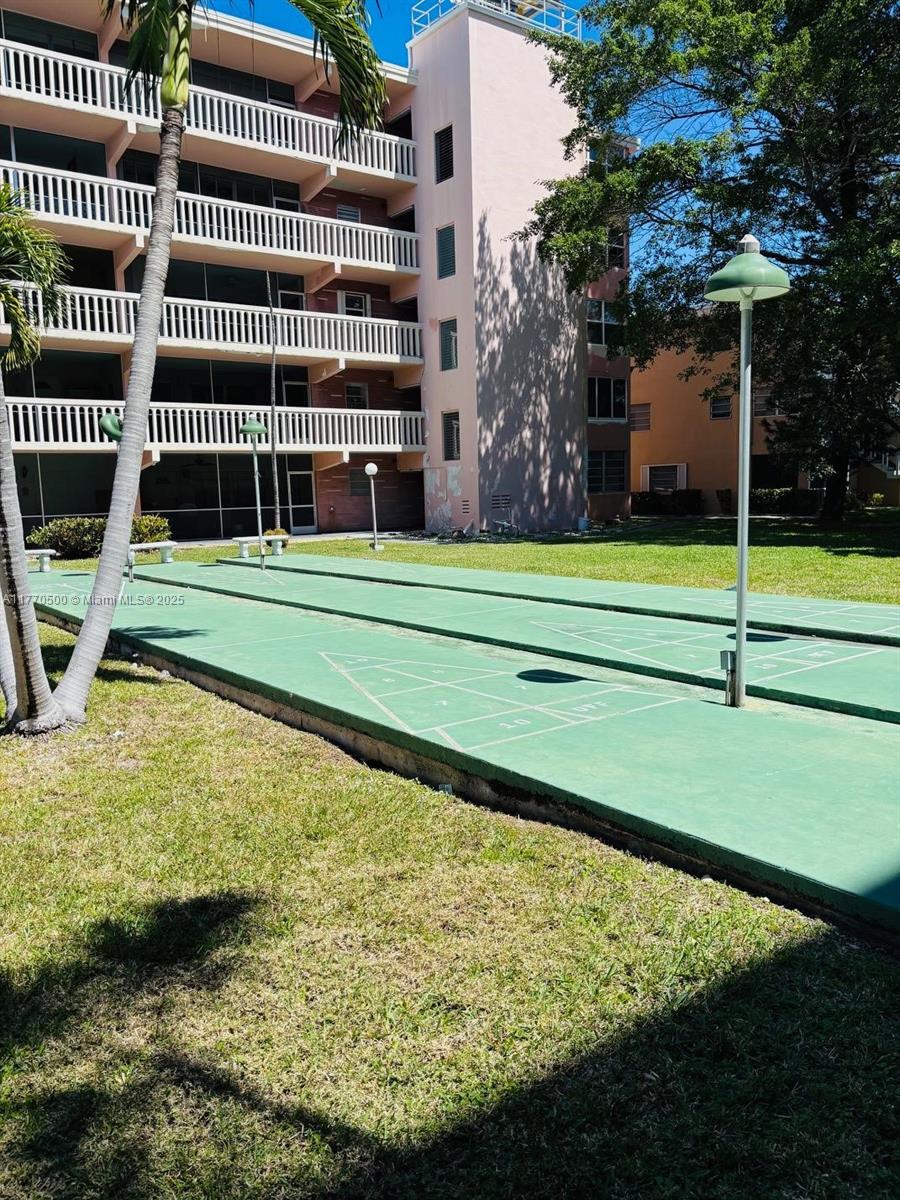
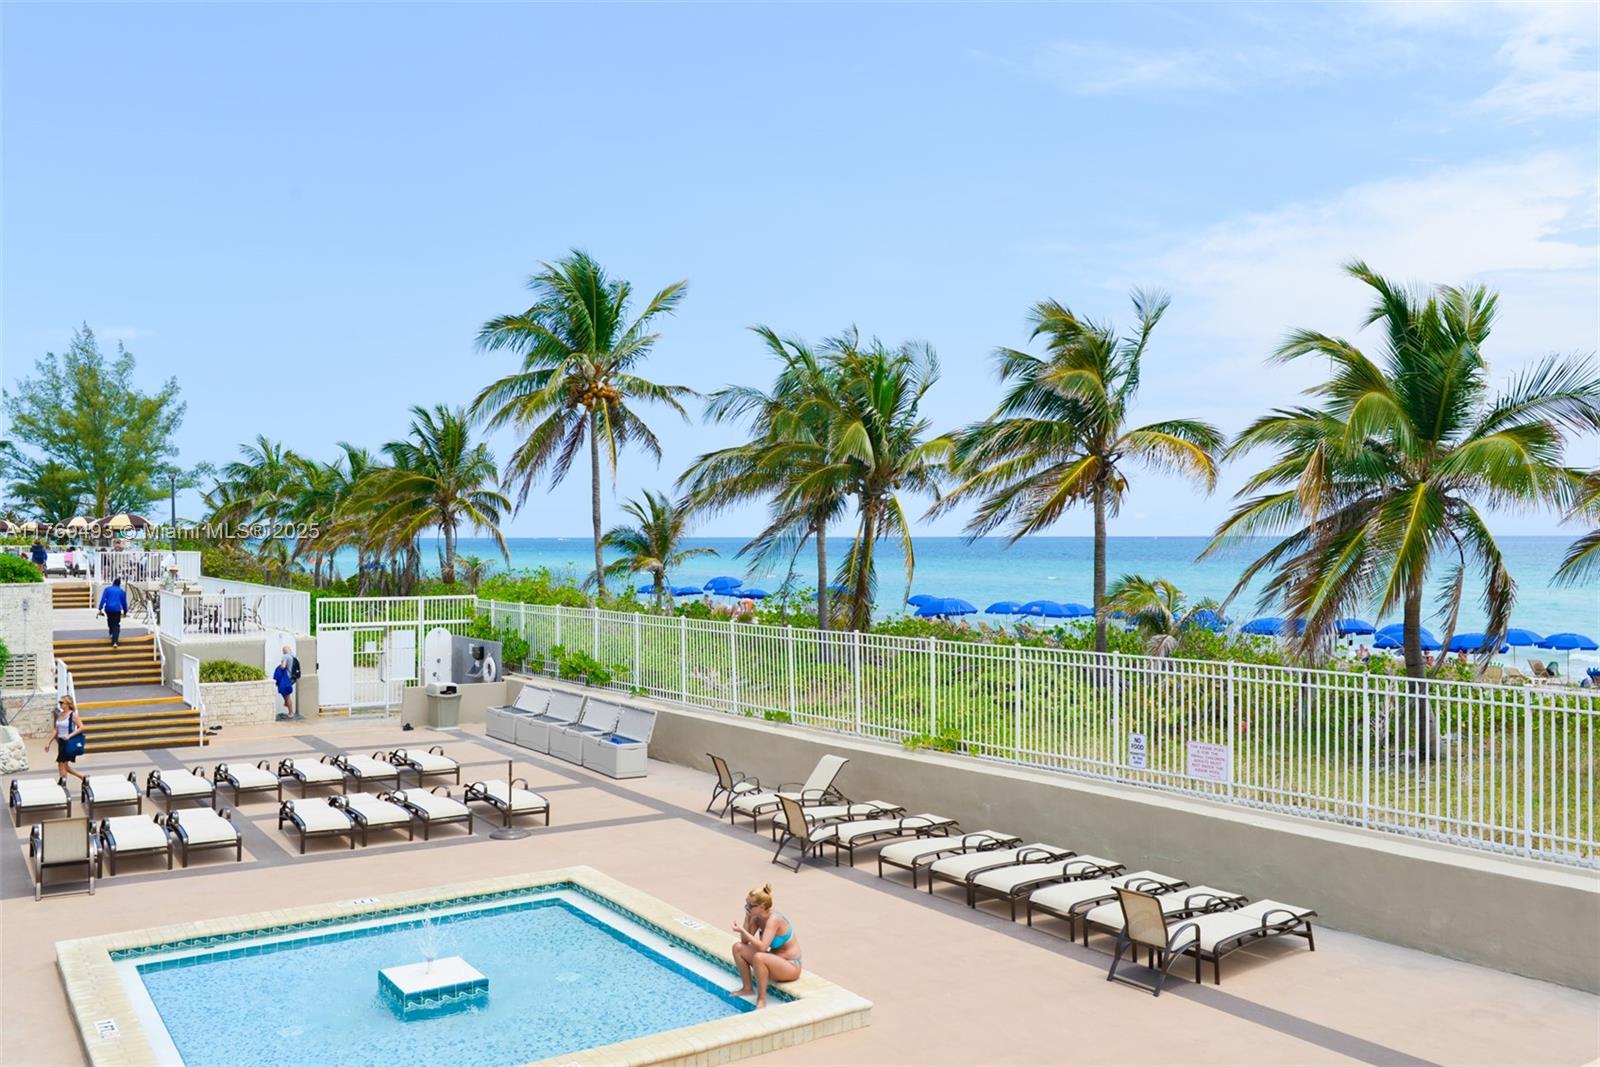
1893 S Ocean Dr, Hallandale Beach, FL 33009
$-206
Cash flow
-4.5%
Cash-on-Cash Return
5.1%
Cap rate
1.0%
Rent to Value Ratio
Active
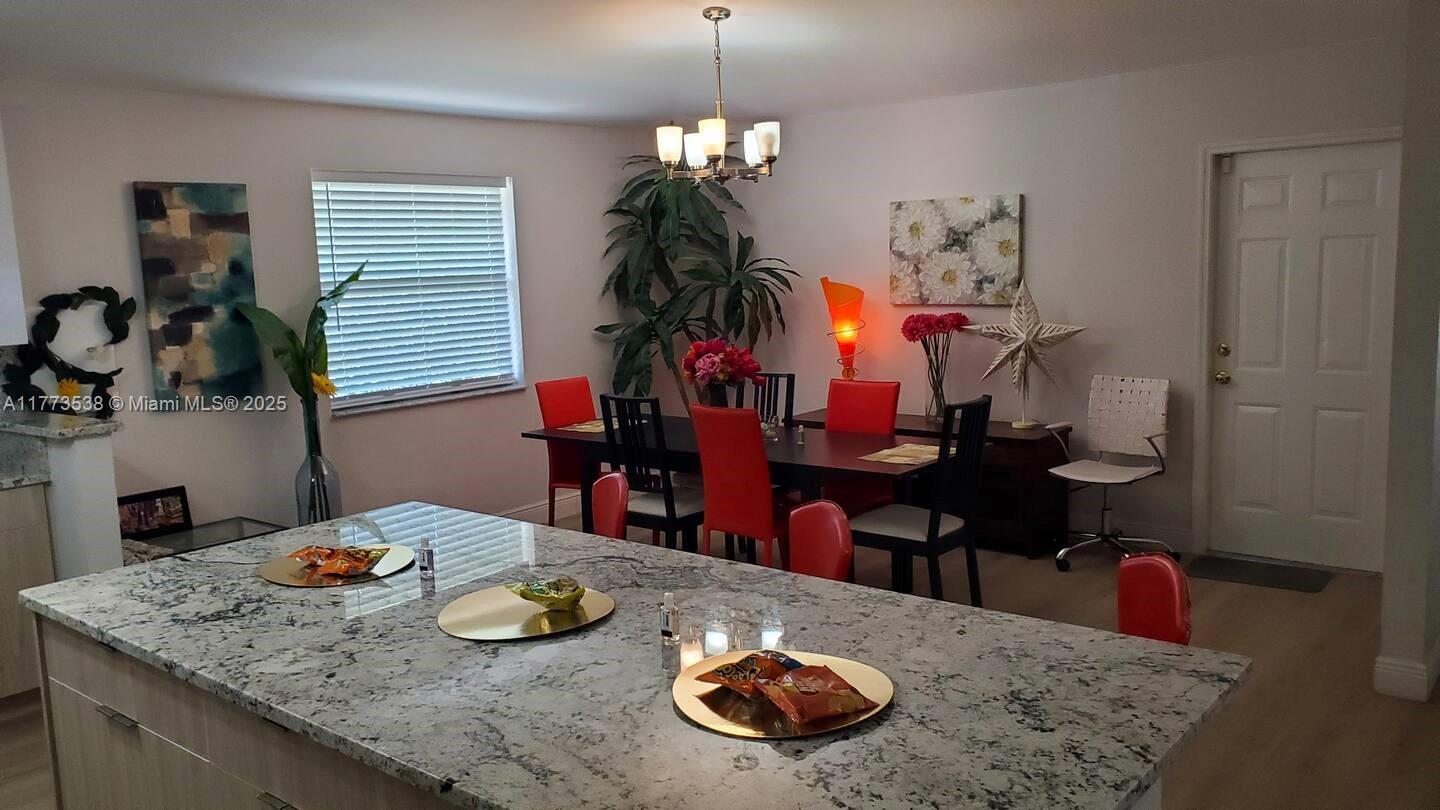
$155,000
1
bds
|
2
ba
|
785
sqft
|
built
1969
1000 NE 14th Ave, Hallandale Beach, FL 33009
$-371
Cash flow
-12.5%
Cash-on-Cash Return
3.3%
Cap rate
1.2%
Rent to Value Ratio
833 out of 931 properties for sale in Hallandale Beach, FL
Limited Results Shown
Create a free account, or log in to reveal all property listings and enjoy the complete experience.
Active
$429,000
1
bds
|
2
ba
|
836
sqft
|
built
1979
3140 S Ocean Dr, Hallandale Beach, FL 33009
$-1,092
Cash flow
-13.3%
Cash-on-Cash Return
3.1%
Cap rate
0.8%
Rent to Value Ratio

Active
$245,000
2
bds
|
2
ba
|
1,092
sqft
|
built
1969
610 NE 12th Ave, Hallandale Beach, FL 33009
$-458
Cash flow
-9.8%
Cash-on-Cash Return
3.9%
Cap rate
0.9%
Rent to Value Ratio

Active
$2,250,000
3
bds
|
4
ba
|
2,078
sqft
|
built
2005
1850 S Ocean Dr, Hallandale Beach, FL 33009
$-8,658
Cash flow
-20.1%
Cash-on-Cash Return
1.5%
Cap rate
0.4%
Rent to Value Ratio
Active
$149,999
1
bds
|
1
ba
|
720
sqft
|
built
1965
700 Layne Blvd, Hallandale Beach, FL 33009
$-463
Cash flow
-16.1%
Cash-on-Cash Return
2.4%
Cap rate
1.2%
Rent to Value Ratio
Active
$574,900
2
bds
|
2
ba
|
1,240
sqft
|
built
1971
1950 S Ocean Dr, Hallandale Beach, FL 33009
$-1,789
Cash flow
-16.2%
Cash-on-Cash Return
2.4%
Cap rate
0.5%
Rent to Value Ratio

Active
$1,049,000
bds
|
0
ba
|
3,166
sqft
|
built
1967
219 NE 11th Ave, Hallandale Beach, FL 33009
$-4,467
Cash flow
-22.2%
Cash-on-Cash Return
1.0%
Cap rate
0.3%
Rent to Value Ratio
Active
$265,000
2
bds
|
2
ba
|
1,300
sqft
|
built
1968
851 NE 14th Ave, Hallandale Beach, FL 33009
$-531
Cash flow
-10.5%
Cash-on-Cash Return
3.7%
Cap rate
1.0%
Rent to Value Ratio
Active
$289,000
1
bds
|
2
ba
|
950
sqft
|
built
1980
2500 Parkview Dr, Hallandale Beach, FL 33009
$-1,108
Cash flow
-20.0%
Cash-on-Cash Return
1.5%
Cap rate
0.8%
Rent to Value Ratio
Active
$950,000
bds
|
0
ba
|
1,998
sqft
|
built
1960
1010 NW 3rd Ave, Hallandale Beach, FL 33009
$-4,529
Cash flow
-24.9%
Cash-on-Cash Return
0.4%
Cap rate
0.2%
Rent to Value Ratio
Active
$329,000
2
bds
|
2
ba
|
1,250
sqft
|
built
1976
3113 S Ocean Dr, Hallandale Beach, FL 33009
$-679
Cash flow
-10.8%
Cash-on-Cash Return
3.7%
Cap rate
0.9%
Rent to Value Ratio
Active
$325,999
2
bds
|
2
ba
|
1,360
sqft
|
built
1972
1833 S Ocean Dr, Hallandale Beach, FL 33009
$-1,284
Cash flow
-20.5%
Cash-on-Cash Return
1.4%
Cap rate
0.9%
Rent to Value Ratio
Active
$565,000
3
bds
|
2
ba
|
1,680
sqft
|
built
2003
101 NW 2nd Ave, Hallandale Beach, FL 33009
$-1,021
Cash flow
-9.4%
Cash-on-Cash Return
4.0%
Cap rate
0.6%
Rent to Value Ratio
Active
$319,000
2
bds
|
2
ba
|
1,130
sqft
|
built
1981
200 Leslie Dr, Hallandale Beach, FL 33009
$-1,154
Cash flow
-18.9%
Cash-on-Cash Return
1.8%
Cap rate
0.9%
Rent to Value Ratio
Active
$239,900
1
bds
|
2
ba
|
817
sqft
|
built
1968
1893 S Ocean Dr, Hallandale Beach, FL 33009
$-206
Cash flow
-4.5%
Cash-on-Cash Return
5.1%
Cap rate
1.0%
Rent to Value Ratio
Active
$319,000
2
bds
|
2
ba
|
1,075
sqft
|
built
1981
400 Leslie Dr, Hallandale Beach, FL 33009
$-895
Cash flow
-14.6%
Cash-on-Cash Return
2.8%
Cap rate
0.8%
Rent to Value Ratio

Active
$434,900
2
bds
|
2
ba
|
1,200
sqft
|
built
1970
1849 S Ocean Dr, Hallandale Beach, FL 33009
$-1,080
Cash flow
-13.0%
Cash-on-Cash Return
3.2%
Cap rate
0.8%
Rent to Value Ratio
Active
$338,000
2
bds
|
2
ba
|
1,285
sqft
|
built
1972
427 Golden Isles Dr, Hallandale Beach, FL 33009
$-1,320
Cash flow
-20.4%
Cash-on-Cash Return
1.5%
Cap rate
0.8%
Rent to Value Ratio

Active
$360,000
1
bds
|
2
ba
|
870
sqft
|
built
1972
1985 S Ocean Dr, Hallandale Beach, FL 33009
$-1,506
Cash flow
-21.8%
Cash-on-Cash Return
1.1%
Cap rate
0.7%
Rent to Value Ratio
Active
$355,000
2
bds
|
2
ba
|
1,100
sqft
|
built
1972
1833 S Ocean Dr, Hallandale Beach, FL 33009
$-1,360
Cash flow
-20.0%
Cash-on-Cash Return
1.5%
Cap rate
0.8%
Rent to Value Ratio
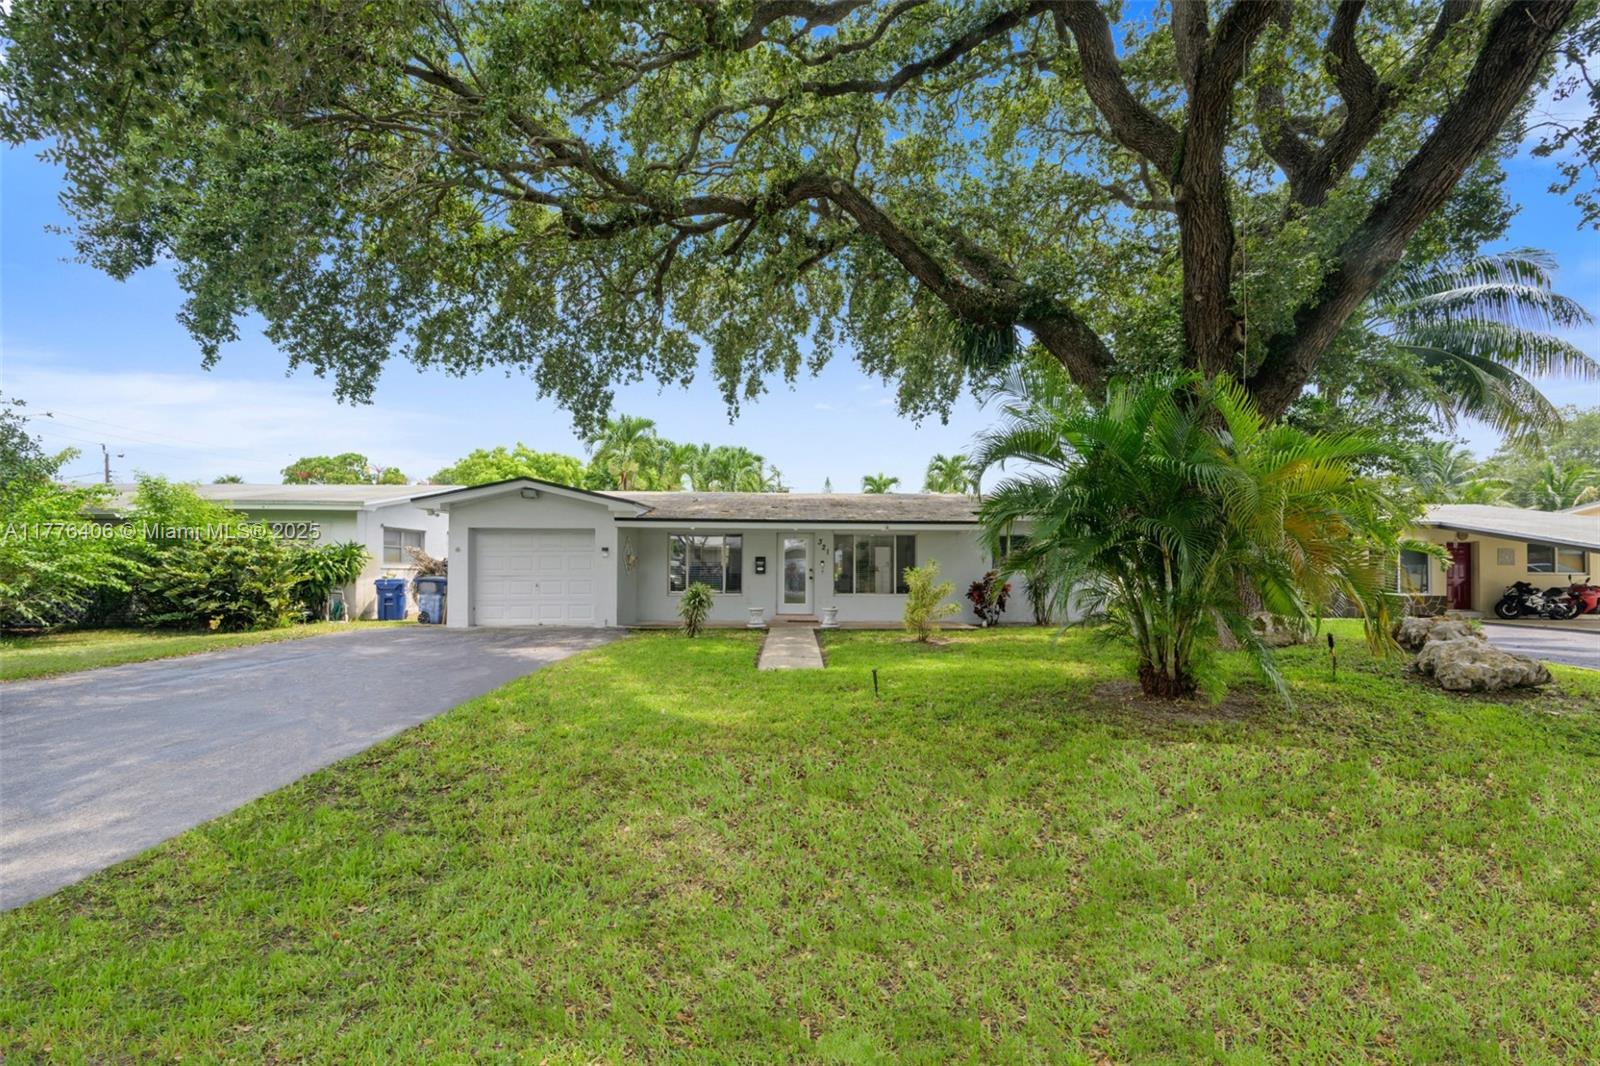
Active
$540,000
3
bds
|
2
ba
|
1,608
sqft
|
built
1963
321 SW 11th Ave, Hallandale Beach, FL 33009
$-1,247
Cash flow
-12.0%
Cash-on-Cash Return
3.4%
Cap rate
0.7%
Rent to Value Ratio
Active
$1,300,000
2
bds
|
4
ba
|
1,592
sqft
|
built
1984
300 Three Islands Blvd, Hallandale Beach, FL 33009
$-5,413
Cash flow
-21.7%
Cash-on-Cash Return
1.2%
Cap rate
0.3%
Rent to Value Ratio
Active
$289,000
1
bds
|
2
ba
|
1,000
sqft
|
built
1975
600 Three Islands Blvd, Hallandale Beach, FL 33009
$-1,144
Cash flow
-20.7%
Cash-on-Cash Return
1.4%
Cap rate
0.8%
Rent to Value Ratio
Active
$510,000
2
bds
|
2
ba
|
1,248
sqft
|
built
1970
2030 S Ocean Dr, Hallandale Beach, FL 33009
$-2,178
Cash flow
-22.3%
Cash-on-Cash Return
1.0%
Cap rate
0.7%
Rent to Value Ratio

Active
$399,000
1
bds
|
2
ba
|
870
sqft
|
built
1971
1980 S Ocean Dr, Hallandale Beach, FL 33009
$-1,459
Cash flow
-19.1%
Cash-on-Cash Return
1.8%
Cap rate
0.7%
Rent to Value Ratio
Active
$340,000
1
bds
|
1
ba
|
570
sqft
|
built
1979
3140 S Ocean Dr, Hallandale Beach, FL 33009
$-1,274
Cash flow
-19.5%
Cash-on-Cash Return
1.7%
Cap rate
0.6%
Rent to Value Ratio
Active
$200,000
1
bds
|
1
ba
|
650
sqft
|
built
1965
161 NE 10th Ave, Hallandale Beach, FL 33009
$-420
Cash flow
-11.0%
Cash-on-Cash Return
3.6%
Cap rate
1.1%
Rent to Value Ratio
Active
$6,990,000
6
bds
|
7
ba
|
5,793
sqft
|
built
2019
418 Sunset Dr, Hallandale Beach, FL 33009
$-40,399
Cash flow
-30.2%
Cash-on-Cash Return
-0.8%
Cap rate
0.1%
Rent to Value Ratio
Active
$319,000
2
bds
|
2
ba
|
1,400
sqft
|
built
1974
500 Three Islands Blvd, Hallandale Beach, FL 33009
$-1,400
Cash flow
-22.9%
Cash-on-Cash Return
0.9%
Cap rate
0.9%
Rent to Value Ratio
Active
$1,230,000
2
bds
|
2
ba
|
1,458
sqft
|
built
2006
1830 S Ocean Dr, Hallandale Beach, FL 33009
$-5,513
Cash flow
-23.4%
Cash-on-Cash Return
0.8%
Cap rate
0.5%
Rent to Value Ratio
Active
$339,900
2
bds
|
2
ba
|
1,150
sqft
|
built
1970
300 Diplomat Pkwy, Hallandale Beach, FL 33009
$-1,226
Cash flow
-18.8%
Cash-on-Cash Return
1.8%
Cap rate
0.8%
Rent to Value Ratio
Active
$514,999
bds
|
0
ba
|
1,141
sqft
|
built
1954
731 SW 8th Ave, Hallandale Beach, FL 33009
$-1,525
Cash flow
-15.4%
Cash-on-Cash Return
2.6%
Cap rate
0.5%
Rent to Value Ratio
Active
$400,000
3
bds
|
2
ba
|
1,560
sqft
|
built
1980
2500 Parkview Dr, Hallandale Beach, FL 33009
$-1,005
Cash flow
-13.1%
Cash-on-Cash Return
3.1%
Cap rate
1.1%
Rent to Value Ratio
Active
$849,000
bds
|
0
ba
|
1,928
sqft
|
built
1965
805 NE 6th St, Hallandale Beach, FL 33009
$-3,278
Cash flow
-20.1%
Cash-on-Cash Return
1.5%
Cap rate
0.3%
Rent to Value Ratio
Active
$215,000
2
bds
|
2
ba
|
1,136
sqft
|
built
1966
200 NE 12th Ave, Hallandale Beach, FL 33009
$-422
Cash flow
-10.2%
Cash-on-Cash Return
3.8%
Cap rate
1.1%
Rent to Value Ratio
Active
$155,000
1
bds
|
2
ba
|
785
sqft
|
built
1969
1000 NE 14th Ave, Hallandale Beach, FL 33009
$-371
Cash flow
-12.5%
Cash-on-Cash Return
3.3%
Cap rate
1.2%
Rent to Value Ratio
Active
$800,000
3
bds
|
3
ba
|
1,780
sqft
|
built
1971
1980 S Ocean Dr, Hallandale Beach, FL 33009
$-3,081
Cash flow
-20.1%
Cash-on-Cash Return
1.5%
Cap rate
0.7%
Rent to Value Ratio
Active
$275,000
2
bds
|
2
ba
|
1,280
sqft
|
built
1980
2500 Parkview Dr, Hallandale Beach, FL 33009
$-1,080
Cash flow
-20.5%
Cash-on-Cash Return
1.4%
Cap rate
0.9%
Rent to Value Ratio
Active
$248,000
2
bds
|
2
ba
|
1,092
sqft
|
built
1971
3161 S Ocean Dr, Hallandale Beach, FL 33009
$-392
Cash flow
-8.2%
Cash-on-Cash Return
4.2%
Cap rate
1.0%
Rent to Value Ratio
Active
$775,000
3
bds
|
3
ba
|
1,577
sqft
|
built
2015
2600 E Hallandale Beach Blvd, Hallandale Beach, FL 33009
$-3,417
Cash flow
-23.0%
Cash-on-Cash Return
0.9%
Cap rate
0.7%
Rent to Value Ratio
Active
$825,000
3
bds
|
3
ba
|
1,577
sqft
|
built
2015
2600 E Hallandale Beach Blvd, Hallandale Beach, FL 33009
$-3,107
Cash flow
-19.6%
Cash-on-Cash Return
1.6%
Cap rate
0.7%
Rent to Value Ratio