Hallandale Beach, FL Investment Properties for Sale
Browse homes for sale and investment properties in Hallandale Beach, FL. Refine your search by price, property type, or more.
Best cash flowing properties in Hallandale Beach, FL
Active
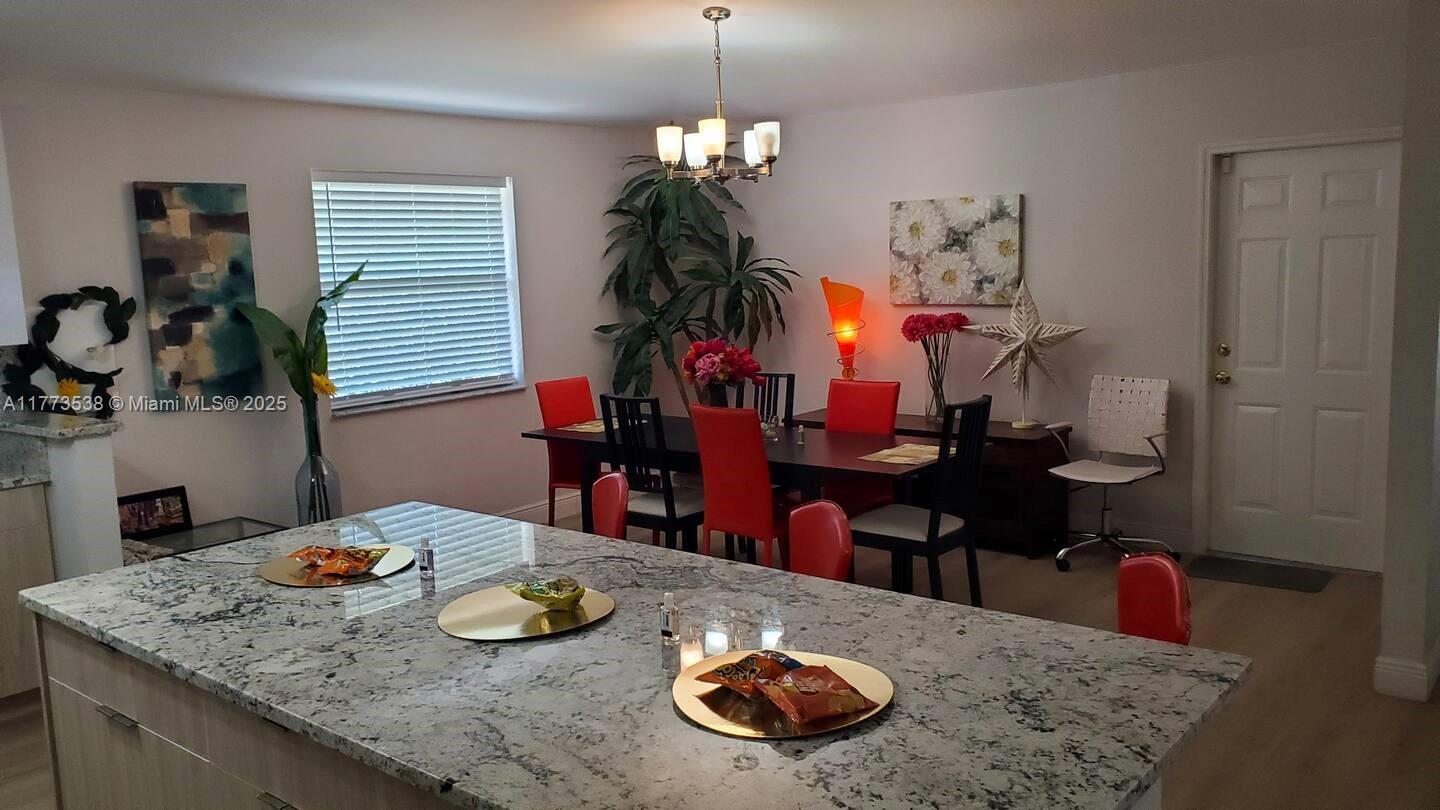
$490,000
2
bds
|
1
ba
|
1,162
sqft
|
built
1962
421 SW 11th Ave, Hallandale Beach, FL 33009
$-190
Cash flow
-2.0%
Cash-on-Cash Return
5.8%
Cap rate
0.7%
Rent to Value Ratio

Active
$400,000
4
bds
|
2
ba
|
1,413
sqft
|
built
1990
744 NW 7th St, Hallandale Beach, FL 33009
$-197
Cash flow
-2.6%
Cash-on-Cash Return
5.7%
Cap rate
0.7%
Rent to Value Ratio
62 out of 66 properties for sale in Hallandale Beach, FL
Limited Results Shown
Create a free account, or log in to reveal all property listings and enjoy the complete experience.
Active
$625,000
3
bds
|
2
ba
|
1,449
sqft
|
built
1961
728 SW 4th St, Hallandale Beach, FL 33009
$-1,105
Cash flow
-9.2%
Cash-on-Cash Return
4.2%
Cap rate
0.6%
Rent to Value Ratio
Active
$650,000
3
bds
|
2
ba
|
1,304
sqft
|
built
1955
918 NE 6th St, Hallandale Beach, FL 33009
$-1,241
Cash flow
-10.0%
Cash-on-Cash Return
4.0%
Cap rate
0.6%
Rent to Value Ratio
Active
$695,000
4
bds
|
3
ba
|
1,681
sqft
|
built
1956
100 NW 8th Ave, Hallandale Beach, FL 33009
$-2,178
Cash flow
-16.4%
Cash-on-Cash Return
2.5%
Cap rate
0.4%
Rent to Value Ratio
Active
$645,000
3
bds
|
2
ba
|
1,662
sqft
|
built
1955
913 NE 5th St, Hallandale Beach, FL 33009
$-1,534
Cash flow
-12.4%
Cash-on-Cash Return
3.4%
Cap rate
0.6%
Rent to Value Ratio
Active
$800,000
3
bds
|
2
ba
|
1,904
sqft
|
built
1955
901 NE 8th St, Hallandale Beach, FL 33009
$-1,414
Cash flow
-9.2%
Cash-on-Cash Return
4.2%
Cap rate
0.7%
Rent to Value Ratio
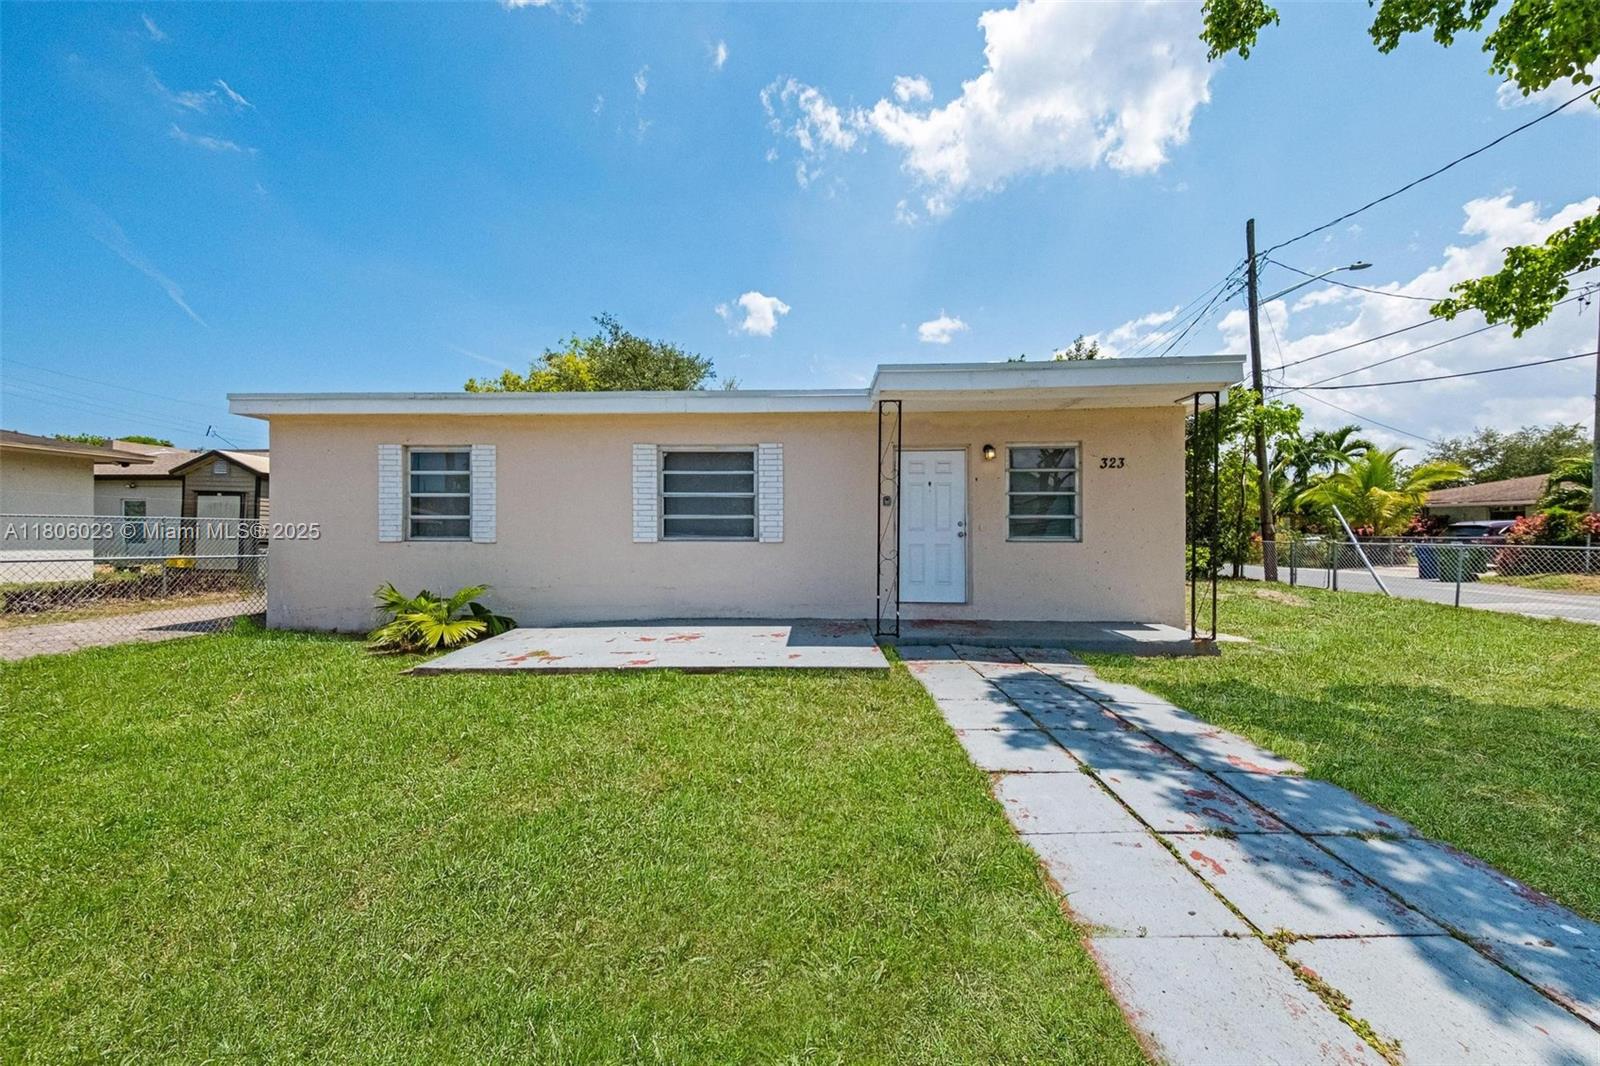
Pending
$400,000
3
bds
|
2
ba
|
936
sqft
|
built
1954
323 NW 9th St, Hallandale Beach, FL 33009
$-797
Cash flow
-10.4%
Cash-on-Cash Return
3.9%
Cap rate
0.6%
Rent to Value Ratio
Active
$620,000
4
bds
|
3
ba
|
1,417
sqft
|
built
1954
600 SW 10th St, Hallandale Beach, FL 33009
$-1,789
Cash flow
-15.1%
Cash-on-Cash Return
2.8%
Cap rate
0.5%
Rent to Value Ratio
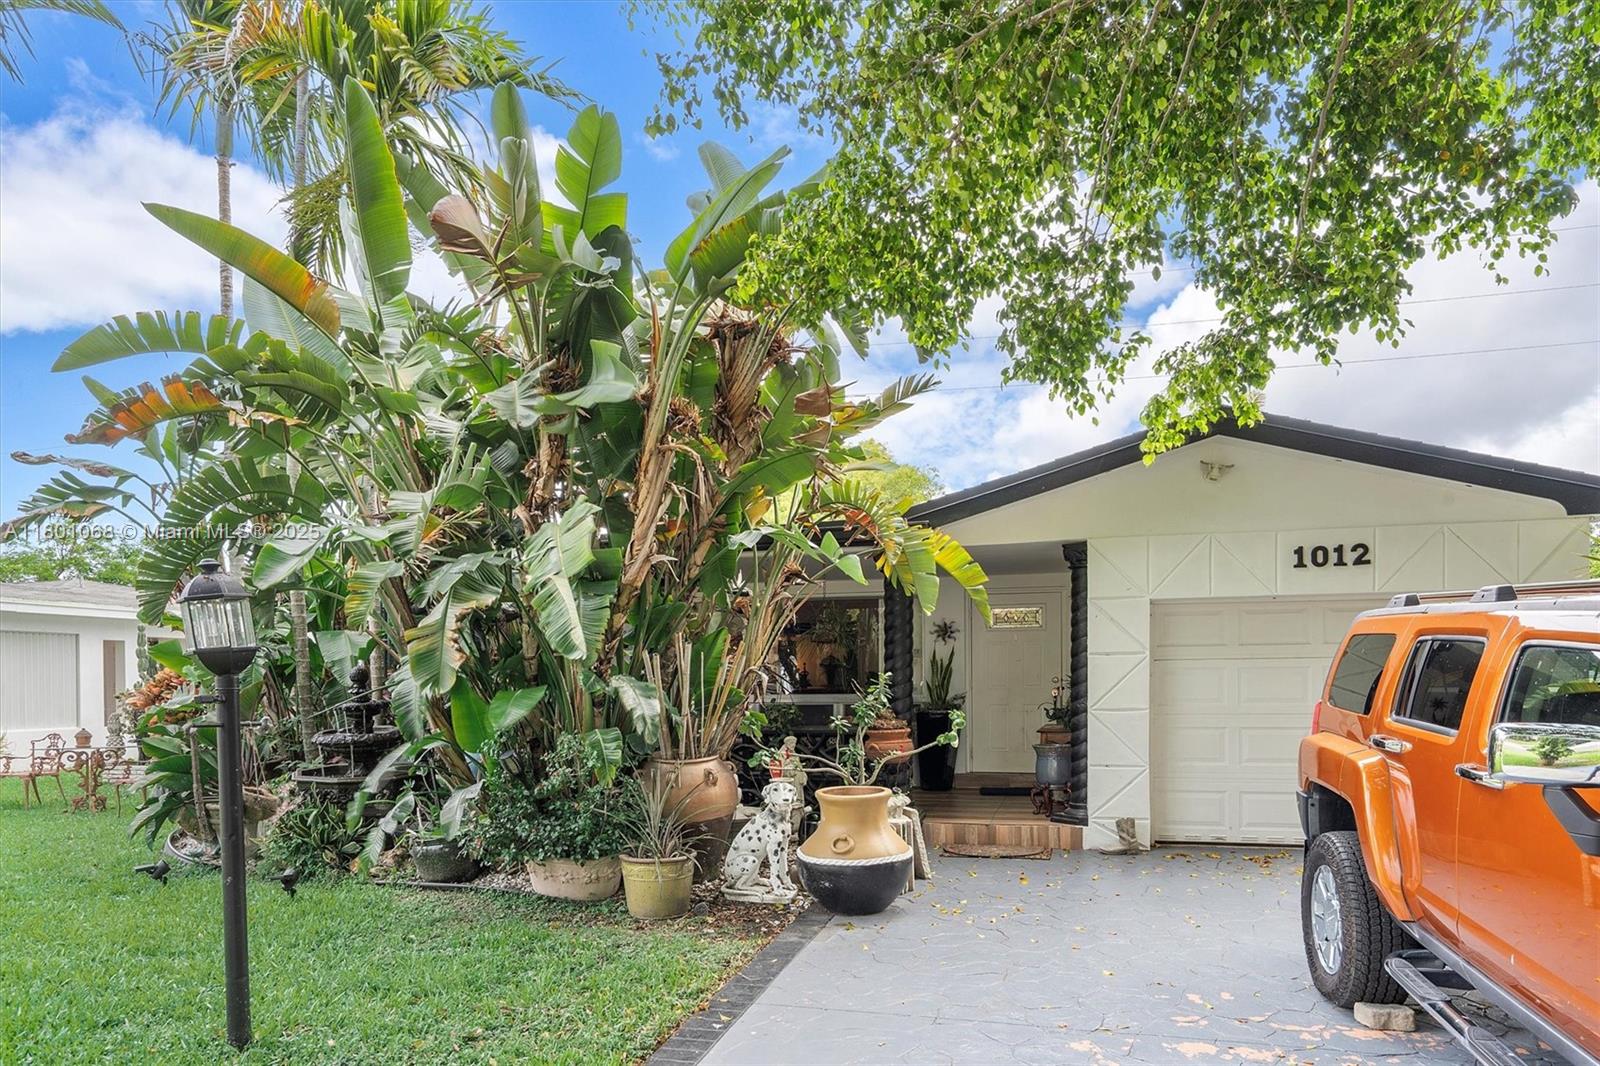
Active
$780,000
3
bds
|
3
ba
|
1,759
sqft
|
built
1958
1012 NE 8th St, Hallandale Beach, FL 33009
$-1,742
Cash flow
-11.7%
Cash-on-Cash Return
3.6%
Cap rate
0.6%
Rent to Value Ratio
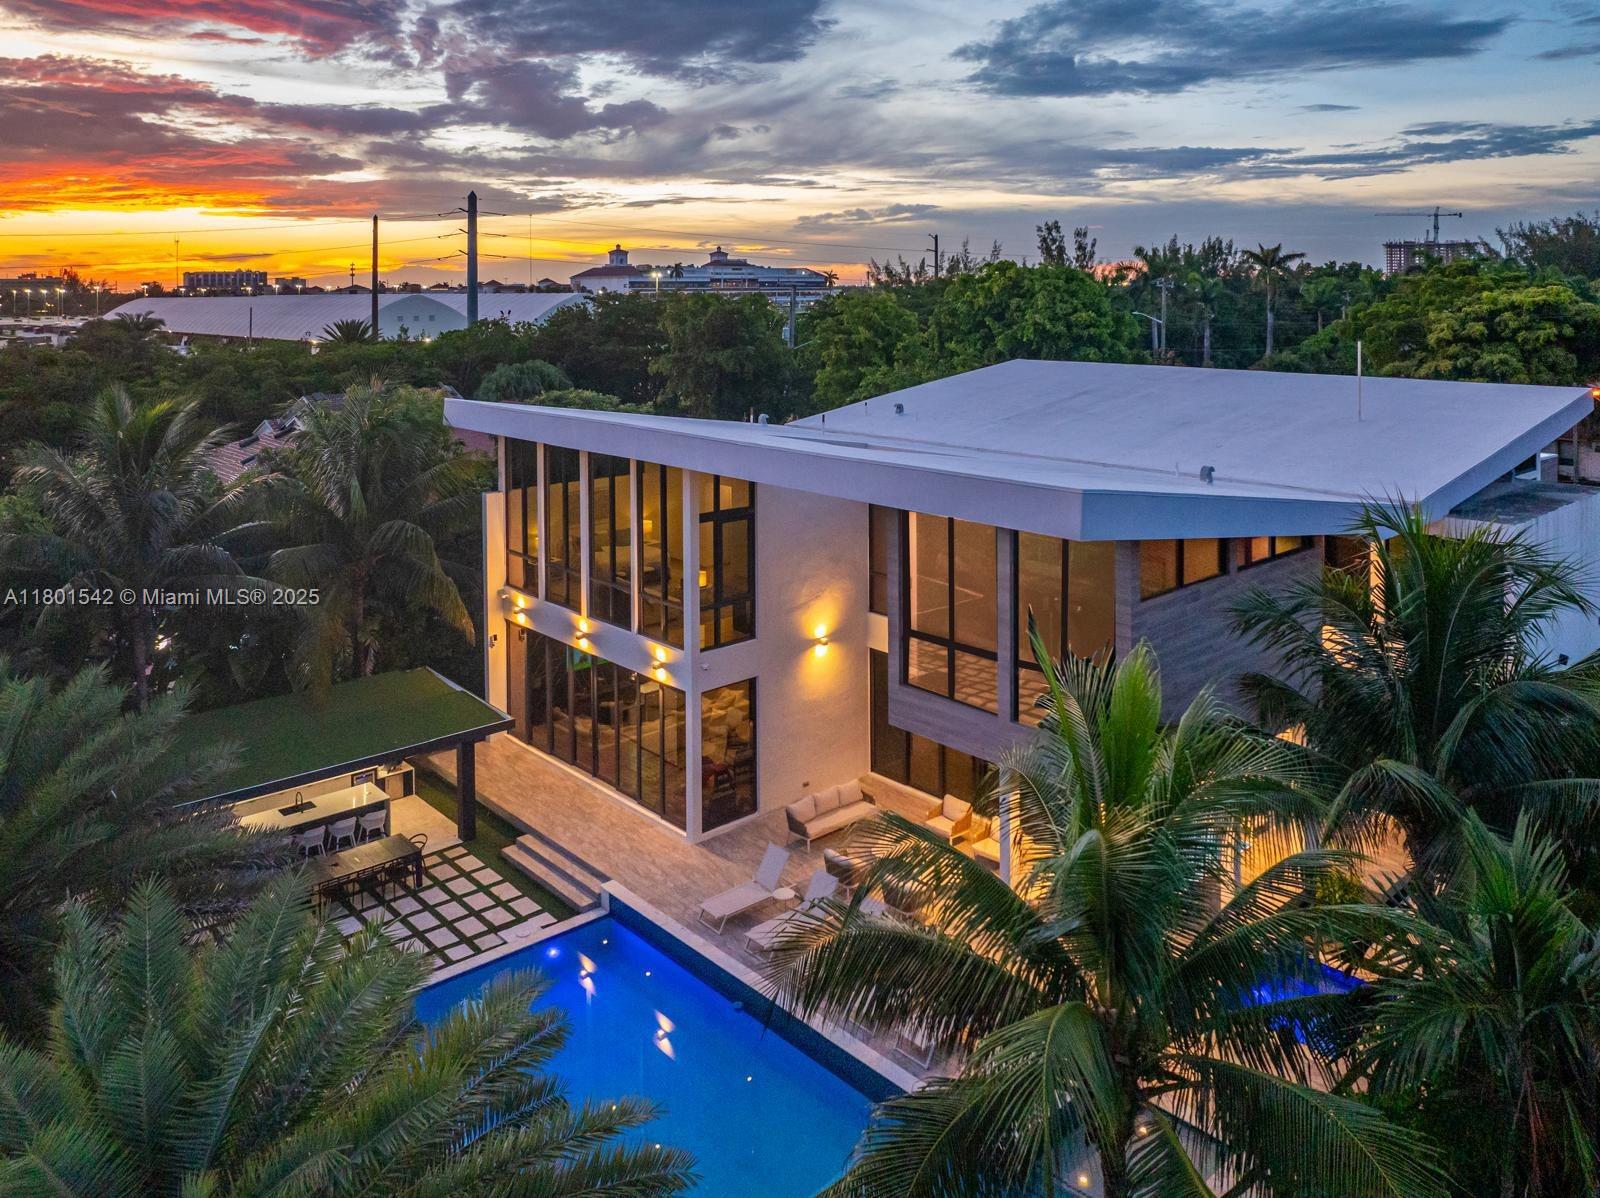
Active
$6,828,000
7
bds
|
7
ba
|
5,560
sqft
|
built
2018
521 Holiday Dr, Hallandale Beach, FL 33009
$-29,023
Cash flow
-22.2%
Cash-on-Cash Return
1.2%
Cap rate
0.1%
Rent to Value Ratio
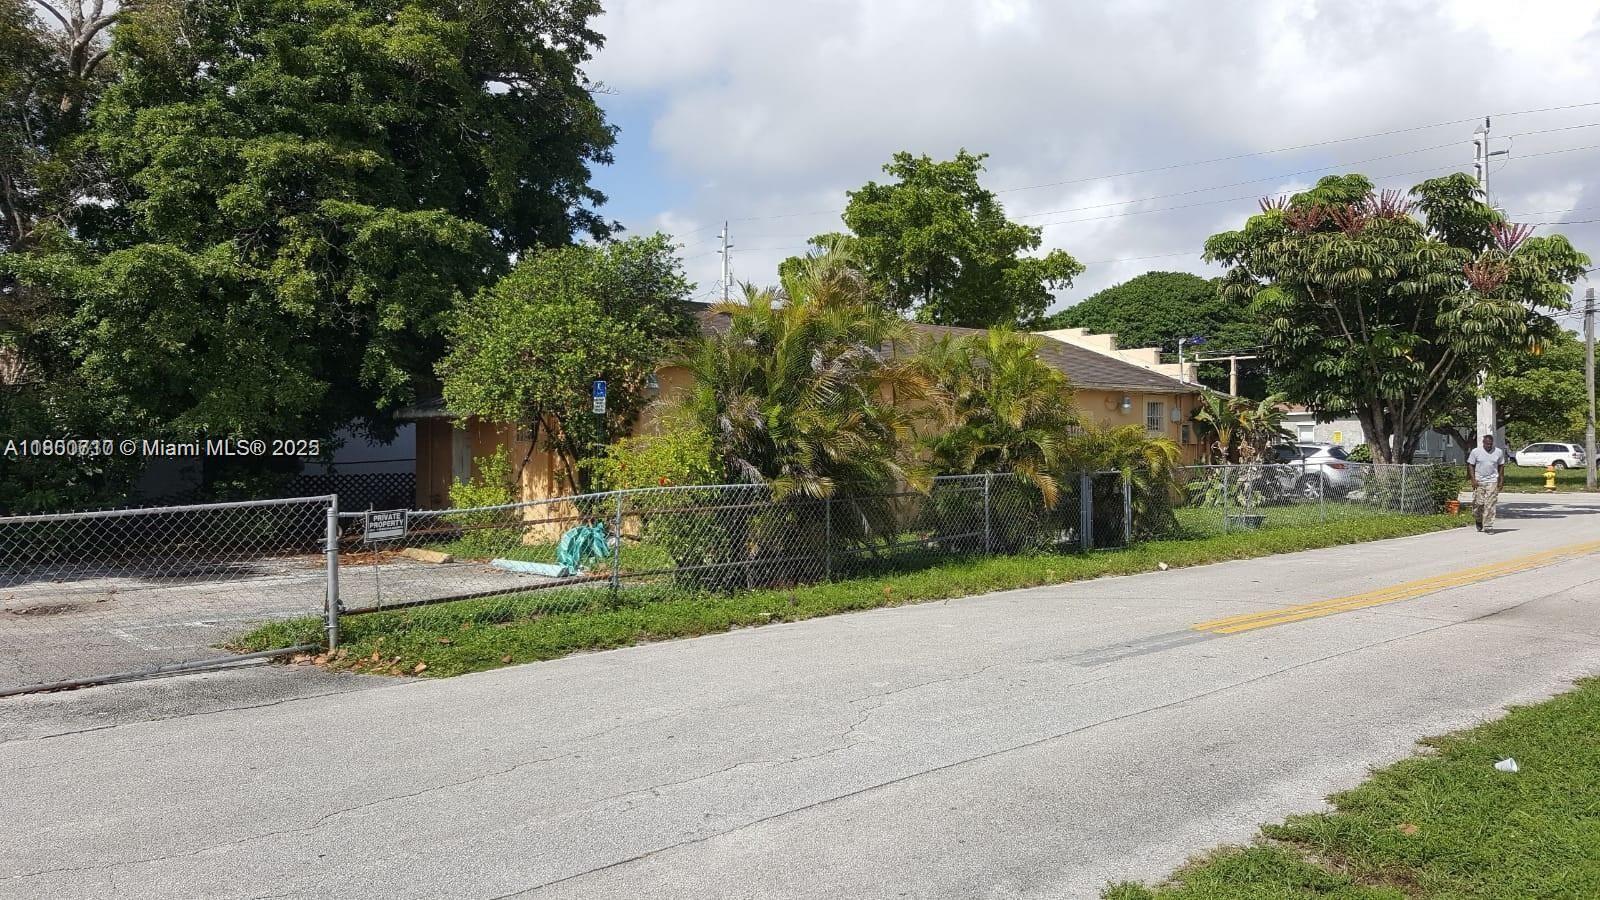
Active
$499,000
5
bds
|
2
ba
|
1,706
sqft
|
built
1952
520 NW 2nd Ave, Hallandale Beach, FL 33009
$-272
Cash flow
-2.8%
Cash-on-Cash Return
5.6%
Cap rate
0.8%
Rent to Value Ratio
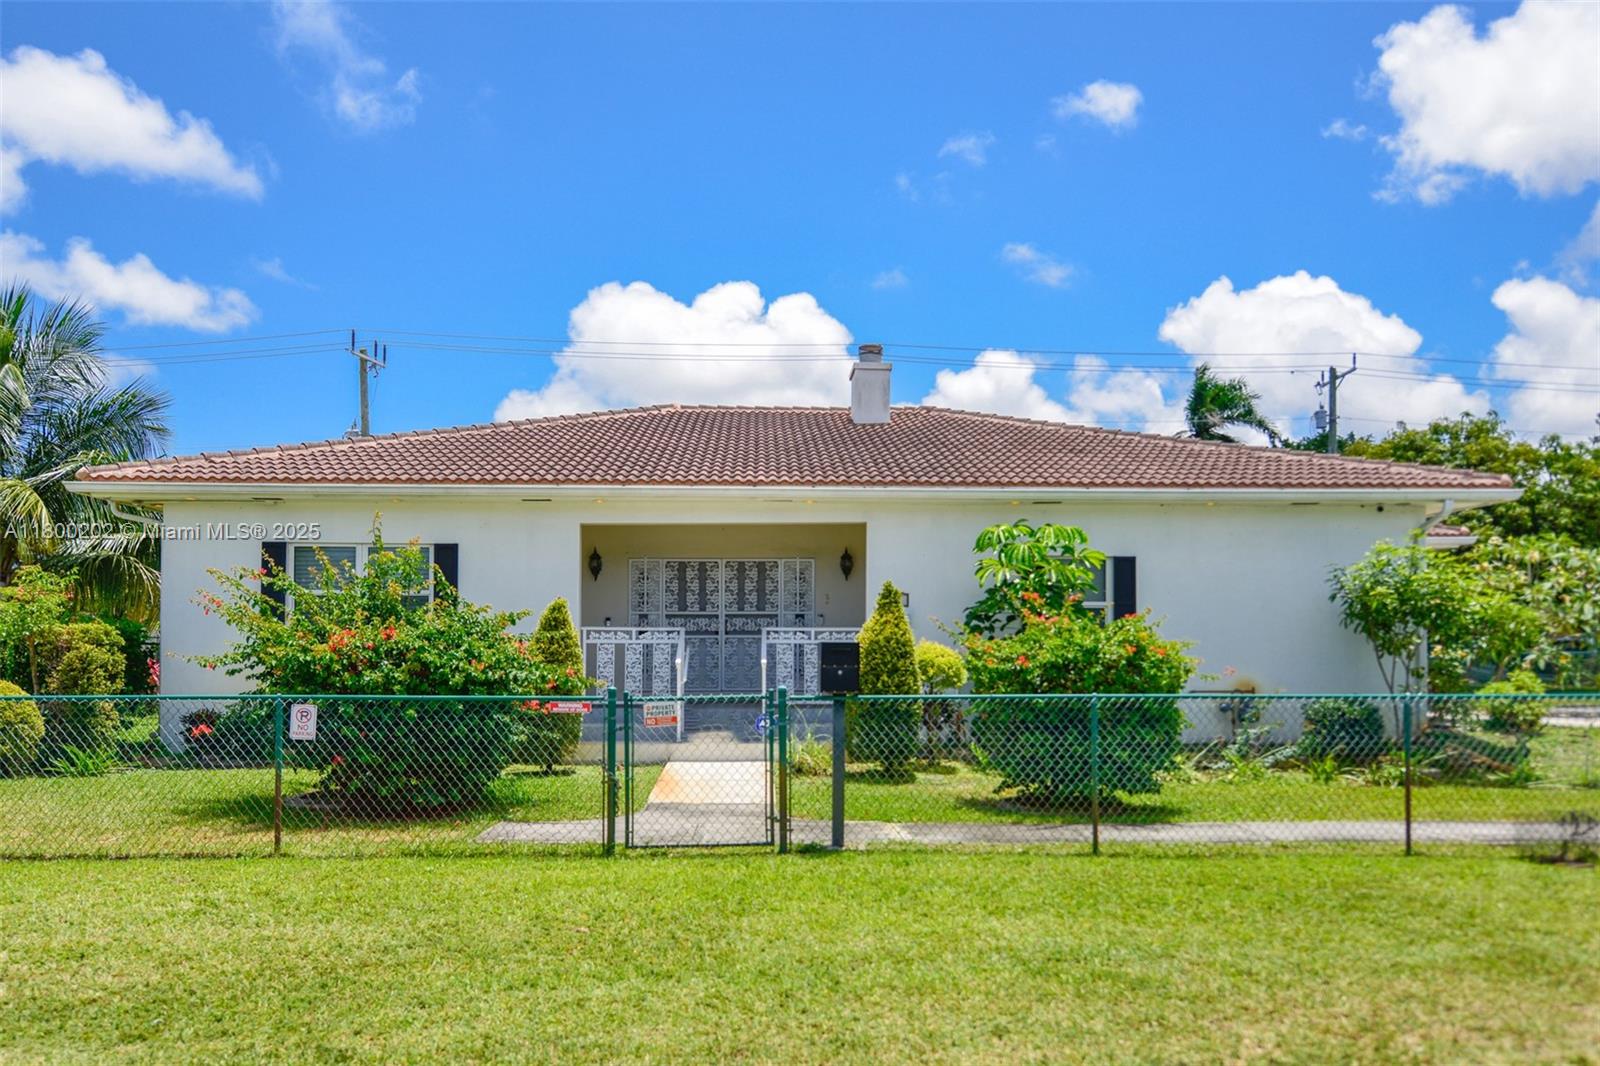
Active
$975,000
3
bds
|
3
ba
|
3,084
sqft
|
built
2012
611 SW 8th St, Hallandale Beach, FL 33009
$-2,174
Cash flow
-11.6%
Cash-on-Cash Return
3.6%
Cap rate
0.5%
Rent to Value Ratio
Active
$3,600,000
6
bds
|
5
ba
|
6,001
sqft
|
built
1959
418 Tamarind Dr, Hallandale Beach, FL 33009
$-17,731
Cash flow
-25.7%
Cash-on-Cash Return
0.4%
Cap rate
0.3%
Rent to Value Ratio
Active
$490,000
2
bds
|
1
ba
|
1,162
sqft
|
built
1962
421 SW 11th Ave, Hallandale Beach, FL 33009
$-190
Cash flow
-2.0%
Cash-on-Cash Return
5.8%
Cap rate
0.7%
Rent to Value Ratio

Active
$575,000
4
bds
|
3
ba
|
1,500
sqft
|
built
1956
722 SW 10th St, Hallandale Beach, FL 33009
$-1,248
Cash flow
-11.3%
Cash-on-Cash Return
3.7%
Cap rate
0.6%
Rent to Value Ratio
Active
$400,000
4
bds
|
2
ba
|
1,413
sqft
|
built
1990
744 NW 7th St, Hallandale Beach, FL 33009
$-197
Cash flow
-2.6%
Cash-on-Cash Return
5.7%
Cap rate
0.7%
Rent to Value Ratio
Active
$649,000
3
bds
|
2
ba
|
1,500
sqft
|
built
1971
1124 NE 3rd St, Hallandale Beach, FL 33009
$-980
Cash flow
-7.9%
Cash-on-Cash Return
4.5%
Cap rate
0.6%
Rent to Value Ratio
Pending
$639,000
2
bds
|
2
ba
|
1,676
sqft
|
built
1970
1106 NE 3rd St, Hallandale Beach, FL 33009
$-1,510
Cash flow
-12.3%
Cash-on-Cash Return
3.4%
Cap rate
0.6%
Rent to Value Ratio
Active
$974,995
5
bds
|
2
ba
|
2,147
sqft
|
built
1963
1024 NE 4th St, Hallandale Beach, FL 33009
$-1,148
Cash flow
-6.1%
Cash-on-Cash Return
4.9%
Cap rate
0.7%
Rent to Value Ratio
Active
$469,000
3
bds
|
2
ba
|
1,463
sqft
|
built
1956
720 NW 6th St, Hallandale Beach, FL 33009
$-1,267
Cash flow
-14.1%
Cash-on-Cash Return
3.0%
Cap rate
0.5%
Rent to Value Ratio
Active
$820,000
3
bds
|
3
ba
|
1,549
sqft
|
built
1987
806 NE 4th St, Hallandale Beach, FL 33009
$-2,253
Cash flow
-14.3%
Cash-on-Cash Return
3.0%
Cap rate
0.5%
Rent to Value Ratio
Active
$829,995
3
bds
|
2
ba
|
1,892
sqft
|
built
1956
1124 NE 6th St, Hallandale Beach, FL 33009
$-1,260
Cash flow
-7.9%
Cash-on-Cash Return
4.5%
Cap rate
0.7%
Rent to Value Ratio
Pending
$389,999
2
bds
|
1
ba
|
1,008
sqft
|
built
1963
616 NW 3rd Ct, Hallandale Beach, FL 33009
$-739
Cash flow
-9.9%
Cash-on-Cash Return
4.0%
Cap rate
0.7%
Rent to Value Ratio

Active
$4,499,000
5
bds
|
5
ba
|
4,083
sqft
|
built
2016
907 Diplomat Pkwy, Hallandale Beach, FL 33009
$-24,306
Cash flow
-28.2%
Cash-on-Cash Return
-0.2%
Cap rate
0.1%
Rent to Value Ratio
Active
$565,000
3
bds
|
2
ba
|
1,680
sqft
|
built
2003
101 NW 2nd Ave, Hallandale Beach, FL 33009
$-1,086
Cash flow
-10.0%
Cash-on-Cash Return
4.0%
Cap rate
0.6%
Rent to Value Ratio
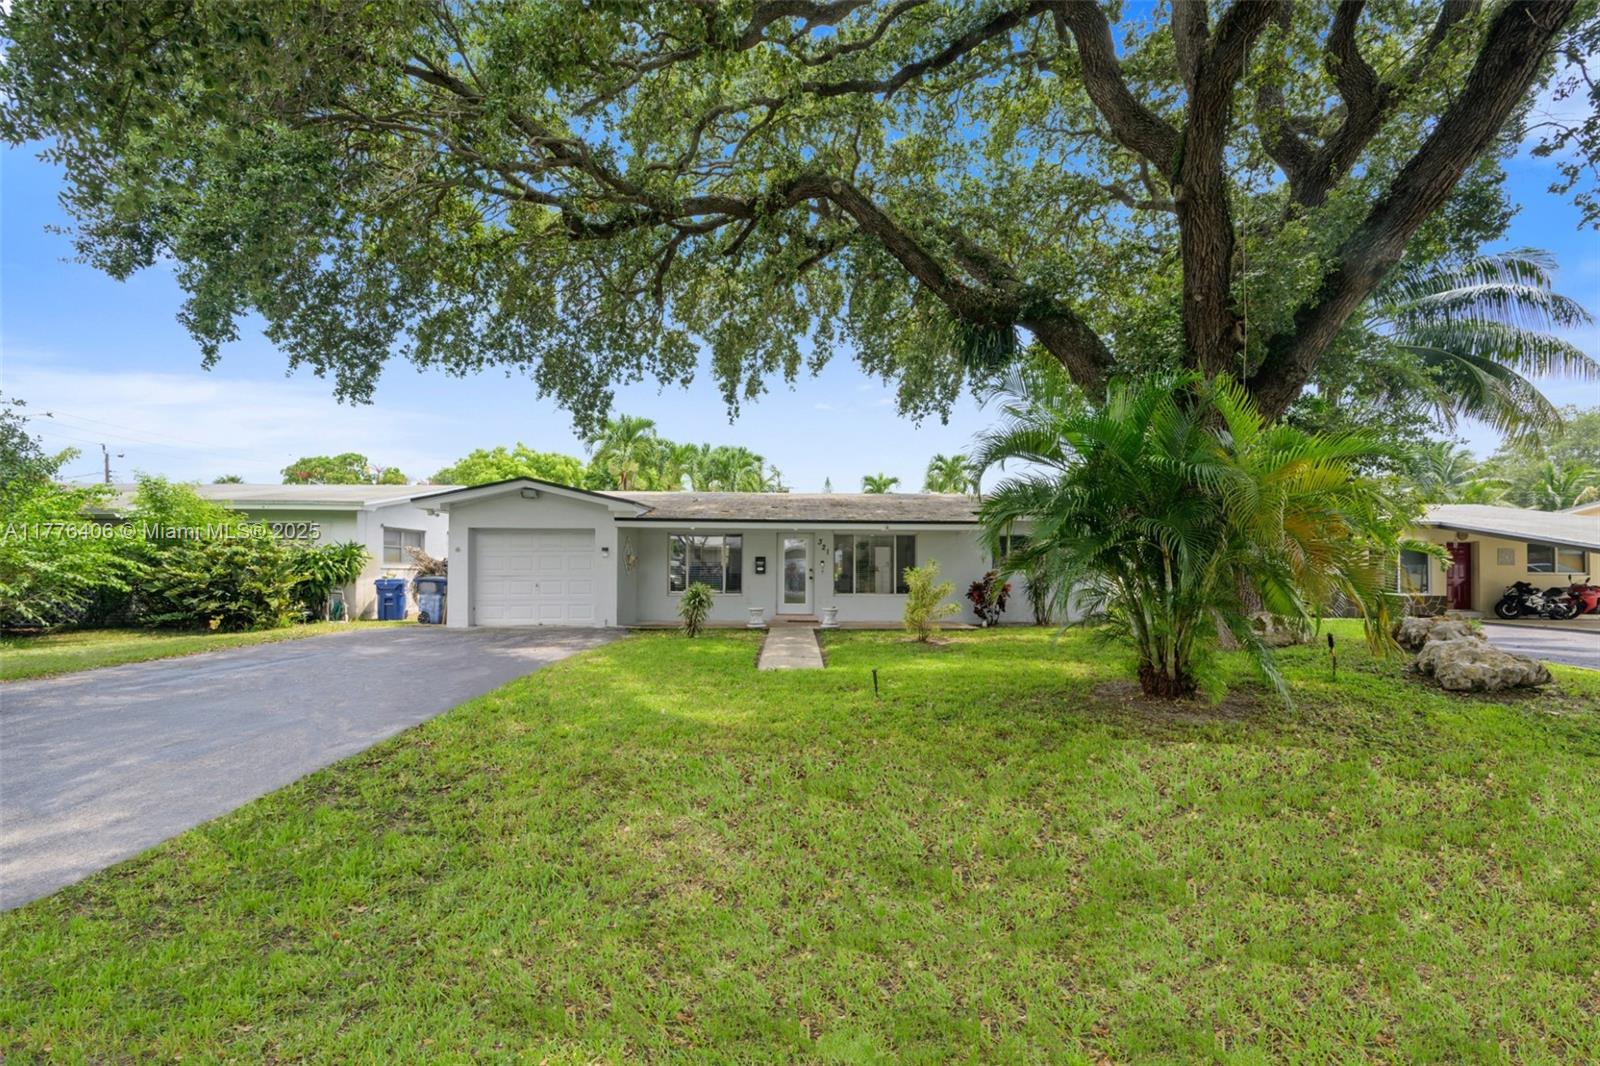
Active
$540,000
3
bds
|
2
ba
|
1,608
sqft
|
built
1963
321 SW 11th Ave, Hallandale Beach, FL 33009
$-1,309
Cash flow
-12.6%
Cash-on-Cash Return
3.4%
Cap rate
0.7%
Rent to Value Ratio
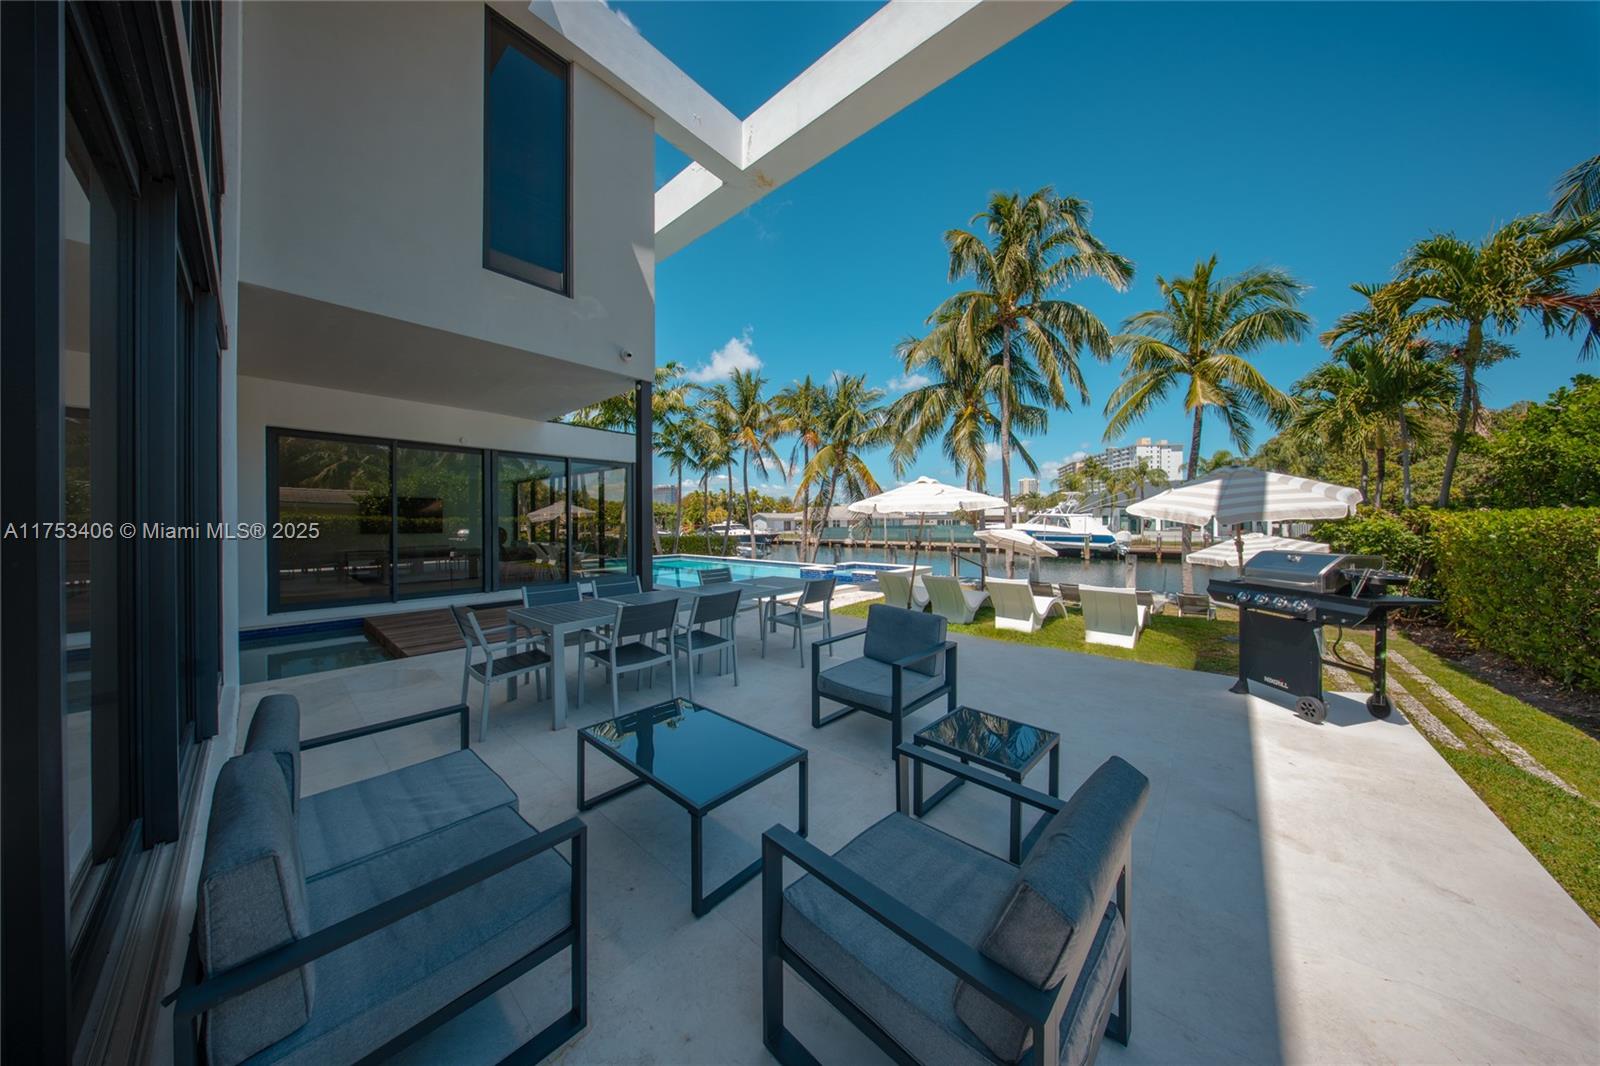
Active
$6,990,000
6
bds
|
7
ba
|
5,793
sqft
|
built
2019
418 Sunset Dr, Hallandale Beach, FL 33009
$-41,198
Cash flow
-30.8%
Cash-on-Cash Return
-0.8%
Cap rate
0.1%
Rent to Value Ratio
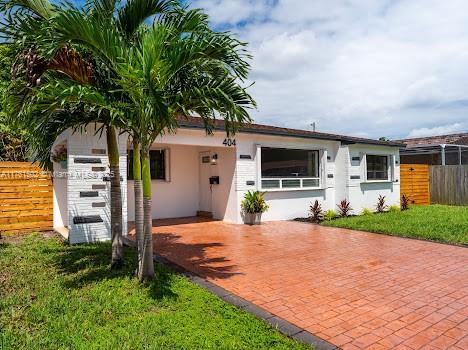
Active
$575,000
3
bds
|
2
ba
|
1,230
sqft
|
built
1958
404 SW 4th Ter, Hallandale Beach, FL 33009
$-795
Cash flow
-7.2%
Cash-on-Cash Return
4.6%
Cap rate
0.7%
Rent to Value Ratio
Active
$7,999,999
5
bds
|
5
ba
|
5,220
sqft
|
built
1975
406 Holiday Dr, Hallandale Beach, FL 33009
$-36,761
Cash flow
-24.0%
Cash-on-Cash Return
0.8%
Cap rate
0.1%
Rent to Value Ratio
Active
$544,900
3
bds
|
2
ba
|
1,008
sqft
|
built
1953
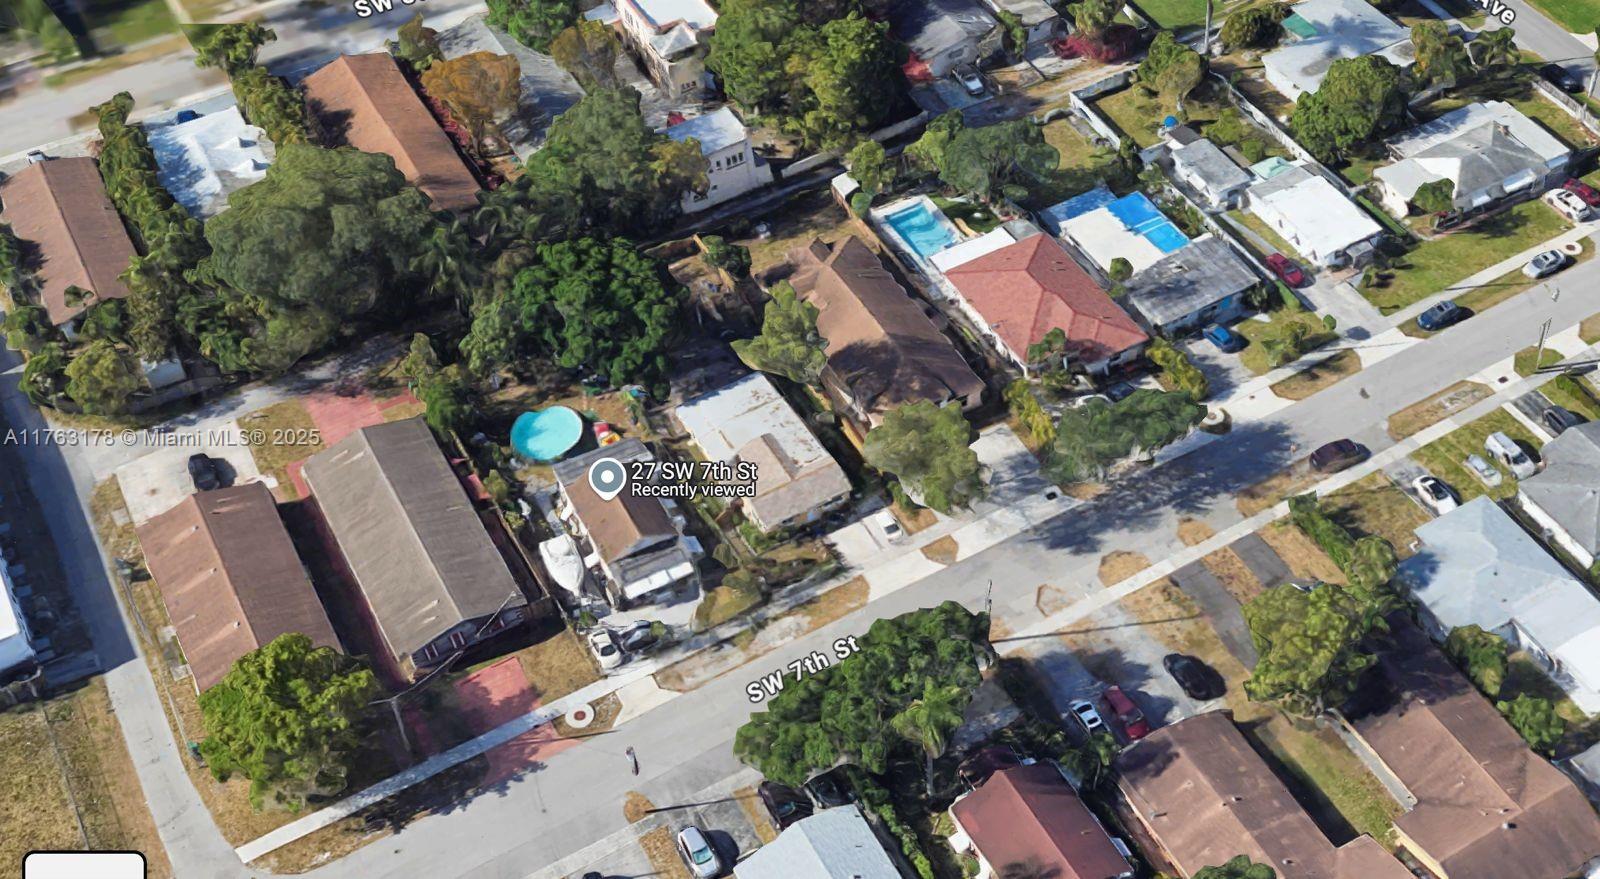
27 SW 7th St, Hallandale Beach, FL 33009
$-1,356
Cash flow
-13.0%
Cash-on-Cash Return
3.3%
Cap rate
0.5%
Rent to Value Ratio
Active
$4,250,000
5
bds
|
6
ba
|
4,126
sqft
|
built
1978
449 Holiday Dr, Hallandale Beach, FL 33009
$-19,925
Cash flow
-24.5%
Cash-on-Cash Return
0.7%
Cap rate
0.3%
Rent to Value Ratio
Active
$875,000
5
bds
|
4
ba
|
1,912
sqft
|
built
2020
814 NE 4th St, Hallandale Beach, FL 33009
$-2,481
Cash flow
-14.8%
Cash-on-Cash Return
2.9%
Cap rate
0.5%
Rent to Value Ratio
Active
$650,000
3
bds
|
1
ba
|
1,190
sqft
|
built
1956
819 NE 2nd Ct, Hallandale Beach, FL 33009
$-1,463
Cash flow
-11.7%
Cash-on-Cash Return
3.6%
Cap rate
0.5%
Rent to Value Ratio

Active
$550,000
3
bds
|
2
ba
|
1,152
sqft
|
built
1953
30 SW 7th St, Hallandale Beach, FL 33009
$-1,521
Cash flow
-14.4%
Cash-on-Cash Return
3.0%
Cap rate
0.5%
Rent to Value Ratio
Active
$855,000
5
bds
|
3
ba
|
2,639
sqft
|
built
1965
700 NW 9th Ct, Hallandale Beach, FL 33009
$-1,032
Cash flow
-6.3%
Cash-on-Cash Return
4.8%
Cap rate
0.7%
Rent to Value Ratio

Active
$875,000
3
bds
|
2
ba
|
1,395
sqft
|
built
1954
110 SW 5th St, Hallandale Beach, FL 33009
$-2,076
Cash flow
-12.4%
Cash-on-Cash Return
3.4%
Cap rate
0.6%
Rent to Value Ratio
Active
$499,770
2
bds
|
2
ba
|
1,247
sqft
|
built
1960
731 SW 3rd Ave, Hallandale Beach, FL 33009
$-1,074
Cash flow
-11.2%
Cash-on-Cash Return
3.7%
Cap rate
0.6%
Rent to Value Ratio

Active
$550,000
2
bds
|
1
ba
|
840
sqft
|
built
1964
713 SW 6th Ave, Hallandale Beach, FL 33009
$-553
Cash flow
-5.2%
Cash-on-Cash Return
5.1%
Cap rate
0.6%
Rent to Value Ratio

Active
$9,850,000
7
bds
|
8
ba
|
6,230
sqft
|
built
2023
478 Tamarind Dr, Hallandale Beach, FL 33009
$-56,544
Cash flow
-30.0%
Cash-on-Cash Return
-0.6%
Cap rate
0.1%
Rent to Value Ratio

Active
$475,000
3
bds
|
2
ba
|
1,464
sqft
|
built
1993
809 SW 10th St, Hallandale Beach, FL 33009
$-1,149
Cash flow
-12.6%
Cash-on-Cash Return
3.4%
Cap rate
0.7%
Rent to Value Ratio

Active
$749,000
3
bds
|
2
ba
|
1,143
sqft
|
built
2013
900 NE 6th St, Hallandale Beach, FL 33009
$-1,802
Cash flow
-12.6%
Cash-on-Cash Return
3.4%
Cap rate
0.5%
Rent to Value Ratio