Hallandale Beach, FL Investment Properties for Sale
Browse homes for sale and investment properties in Hallandale Beach, FL. Refine your search by price, property type, or more.
Best cash flowing properties in Hallandale Beach, FL
Active
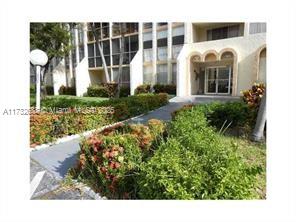
$240,000
2
bds
|
2
ba
|
1,265
sqft
|
built
1972
427 Golden Isles Dr, Hallandale Beach, FL 33009
$450
Cash flow
9.8%
Cash-on-Cash Return
8.4%
Cap rate
1.2%
Rent to Value Ratio
Active
$249,000
2
bds
|
2
ba
|
921
sqft
|
built
1967
1333 E Hallandale Beach Blvd, Hallandale Beach, FL 33009
$-287
Cash flow
-6.0%
Cash-on-Cash Return
4.8%
Cap rate
1.0%
Rent to Value Ratio
833 out of 931 properties for sale in Hallandale Beach, FL
Limited Results Shown
Create a free account, or log in to reveal all property listings and enjoy the complete experience.
Active
$1,499,000
2
bds
|
2
ba
|
1,782
sqft
|
built
2006
1800 S Ocean Dr, Hallandale Beach, FL 33009
$-5,365
Cash flow
-18.7%
Cash-on-Cash Return
1.9%
Cap rate
0.5%
Rent to Value Ratio
Active
$268,000
1
bds
|
2
ba
|
1,300
sqft
|
built
1974
1865 S Ocean Dr, Hallandale Beach, FL 33009
$-880
Cash flow
-17.1%
Cash-on-Cash Return
2.2%
Cap rate
1.0%
Rent to Value Ratio

Active
$288,000
2
bds
|
2
ba
|
1,500
sqft
|
built
1974
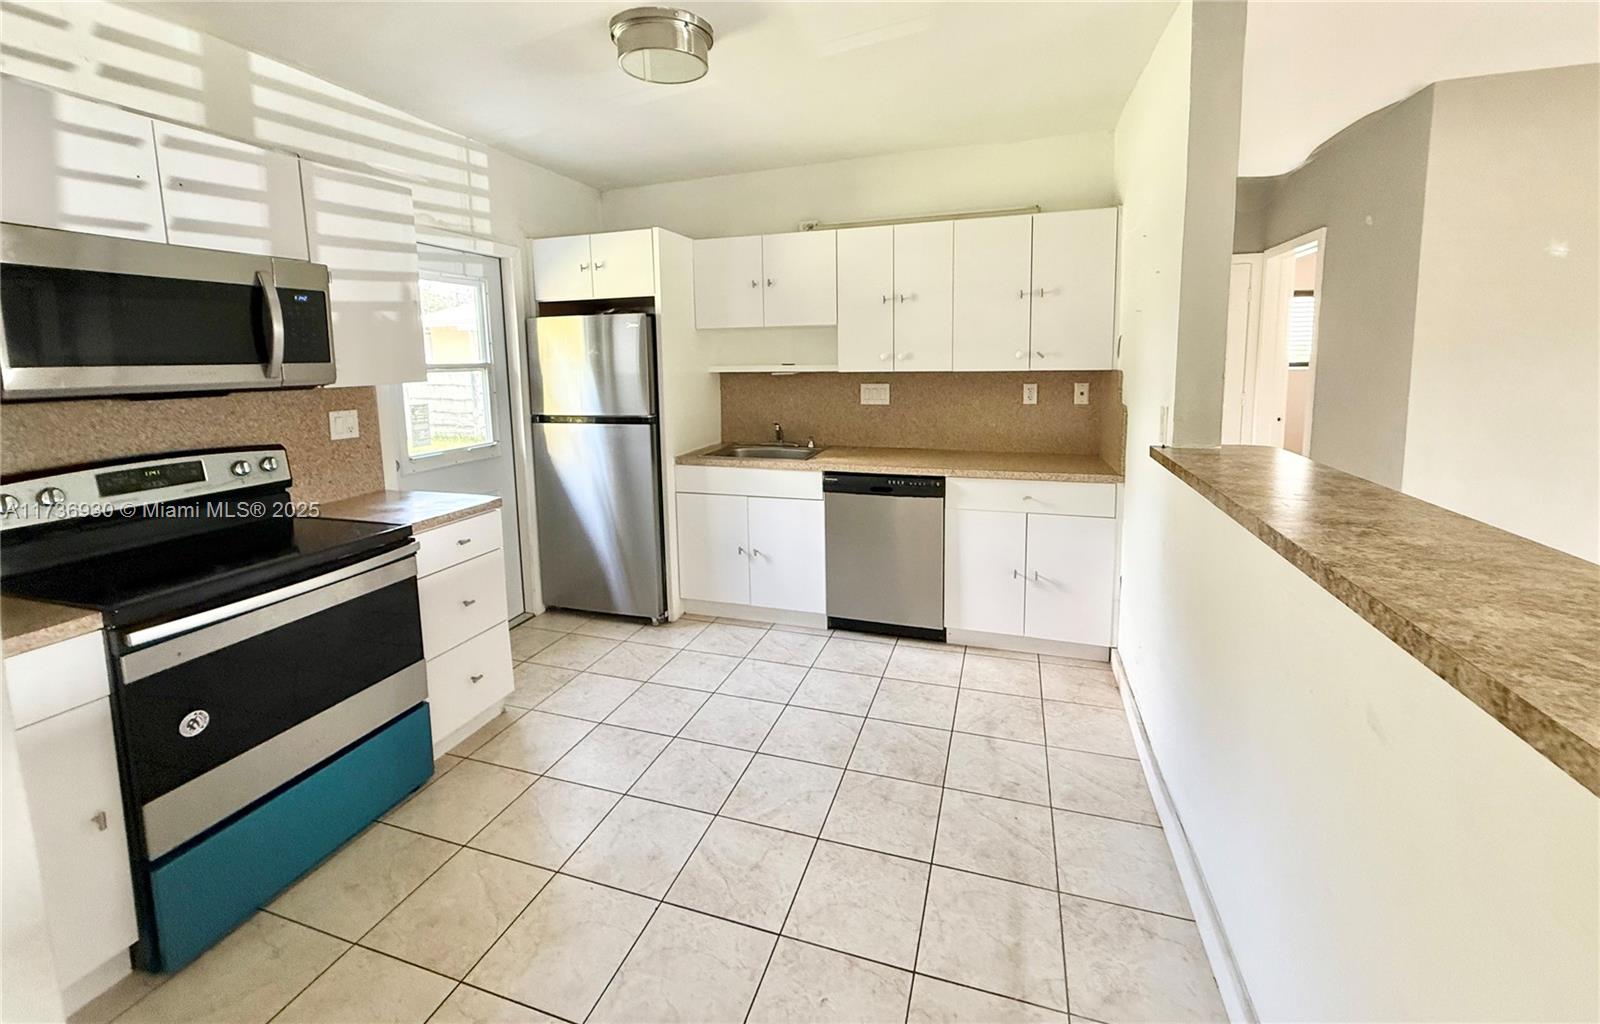
500 Three Islands Blvd, Hallandale Beach, FL 33009
$-1,644
Cash flow
-29.8%
Cash-on-Cash Return
-0.7%
Cap rate
1.0%
Rent to Value Ratio

Active
$749,000
3
bds
|
2
ba
|
1,143
sqft
|
built
2013
900 NE 6th St, Hallandale Beach, FL 33009
$-1,717
Cash flow
-12.0%
Cash-on-Cash Return
3.4%
Cap rate
0.5%
Rent to Value Ratio

Active under contract
$300,000
2
bds
|
2
ba
|
1,130
sqft
|
built
1976
800 Parkview Dr, Hallandale Beach, FL 33009
$-856
Cash flow
-14.9%
Cash-on-Cash Return
2.7%
Cap rate
1.0%
Rent to Value Ratio
Active
$319,850
2
bds
|
2
ba
|
1,280
sqft
|
built
1980
2500 Parkview Dr, Hallandale Beach, FL 33009
$-1,315
Cash flow
-21.5%
Cash-on-Cash Return
1.2%
Cap rate
0.9%
Rent to Value Ratio
Active
$209,000
1
bds
|
1
ba
|
545
sqft
|
built
1970
1965 S Ocean Dr, Hallandale Beach, FL 33009
$-755
Cash flow
-18.8%
Cash-on-Cash Return
1.8%
Cap rate
0.9%
Rent to Value Ratio

Active
$774,900
4
bds
|
3
ba
|
1,608
sqft
|
built
1968
1017 NE 3rd St, Hallandale Beach, FL 33009
$-970
Cash flow
-6.5%
Cash-on-Cash Return
4.6%
Cap rate
0.7%
Rent to Value Ratio
Active
$3,200,000
5
bds
|
4
ba
|
4,838
sqft
|
built
1980
913 Diplomat Pkwy, Hallandale Beach, FL 33009
$-10,180
Cash flow
-16.6%
Cash-on-Cash Return
2.3%
Cap rate
0.3%
Rent to Value Ratio

Active
$475,000
2
bds
|
2
ba
|
1,165
sqft
|
built
1972
3180 S Ocean Dr, Hallandale Beach, FL 33009
$-1,383
Cash flow
-15.2%
Cash-on-Cash Return
2.7%
Cap rate
0.5%
Rent to Value Ratio
Active
$268,000
1
bds
|
2
ba
|
950
sqft
|
built
1980
2500 Parkview Dr, Hallandale Beach, FL 33009
$-1,189
Cash flow
-23.1%
Cash-on-Cash Return
0.8%
Cap rate
0.9%
Rent to Value Ratio

Active
$715,000
1
bds
|
1
ba
|
844
sqft
|
built
2006
1830 S Ocean Dr, Hallandale Beach, FL 33009
$-2,845
Cash flow
-20.8%
Cash-on-Cash Return
1.4%
Cap rate
0.6%
Rent to Value Ratio
Active
$219,000
1
bds
|
1
ba
|
875
sqft
|
built
1976
1000 Parkview Dr, Hallandale Beach, FL 33009
$-502
Cash flow
-12.0%
Cash-on-Cash Return
3.4%
Cap rate
1.1%
Rent to Value Ratio
Active
$405,000
2
bds
|
2
ba
|
1,430
sqft
|
built
1979
600 Parkview Dr, Hallandale Beach, FL 33009
$-1,447
Cash flow
-18.6%
Cash-on-Cash Return
1.9%
Cap rate
0.8%
Rent to Value Ratio
Active
$240,000
2
bds
|
2
ba
|
1,265
sqft
|
built
1972
427 Golden Isles Dr, Hallandale Beach, FL 33009
$450
Cash flow
9.8%
Cash-on-Cash Return
8.4%
Cap rate
1.2%
Rent to Value Ratio
Active
$815,000
bds
|
0
ba
|
2,102
sqft
|
built
2007
128 NW 6th Ave, Hallandale Beach, FL 33009
$-2,770
Cash flow
-17.7%
Cash-on-Cash Return
2.1%
Cap rate
0.3%
Rent to Value Ratio
Active
$240,000
2
bds
|
2
ba
|
1,265
sqft
|
built
1972
427 Golden Isles Dr, Hallandale Beach, FL 33009
$-988
Cash flow
-21.5%
Cash-on-Cash Return
1.2%
Cap rate
1.0%
Rent to Value Ratio
Pending
$160,000
1
bds
|
1
ba
|
720
sqft
|
built
1965
700 Layne Blvd, Hallandale Beach, FL 33009
$-618
Cash flow
-20.2%
Cash-on-Cash Return
1.5%
Cap rate
1.1%
Rent to Value Ratio
Active
$268,900
1
bds
|
2
ba
|
1,075
sqft
|
built
1976
1000 Parkview Dr, Hallandale Beach, FL 33009
$-1,121
Cash flow
-21.8%
Cash-on-Cash Return
1.1%
Cap rate
0.8%
Rent to Value Ratio
Active
$199,000
1
bds
|
2
ba
|
850
sqft
|
built
1970
200 Diplomat Pkwy, Hallandale Beach, FL 33009
$-880
Cash flow
-23.1%
Cash-on-Cash Return
0.8%
Cap rate
1.0%
Rent to Value Ratio
Active
$260,000
1
bds
|
2
ba
|
850
sqft
|
built
1970
200 Diplomat Pkwy, Hallandale Beach, FL 33009
$-948
Cash flow
-19.0%
Cash-on-Cash Return
1.8%
Cap rate
0.9%
Rent to Value Ratio
Active
$249,000
2
bds
|
2
ba
|
921
sqft
|
built
1967
1333 E Hallandale Beach Blvd, Hallandale Beach, FL 33009
$-287
Cash flow
-6.0%
Cash-on-Cash Return
4.8%
Cap rate
1.0%
Rent to Value Ratio
Active
$575,000
3
bds
|
2
ba
|
1,348
sqft
|
built
1972
903 NE 2nd St, Hallandale Beach, FL 33009
$-1,221
Cash flow
-11.1%
Cash-on-Cash Return
3.6%
Cap rate
0.6%
Rent to Value Ratio
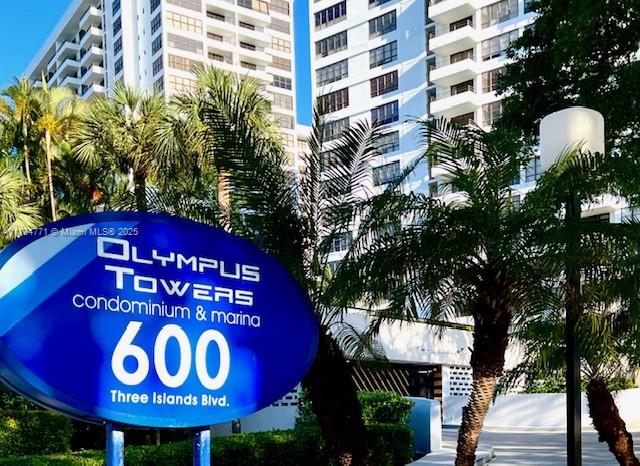
Active
$295,000
2
bds
|
2
ba
|
1,400
sqft
|
built
1975
600 Three Islands Blvd, Hallandale Beach, FL 33009
$-1,017
Cash flow
-18.0%
Cash-on-Cash Return
2.0%
Cap rate
0.9%
Rent to Value Ratio
Active
$329,000
1
bds
|
1
ba
|
798
sqft
|
built
1970
1965 S Ocean Dr, Hallandale Beach, FL 33009
$-1,175
Cash flow
-18.6%
Cash-on-Cash Return
1.9%
Cap rate
0.8%
Rent to Value Ratio
Active
$445,000
2
bds
|
2
ba
|
1,455
sqft
|
built
1981
200 Leslie Dr, Hallandale Beach, FL 33009
$-1,857
Cash flow
-21.8%
Cash-on-Cash Return
1.1%
Cap rate
0.8%
Rent to Value Ratio
Active
$249,500
2
bds
|
2
ba
|
1,092
sqft
|
built
1970
319 NE 14th Ave, Hallandale Beach, FL 33009
$-759
Cash flow
-15.9%
Cash-on-Cash Return
2.5%
Cap rate
0.9%
Rent to Value Ratio
Active
$1,050,000
2
bds
|
3
ba
|
1,856
sqft
|
built
1970
2030 S Ocean Dr, Hallandale Beach, FL 33009
$-4,332
Cash flow
-21.5%
Cash-on-Cash Return
1.2%
Cap rate
0.5%
Rent to Value Ratio
Active
$1,120,000
3
bds
|
2
ba
|
1,480
sqft
|
built
2002
2080 S Ocean Dr, Hallandale Beach, FL 33009
$-3,810
Cash flow
-17.7%
Cash-on-Cash Return
2.1%
Cap rate
0.6%
Rent to Value Ratio
Active
$700,000
2
bds
|
2
ba
|
1,000
sqft
|
built
2002
2080 S Ocean Dr, Hallandale Beach, FL 33009
$-2,842
Cash flow
-21.2%
Cash-on-Cash Return
1.3%
Cap rate
0.6%
Rent to Value Ratio

Active
$177,000
1
bds
|
1
ba
|
320
sqft
|
built
1960
26 Diplomat Pkwy, Hallandale Beach, FL 33009
$-385
Cash flow
-11.3%
Cash-on-Cash Return
3.5%
Cap rate
0.9%
Rent to Value Ratio

Active
$359,000
2
bds
|
2
ba
|
1,400
sqft
|
built
1975
600 Three Islands Blvd, Hallandale Beach, FL 33009
$-1,983
Cash flow
-28.8%
Cash-on-Cash Return
-0.5%
Cap rate
0.6%
Rent to Value Ratio
Active
$350,000
2
bds
|
2
ba
|
1,149
sqft
|
built
1970
437 Golden Isles Dr, Hallandale Beach, FL 33009
$-741
Cash flow
-11.0%
Cash-on-Cash Return
3.6%
Cap rate
0.8%
Rent to Value Ratio
Active
$499,999
2
bds
|
2
ba
|
1,440
sqft
|
built
1974
1880 S Ocean Dr, Hallandale Beach, FL 33009
$-2,758
Cash flow
-28.8%
Cash-on-Cash Return
-0.5%
Cap rate
0.6%
Rent to Value Ratio
Active
$398,000
2
bds
|
2
ba
|
1,430
sqft
|
built
1976
1000 Parkview Dr, Hallandale Beach, FL 33009
$-1,368
Cash flow
-17.9%
Cash-on-Cash Return
2.0%
Cap rate
0.9%
Rent to Value Ratio
Active
$270,000
1
bds
|
2
ba
|
950
sqft
|
built
1980
2500 Parkview Dr, Hallandale Beach, FL 33009
$-1,076
Cash flow
-20.8%
Cash-on-Cash Return
1.4%
Cap rate
0.7%
Rent to Value Ratio

Active
$449,900
2
bds
|
2
ba
|
1,553
sqft
|
built
1984
300 Three Islands Blvd, Hallandale Beach, FL 33009
$-558
Cash flow
-6.5%
Cash-on-Cash Return
4.7%
Cap rate
0.7%
Rent to Value Ratio

Active
$389,000
1
bds
|
2
ba
|
960
sqft
|
built
1974
1880 S Ocean Dr, Hallandale Beach, FL 33009
$-1,583
Cash flow
-21.2%
Cash-on-Cash Return
1.3%
Cap rate
0.7%
Rent to Value Ratio
Active
$239,900
1
bds
|
2
ba
|
924
sqft
|
built
1975
801 Three Islands Blvd, Hallandale Beach, FL 33009
$-824
Cash flow
-17.9%
Cash-on-Cash Return
2.0%
Cap rate
0.8%
Rent to Value Ratio
Active
$230,000
1
bds
|
1
ba
|
730
sqft
|
built
1986
450 Golden Isles Dr, Hallandale Beach, FL 33009
$-922
Cash flow
-20.9%
Cash-on-Cash Return
1.3%
Cap rate
0.8%
Rent to Value Ratio