Hallandale Beach, FL Investment Properties for Sale
Browse homes for sale and investment properties in Hallandale Beach, FL. Refine your search by price, property type, or more.
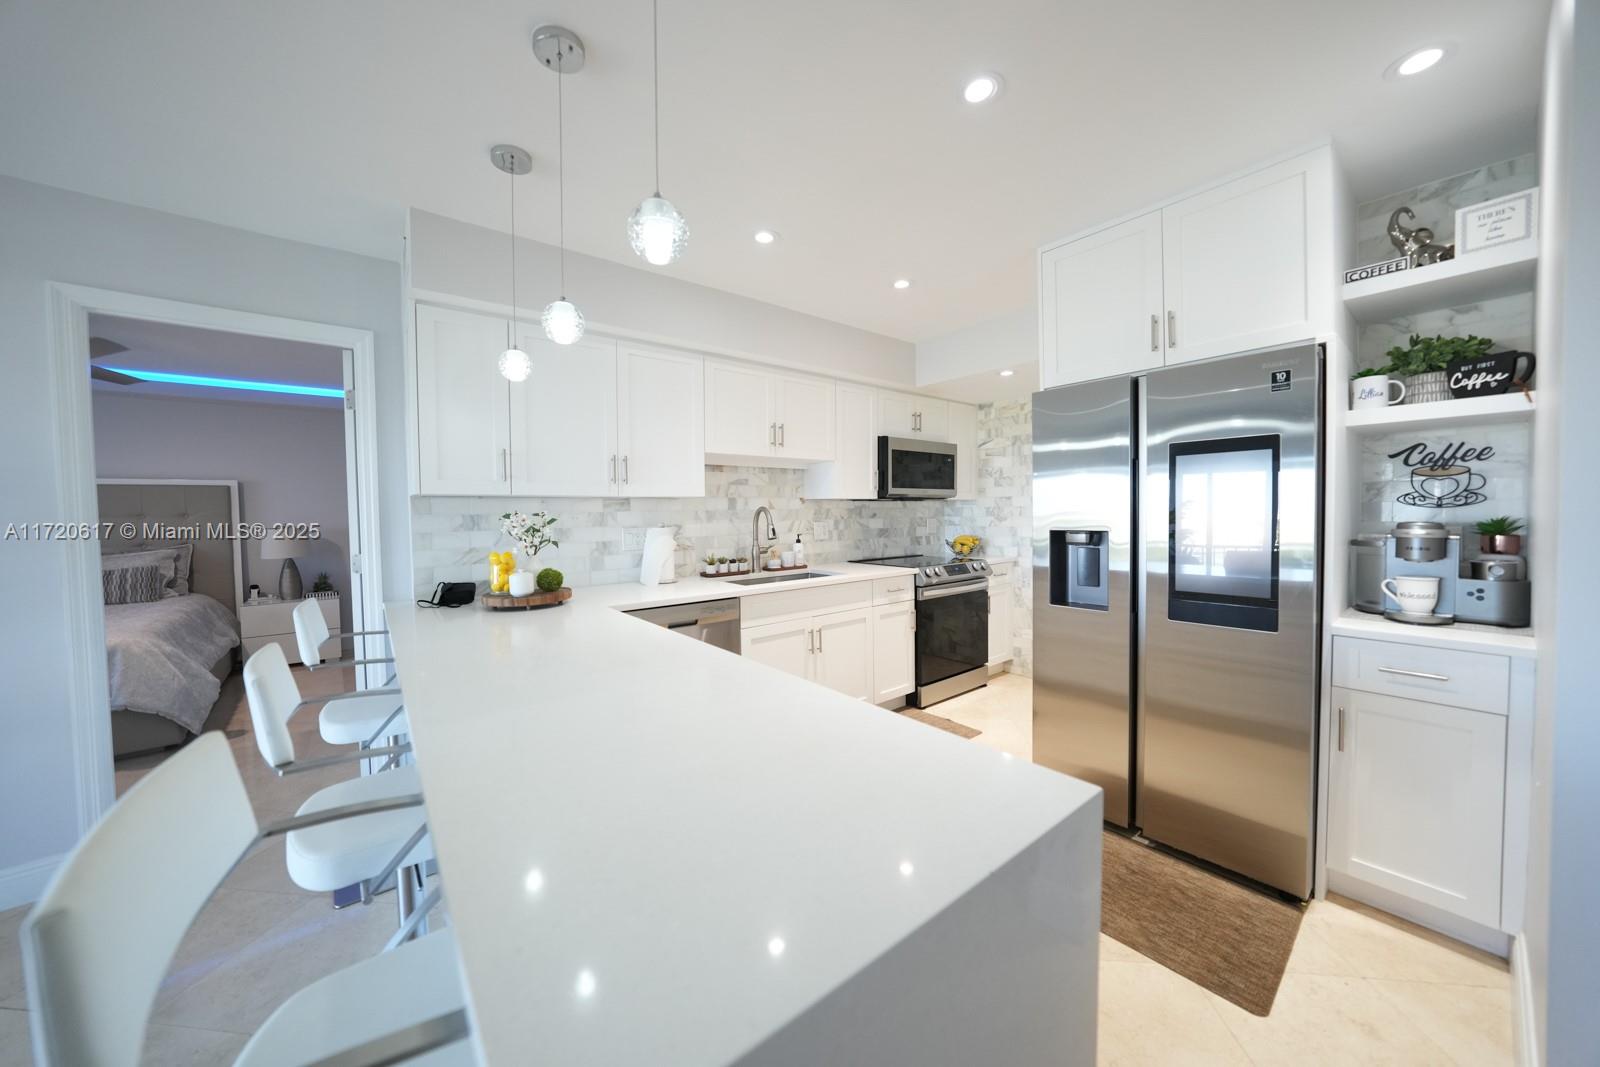
Best cash flowing properties in Hallandale Beach, FL
Active
$259,000
1
bds
|
2
ba
|
1,000
sqft
|
built
1975
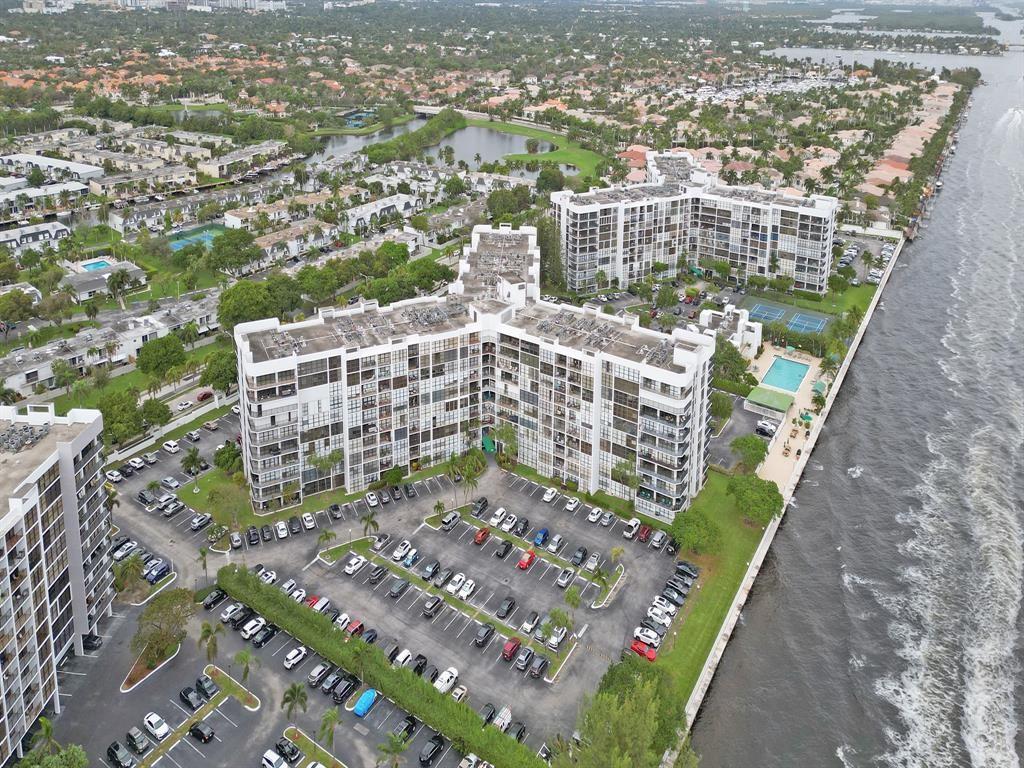
600 Three Islands Blvd, Hallandale Beach, FL 33009
$49
Cash flow
1.0%
Cash-on-Cash Return
6.4%
Cap rate
1.0%
Rent to Value Ratio
Active
$199,000
1
bds
|
2
ba
|
1,075
sqft
|
built
1979
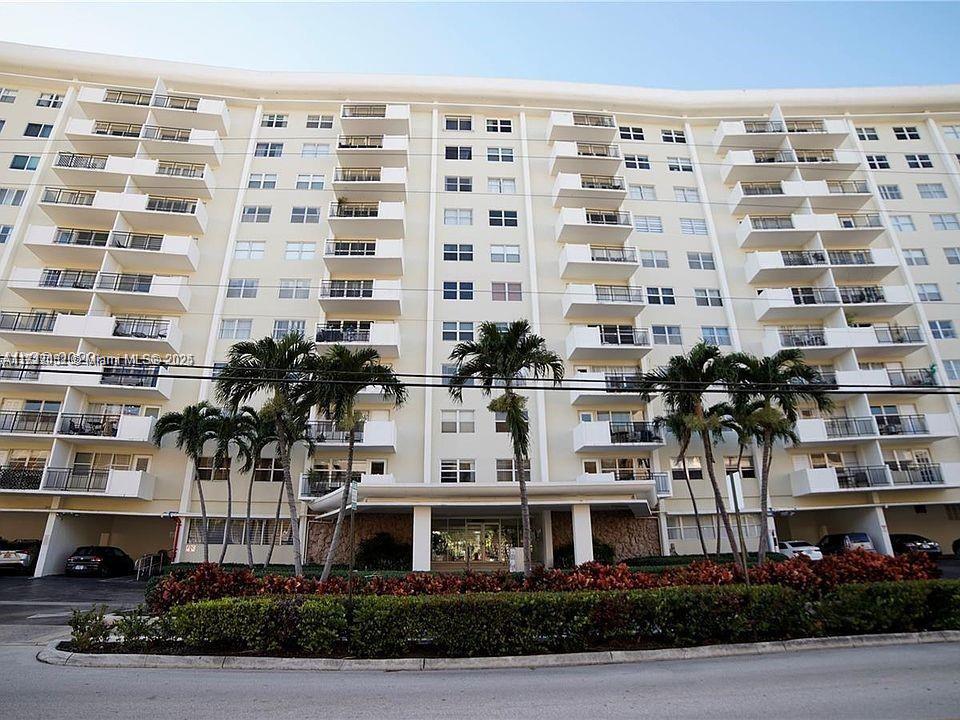
600 Parkview Dr, Hallandale Beach, FL 33009
$-348
Cash flow
-9.1%
Cash-on-Cash Return
4.0%
Cap rate
1.3%
Rent to Value Ratio
833 out of 931 properties for sale in Hallandale Beach, FL
Limited Results Shown
Create a free account, or log in to reveal all property listings and enjoy the complete experience.
Active
$199,000
1
bds
|
2
ba
|
1,075
sqft
|
built
1979
600 Parkview Dr, Hallandale Beach, FL 33009
$-348
Cash flow
-9.1%
Cash-on-Cash Return
4.0%
Cap rate
1.3%
Rent to Value Ratio
Active
$499,000
2
bds
|
2
ba
|
1,312
sqft
|
built
1970
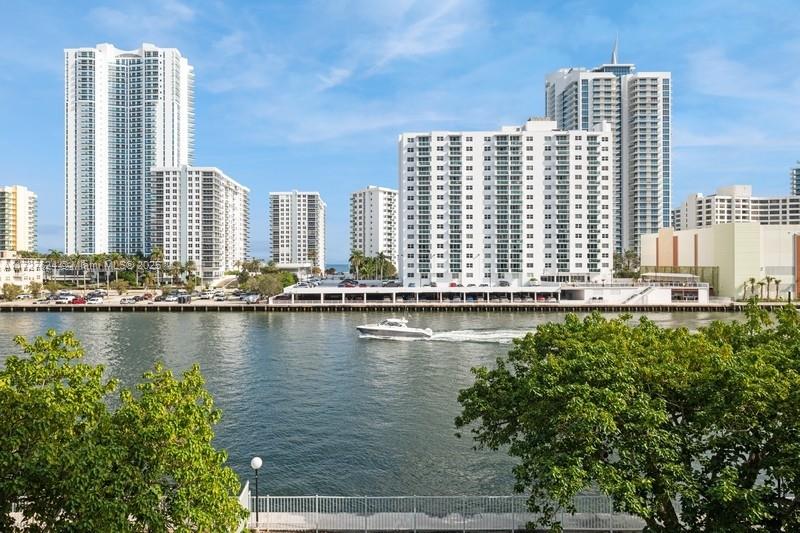
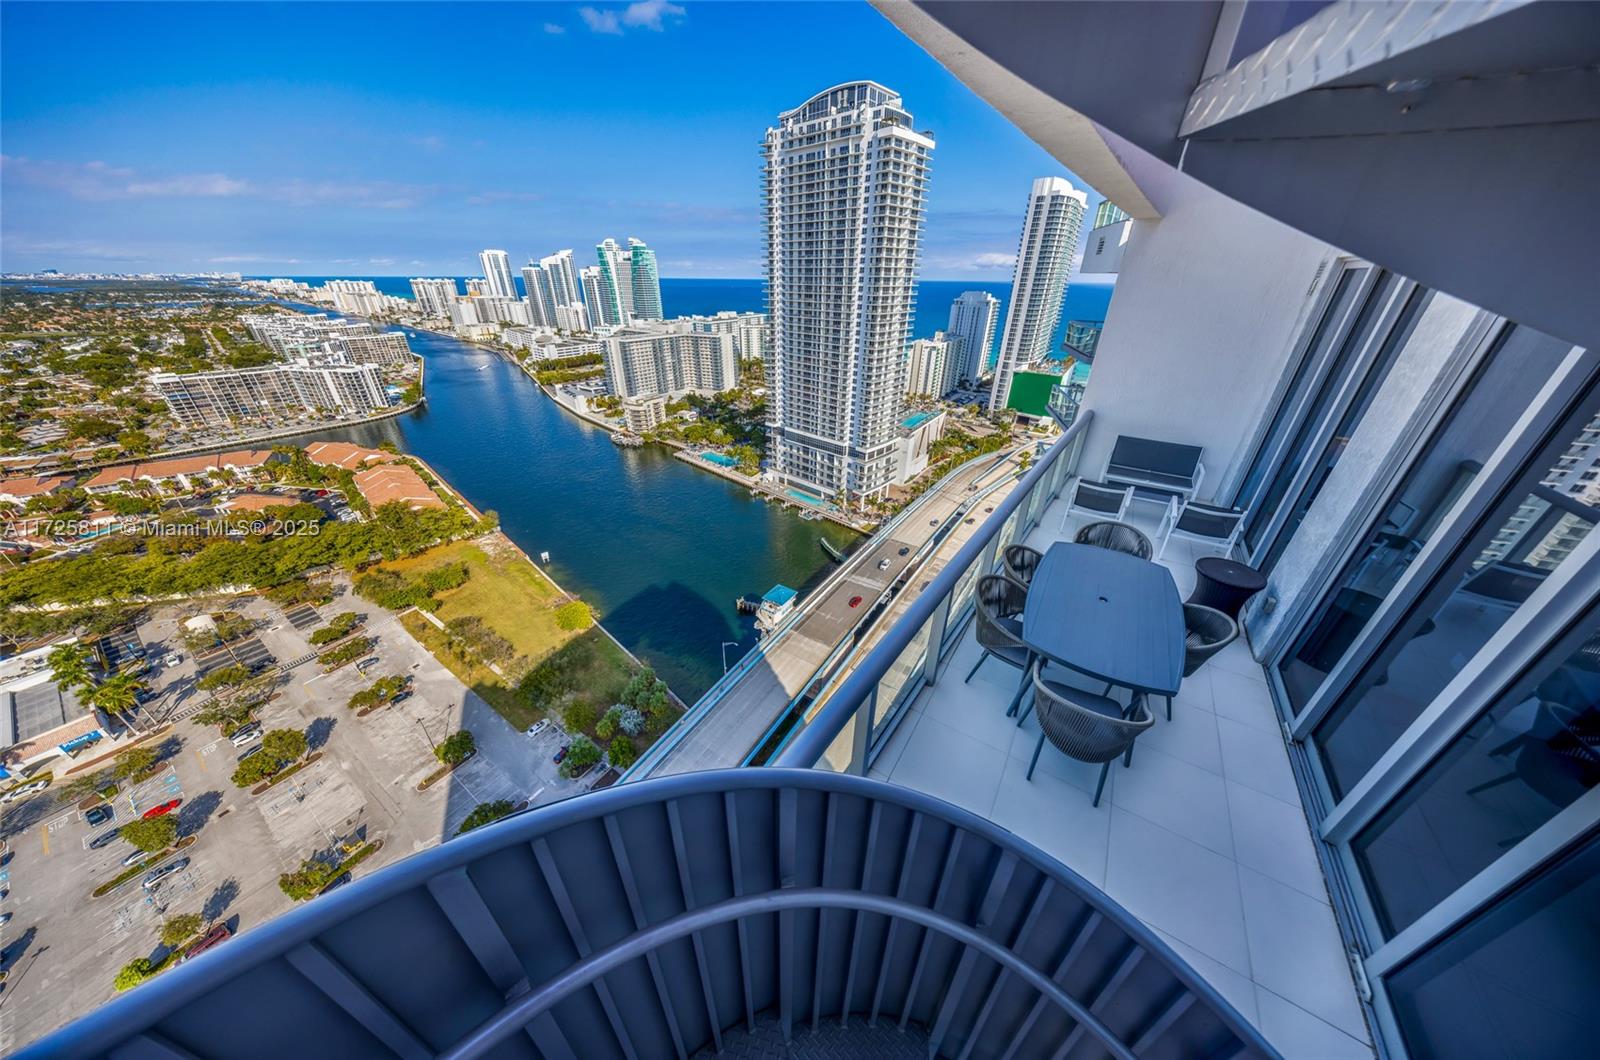
2030 S Ocean Dr, Hallandale Beach, FL 33009
$-718
Cash flow
-7.5%
Cash-on-Cash Return
4.4%
Cap rate
0.7%
Rent to Value Ratio
Active
$235,000
1
bds
|
2
ba
|
850
sqft
|
built
1970
200 Diplomat Pkwy, Hallandale Beach, FL 33009
$-884
Cash flow
-19.6%
Cash-on-Cash Return
1.6%
Cap rate
1.0%
Rent to Value Ratio
Active
$599,000
bds
|
0
ba
|
1,600
sqft
|
built
1962
409 SW 4th Ter, Hallandale Beach, FL 33009
$-2,505
Cash flow
-21.8%
Cash-on-Cash Return
1.1%
Cap rate
0.3%
Rent to Value Ratio

Active
$640,000
2
bds
|
2
ba
|
1,165
sqft
|
built
1972
3180 S Ocean Dr, Hallandale Beach, FL 33009
$-2,287
Cash flow
-18.6%
Cash-on-Cash Return
1.9%
Cap rate
0.8%
Rent to Value Ratio

Active
$224,999
2
bds
|
2
ba
|
965
sqft
|
built
1980
250 Layne Blvd, Hallandale Beach, FL 33009
$-682
Cash flow
-15.8%
Cash-on-Cash Return
2.5%
Cap rate
1.0%
Rent to Value Ratio
Active
$575,000
2
bds
|
2
ba
|
1,380
sqft
|
built
1971
1980 S Ocean Dr, Hallandale Beach, FL 33009
$-2,296
Cash flow
-20.8%
Cash-on-Cash Return
1.4%
Cap rate
0.7%
Rent to Value Ratio
Active
$340,000
2
bds
|
2
ba
|
1,400
sqft
|
built
1974
500 Three Islands Blvd, Hallandale Beach, FL 33009
$-1,216
Cash flow
-18.7%
Cash-on-Cash Return
1.9%
Cap rate
0.9%
Rent to Value Ratio

Active
$440,000
2
bds
|
2
ba
|
1,081
sqft
|
built
2007
1755 E Hallandale Beach Blvd, Hallandale Beach, FL 33009
$-670
Cash flow
-7.9%
Cash-on-Cash Return
4.3%
Cap rate
0.7%
Rent to Value Ratio
Active
$265,000
2
bds
|
2
ba
|
1,075
sqft
|
built
1976
1000 Parkview Dr, Hallandale Beach, FL 33009
$-1,075
Cash flow
-21.2%
Cash-on-Cash Return
1.3%
Cap rate
0.9%
Rent to Value Ratio

Active
$219,900
2
bds
|
2
ba
|
965
sqft
|
built
1980
250 Layne Blvd, Hallandale Beach, FL 33009
$-589
Cash flow
-14.0%
Cash-on-Cash Return
2.9%
Cap rate
1.0%
Rent to Value Ratio
Active
$475,000
2
bds
|
2
ba
|
1,430
sqft
|
built
1976
800 Parkview Dr, Hallandale Beach, FL 33009
$-1,637
Cash flow
-18.0%
Cash-on-Cash Return
2.0%
Cap rate
0.8%
Rent to Value Ratio

Active
$294,000
2
bds
|
2
ba
|
1,000
sqft
|
built
1968
430 Golden Isles Dr, Hallandale Beach, FL 33009
$-952
Cash flow
-16.9%
Cash-on-Cash Return
2.3%
Cap rate
0.9%
Rent to Value Ratio
Active
$274,900
1
bds
|
2
ba
|
1,075
sqft
|
built
1976
800 Parkview Dr, Hallandale Beach, FL 33009
$-1,220
Cash flow
-23.2%
Cash-on-Cash Return
0.8%
Cap rate
0.8%
Rent to Value Ratio

Active
$289,000
2
bds
|
2
ba
|
1,092
sqft
|
built
1972
501 NE 14th Ave, Hallandale Beach, FL 33009
$-600
Cash flow
-10.8%
Cash-on-Cash Return
3.7%
Cap rate
0.9%
Rent to Value Ratio
Active
$310,000
2
bds
|
2
ba
|
1,200
sqft
|
built
1970
401 Golden Isles Dr, Hallandale Beach, FL 33009
$-1,066
Cash flow
-17.9%
Cash-on-Cash Return
2.0%
Cap rate
0.9%
Rent to Value Ratio
Active
$649,000
4
bds
|
3
ba
|
2,083
sqft
|
built
1976
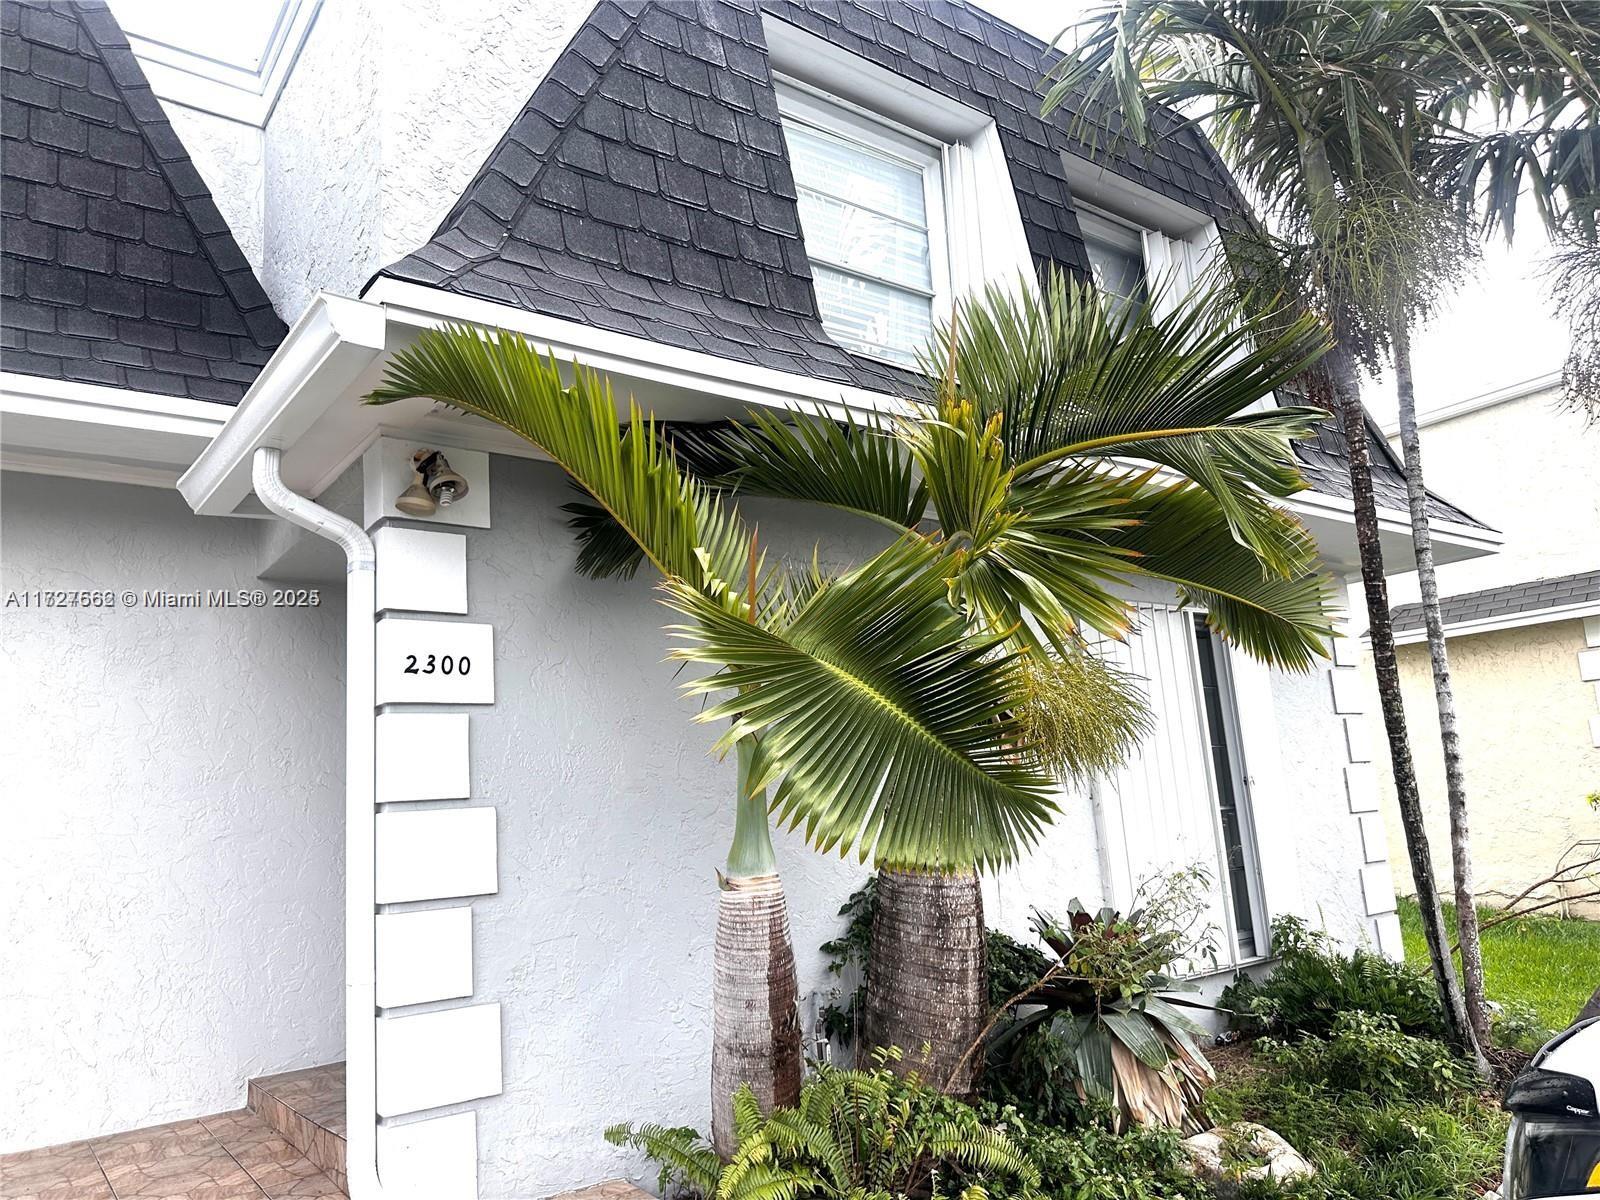
2300 NE 7th St, Hallandale Beach, FL 33009
$-2,144
Cash flow
-17.2%
Cash-on-Cash Return
2.2%
Cap rate
0.7%
Rent to Value Ratio

Active
$263,000
2
bds
|
2
ba
|
940
sqft
|
built
1980
1913 S Ocean Dr, Hallandale Beach, FL 33009
$-940
Cash flow
-18.6%
Cash-on-Cash Return
1.9%
Cap rate
0.9%
Rent to Value Ratio
Active
$584,900
2
bds
|
2
ba
|
1,248
sqft
|
built
1970
2030 S Ocean Dr, Hallandale Beach, FL 33009
$-2,199
Cash flow
-19.6%
Cash-on-Cash Return
1.6%
Cap rate
0.7%
Rent to Value Ratio
Active
$199,000
2
bds
|
2
ba
|
940
sqft
|
built
1973
714 NE 10th St, Hallandale Beach, FL 33009
$-980
Cash flow
-25.7%
Cash-on-Cash Return
0.2%
Cap rate
1.2%
Rent to Value Ratio
Active
$499,000
2
bds
|
2
ba
|
1,592
sqft
|
built
1984
300 Three Islands Blvd, Hallandale Beach, FL 33009
$-2,278
Cash flow
-23.8%
Cash-on-Cash Return
0.7%
Cap rate
0.6%
Rent to Value Ratio
Active
$475,000
2
bds
|
2
ba
|
1,180
sqft
|
built
1969
1817 S Ocean Dr, Hallandale Beach, FL 33009
$-1,971
Cash flow
-21.6%
Cash-on-Cash Return
1.2%
Cap rate
0.6%
Rent to Value Ratio
Active
$749,000
2
bds
|
2
ba
|
1,037
sqft
|
built
2015
2600 E Hallandale Beach Blvd, Hallandale Beach, FL 33009
$-2,111
Cash flow
-14.7%
Cash-on-Cash Return
2.8%
Cap rate
0.7%
Rent to Value Ratio
Active
$265,000
1
bds
|
1
ba
|
741
sqft
|
built
1972
3180 S Ocean Dr, Hallandale Beach, FL 33009
$-1,376
Cash flow
-27.1%
Cash-on-Cash Return
-0.1%
Cap rate
0.8%
Rent to Value Ratio

Active
$399,000
2
bds
|
2
ba
|
1,400
sqft
|
built
1975
600 Three Islands Blvd, Hallandale Beach, FL 33009
$-1,770
Cash flow
-23.1%
Cash-on-Cash Return
0.8%
Cap rate
0.7%
Rent to Value Ratio
Active
$145,000
1
bds
|
1
ba
|
720
sqft
|
built
1965
700 Layne Blvd, Hallandale Beach, FL 33009
$-381
Cash flow
-13.7%
Cash-on-Cash Return
3.0%
Cap rate
1.4%
Rent to Value Ratio
Active
$195,000
1
bds
|
2
ba
|
690
sqft
|
built
1973
714 NE 10th St, Hallandale Beach, FL 33009
$-755
Cash flow
-20.2%
Cash-on-Cash Return
1.5%
Cap rate
1.0%
Rent to Value Ratio

Active
$257,000
2
bds
|
1
ba
|
924
sqft
|
built
1974
501 Three Islands Blvd, Hallandale Beach, FL 33009
$-926
Cash flow
-18.8%
Cash-on-Cash Return
1.8%
Cap rate
0.8%
Rent to Value Ratio
Active
$230,000
1
bds
|
2
ba
|
672
sqft
|
built
1969
1825 S Ocean Dr, Hallandale Beach, FL 33009
$-775
Cash flow
-17.6%
Cash-on-Cash Return
2.1%
Cap rate
0.9%
Rent to Value Ratio
Active
$259,000
1
bds
|
2
ba
|
1,000
sqft
|
built
1975
600 Three Islands Blvd, Hallandale Beach, FL 33009
$49
Cash flow
1.0%
Cash-on-Cash Return
6.4%
Cap rate
1.0%
Rent to Value Ratio

Active
$495,000
1
bds
|
2
ba
|
832
sqft
|
built
1972
3180 S Ocean Dr, Hallandale Beach, FL 33009
$-2,386
Cash flow
-25.1%
Cash-on-Cash Return
0.4%
Cap rate
0.6%
Rent to Value Ratio

Active
$349,000
2
bds
|
2
ba
|
1,100
sqft
|
built
1972
1833 S Ocean Dr, Hallandale Beach, FL 33009
$-1,184
Cash flow
-17.7%
Cash-on-Cash Return
2.1%
Cap rate
0.8%
Rent to Value Ratio
Active
$275,000
1
bds
|
2
ba
|
950
sqft
|
built
1981
2500 Parkview Dr, Hallandale Beach, FL 33009
$-1,263
Cash flow
-24.0%
Cash-on-Cash Return
0.6%
Cap rate
0.7%
Rent to Value Ratio
Active
$248,000
2
bds
|
2
ba
|
1,075
sqft
|
built
1976
800 Parkview Dr, Hallandale Beach, FL 33009
$-997
Cash flow
-21.0%
Cash-on-Cash Return
1.3%
Cap rate
0.9%
Rent to Value Ratio
Active
$730,000
1
bds
|
1
ba
|
844
sqft
|
built
2006
1830 S Ocean Dr, Hallandale Beach, FL 33009
$-2,280
Cash flow
-16.3%
Cash-on-Cash Return
2.4%
Cap rate
0.7%
Rent to Value Ratio
Active
$1,000,000
3
bds
|
3
ba
|
1,571
sqft
|
built
2005
1850 S Ocean Dr, Hallandale Beach, FL 33009
$-4,024
Cash flow
-21.0%
Cash-on-Cash Return
1.3%
Cap rate
0.6%
Rent to Value Ratio
Active
$450,000
1
bds
|
2
ba
|
870
sqft
|
built
1971
1980 S Ocean Dr, Hallandale Beach, FL 33009
$-727
Cash flow
-8.4%
Cash-on-Cash Return
4.2%
Cap rate
0.7%
Rent to Value Ratio
Active
$700,000
1
bds
|
1
ba
|
871
sqft
|
built
2006
1830 S Ocean Dr, Hallandale Beach, FL 33009
$-2,424
Cash flow
-18.1%
Cash-on-Cash Return
2.0%
Cap rate
0.6%
Rent to Value Ratio
Active
$259,000
1
bds
|
2
ba
|
925
sqft
|
built
1970
401 Golden Isles Dr, Hallandale Beach, FL 33009
$-998
Cash flow
-20.1%
Cash-on-Cash Return
1.5%
Cap rate
0.8%
Rent to Value Ratio
Active
$299,999
1
bds
|
2
ba
|
850
sqft
|
built
1970
200 Diplomat Pkwy, Hallandale Beach, FL 33009
$-968
Cash flow
-16.8%
Cash-on-Cash Return
2.3%
Cap rate
0.8%
Rent to Value Ratio