Hallandale Beach, FL Investment Properties for Sale
Browse homes for sale and investment properties in Hallandale Beach, FL. Refine your search by price, property type, or more.
Best cash flowing properties in Hallandale Beach, FL
Active
$219,000
1
bds
|
1
ba
|
875
sqft
|
built
1976
800 Parkview Dr, Hallandale Beach, FL 33009
$15
Cash flow
0.4%
Cash-on-Cash Return
6.4%
Cap rate
1.1%
Rent to Value Ratio
Active
$439,000
2
bds
|
2
ba
|
1,430
sqft
|
built
1976
1000 Parkview Dr, Hallandale Beach, FL 33009
$-453
Cash flow
-5.4%
Cash-on-Cash Return
5.0%
Cap rate
0.8%
Rent to Value Ratio
833 out of 931 properties for sale in Hallandale Beach, FL
Limited Results Shown
Create a free account, or log in to reveal all property listings and enjoy the complete experience.

Active
$289,900
2
bds
|
2
ba
|
1,210
sqft
|
built
1975
601 Three Islands Blvd, Hallandale Beach, FL 33009
$-566
Cash flow
-10.2%
Cash-on-Cash Return
3.9%
Cap rate
1.0%
Rent to Value Ratio
Active
$307,000
1
bds
|
2
ba
|
870
sqft
|
built
1971
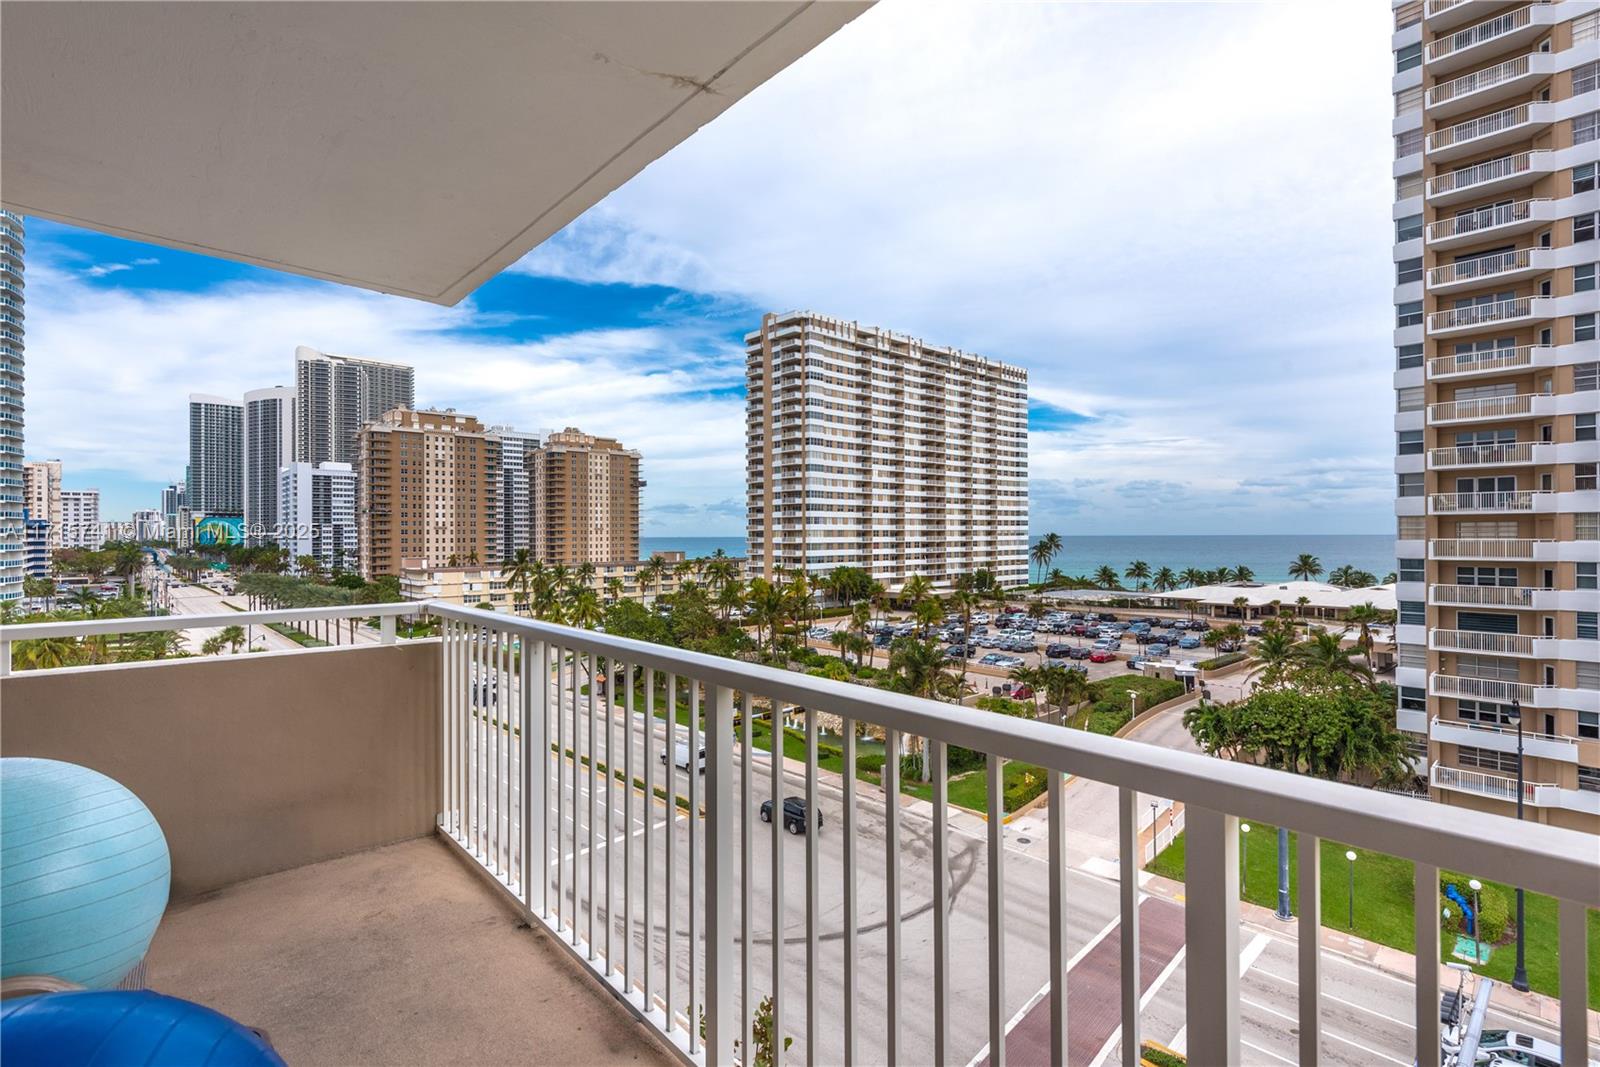
1950 S Ocean Dr, Hallandale Beach, FL 33009
$-1,162
Cash flow
-19.7%
Cash-on-Cash Return
1.7%
Cap rate
0.8%
Rent to Value Ratio
Active
$274,960
1
bds
|
2
ba
|
1,000
sqft
|
built
1975
600 Three Islands Blvd, Hallandale Beach, FL 33009
$-1,121
Cash flow
-21.3%
Cash-on-Cash Return
1.4%
Cap rate
0.7%
Rent to Value Ratio
Active
$275,000
1
bds
|
1
ba
|
736
sqft
|
built
1970
2030 S Ocean Dr, Hallandale Beach, FL 33009
$-1,224
Cash flow
-23.2%
Cash-on-Cash Return
0.9%
Cap rate
0.9%
Rent to Value Ratio
Active
$289,000
2
bds
|
2
ba
|
1,075
sqft
|
built
1976
800 Parkview Dr, Hallandale Beach, FL 33009
$-1,488
Cash flow
-26.9%
Cash-on-Cash Return
0.1%
Cap rate
0.8%
Rent to Value Ratio
Active
$219,000
1
bds
|
1
ba
|
875
sqft
|
built
1976
800 Parkview Dr, Hallandale Beach, FL 33009
$15
Cash flow
0.4%
Cash-on-Cash Return
6.4%
Cap rate
1.1%
Rent to Value Ratio
Active
$349,000
2
bds
|
2
ba
|
1,420
sqft
|
built
1973
100 Golden Isles Dr, Hallandale Beach, FL 33009
$-1,079
Cash flow
-16.1%
Cash-on-Cash Return
2.6%
Cap rate
0.9%
Rent to Value Ratio
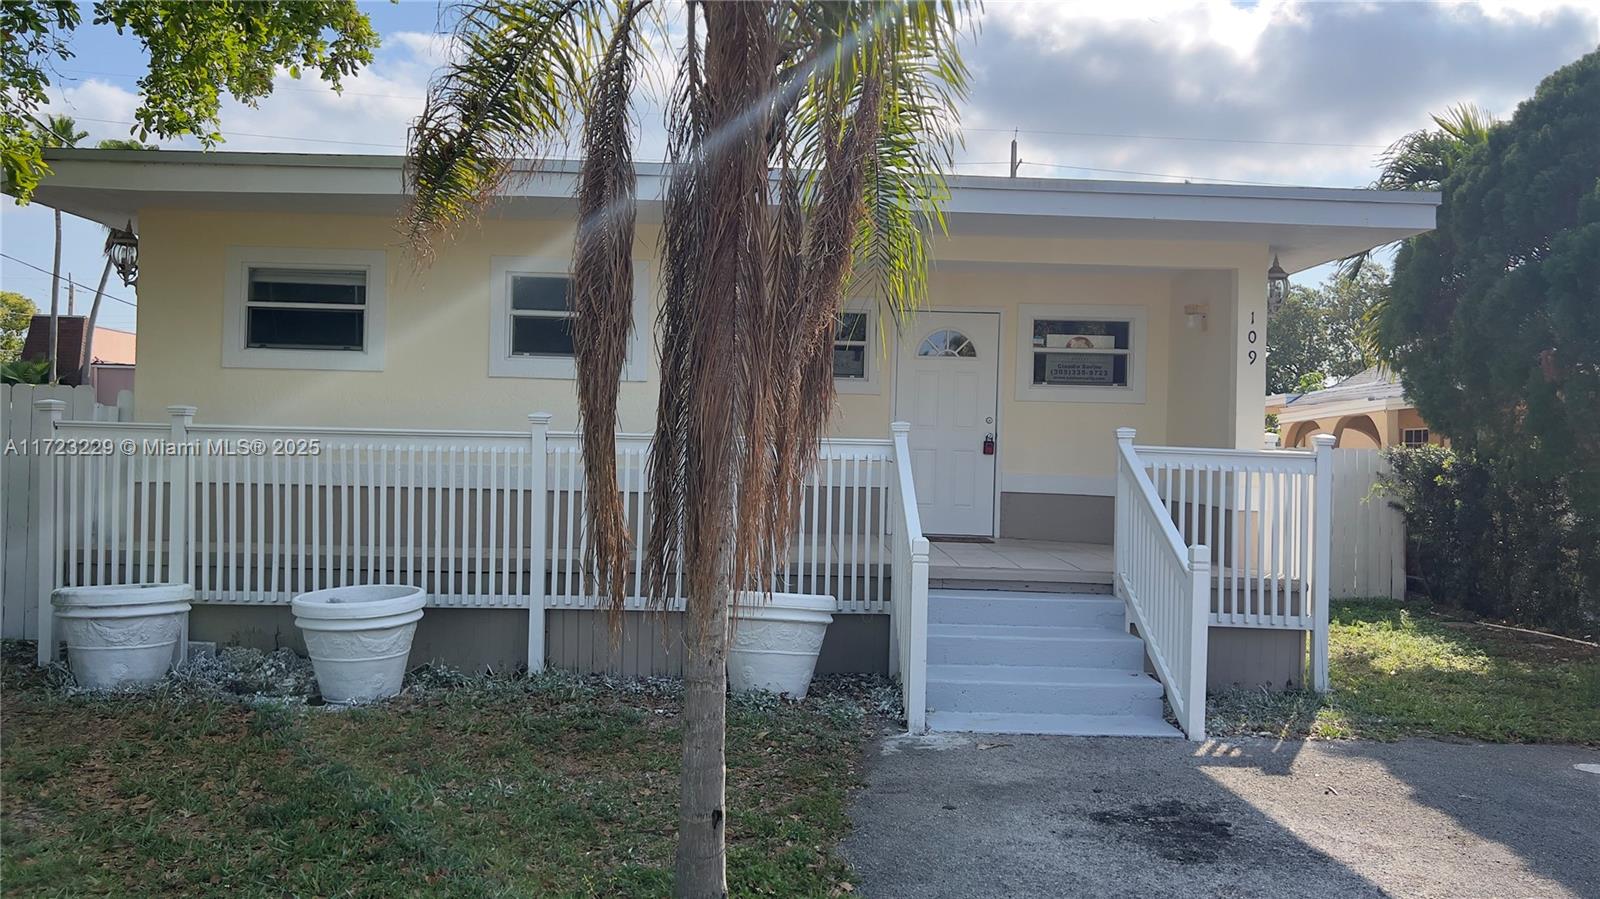
Active
$550,000
3
bds
|
2
ba
|
1,218
sqft
|
built
1992
109 SW 1st Ave, Hallandale Beach, FL 33009
$-1,467
Cash flow
-13.9%
Cash-on-Cash Return
3.1%
Cap rate
0.5%
Rent to Value Ratio
Active
$329,900
2
bds
|
2
ba
|
1,130
sqft
|
built
1981
400 Leslie Dr, Hallandale Beach, FL 33009
$-505
Cash flow
-8.0%
Cash-on-Cash Return
4.4%
Cap rate
0.8%
Rent to Value Ratio
Active
$200,000
1
bds
|
1
ba
|
545
sqft
|
built
1970
1965 S Ocean Dr, Hallandale Beach, FL 33009
$-784
Cash flow
-20.5%
Cash-on-Cash Return
1.6%
Cap rate
0.9%
Rent to Value Ratio
Active
$230,000
2
bds
|
2
ba
|
930
sqft
|
built
1969
1100 NE 1st Ct, Hallandale Beach, FL 33009
$-480
Cash flow
-10.9%
Cash-on-Cash Return
3.8%
Cap rate
1.0%
Rent to Value Ratio
Active
$285,000
1
bds
|
1
ba
|
876
sqft
|
built
1974
301 Golden Isles Dr, Hallandale Beach, FL 33009
$-1,109
Cash flow
-20.3%
Cash-on-Cash Return
1.6%
Cap rate
0.7%
Rent to Value Ratio
Active
$479,000
2
bds
|
2
ba
|
1,288
sqft
|
built
1971
137 Golden Isles Dr, Hallandale Beach, FL 33009
$-1,280
Cash flow
-13.9%
Cash-on-Cash Return
3.1%
Cap rate
0.8%
Rent to Value Ratio
Active
$199,000
1
bds
|
1
ba
|
820
sqft
|
built
1974
851 Three Islands Blvd, Hallandale Beach, FL 33009
$-557
Cash flow
-14.6%
Cash-on-Cash Return
2.9%
Cap rate
1.0%
Rent to Value Ratio

Active
$669,000
4
bds
|
2
ba
|
1,380
sqft
|
built
2008
701 NE 6th St, Hallandale Beach, FL 33009
$-985
Cash flow
-7.7%
Cash-on-Cash Return
4.5%
Cap rate
0.6%
Rent to Value Ratio
Active
$479,900
2
bds
|
2
ba
|
1,430
sqft
|
built
1979
600 Parkview Dr, Hallandale Beach, FL 33009
$-1,828
Cash flow
-19.9%
Cash-on-Cash Return
1.7%
Cap rate
0.7%
Rent to Value Ratio
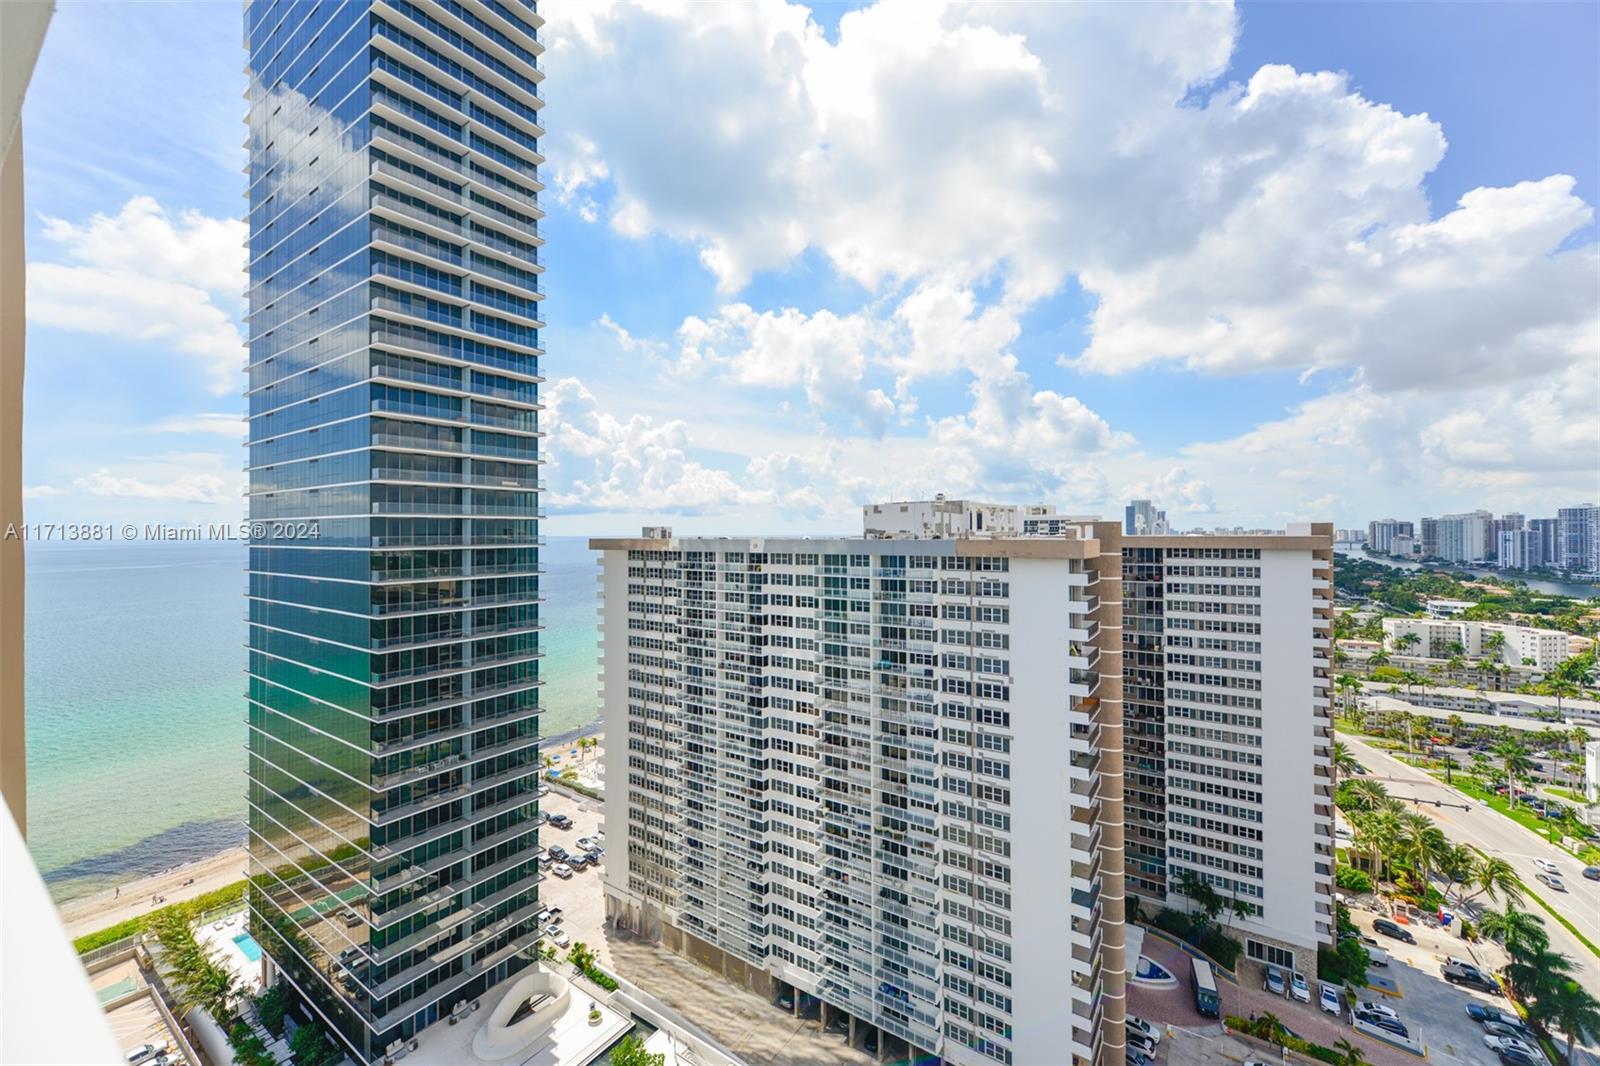
Active
$489,000
2
bds
|
2
ba
|
1,222
sqft
|
built
1979
3140 S Ocean Dr, Hallandale Beach, FL 33009
$-2,040
Cash flow
-21.8%
Cash-on-Cash Return
1.3%
Cap rate
0.7%
Rent to Value Ratio
Active
$329,000
2
bds
|
2
ba
|
1,380
sqft
|
built
1972
1985 S Ocean Dr, Hallandale Beach, FL 33009
$-1,516
Cash flow
-24.0%
Cash-on-Cash Return
0.8%
Cap rate
0.9%
Rent to Value Ratio
Active
$400,000
2
bds
|
2
ba
|
1,200
sqft
|
built
1970
1849 S Ocean Dr, Hallandale Beach, FL 33009
$-1,594
Cash flow
-20.8%
Cash-on-Cash Return
1.5%
Cap rate
0.7%
Rent to Value Ratio
Active
$391,750
1
bds
|
2
ba
|
870
sqft
|
built
1972
1980 S Ocean Dr, Hallandale Beach, FL 33009
$-499
Cash flow
-6.6%
Cash-on-Cash Return
4.8%
Cap rate
0.7%
Rent to Value Ratio
Active
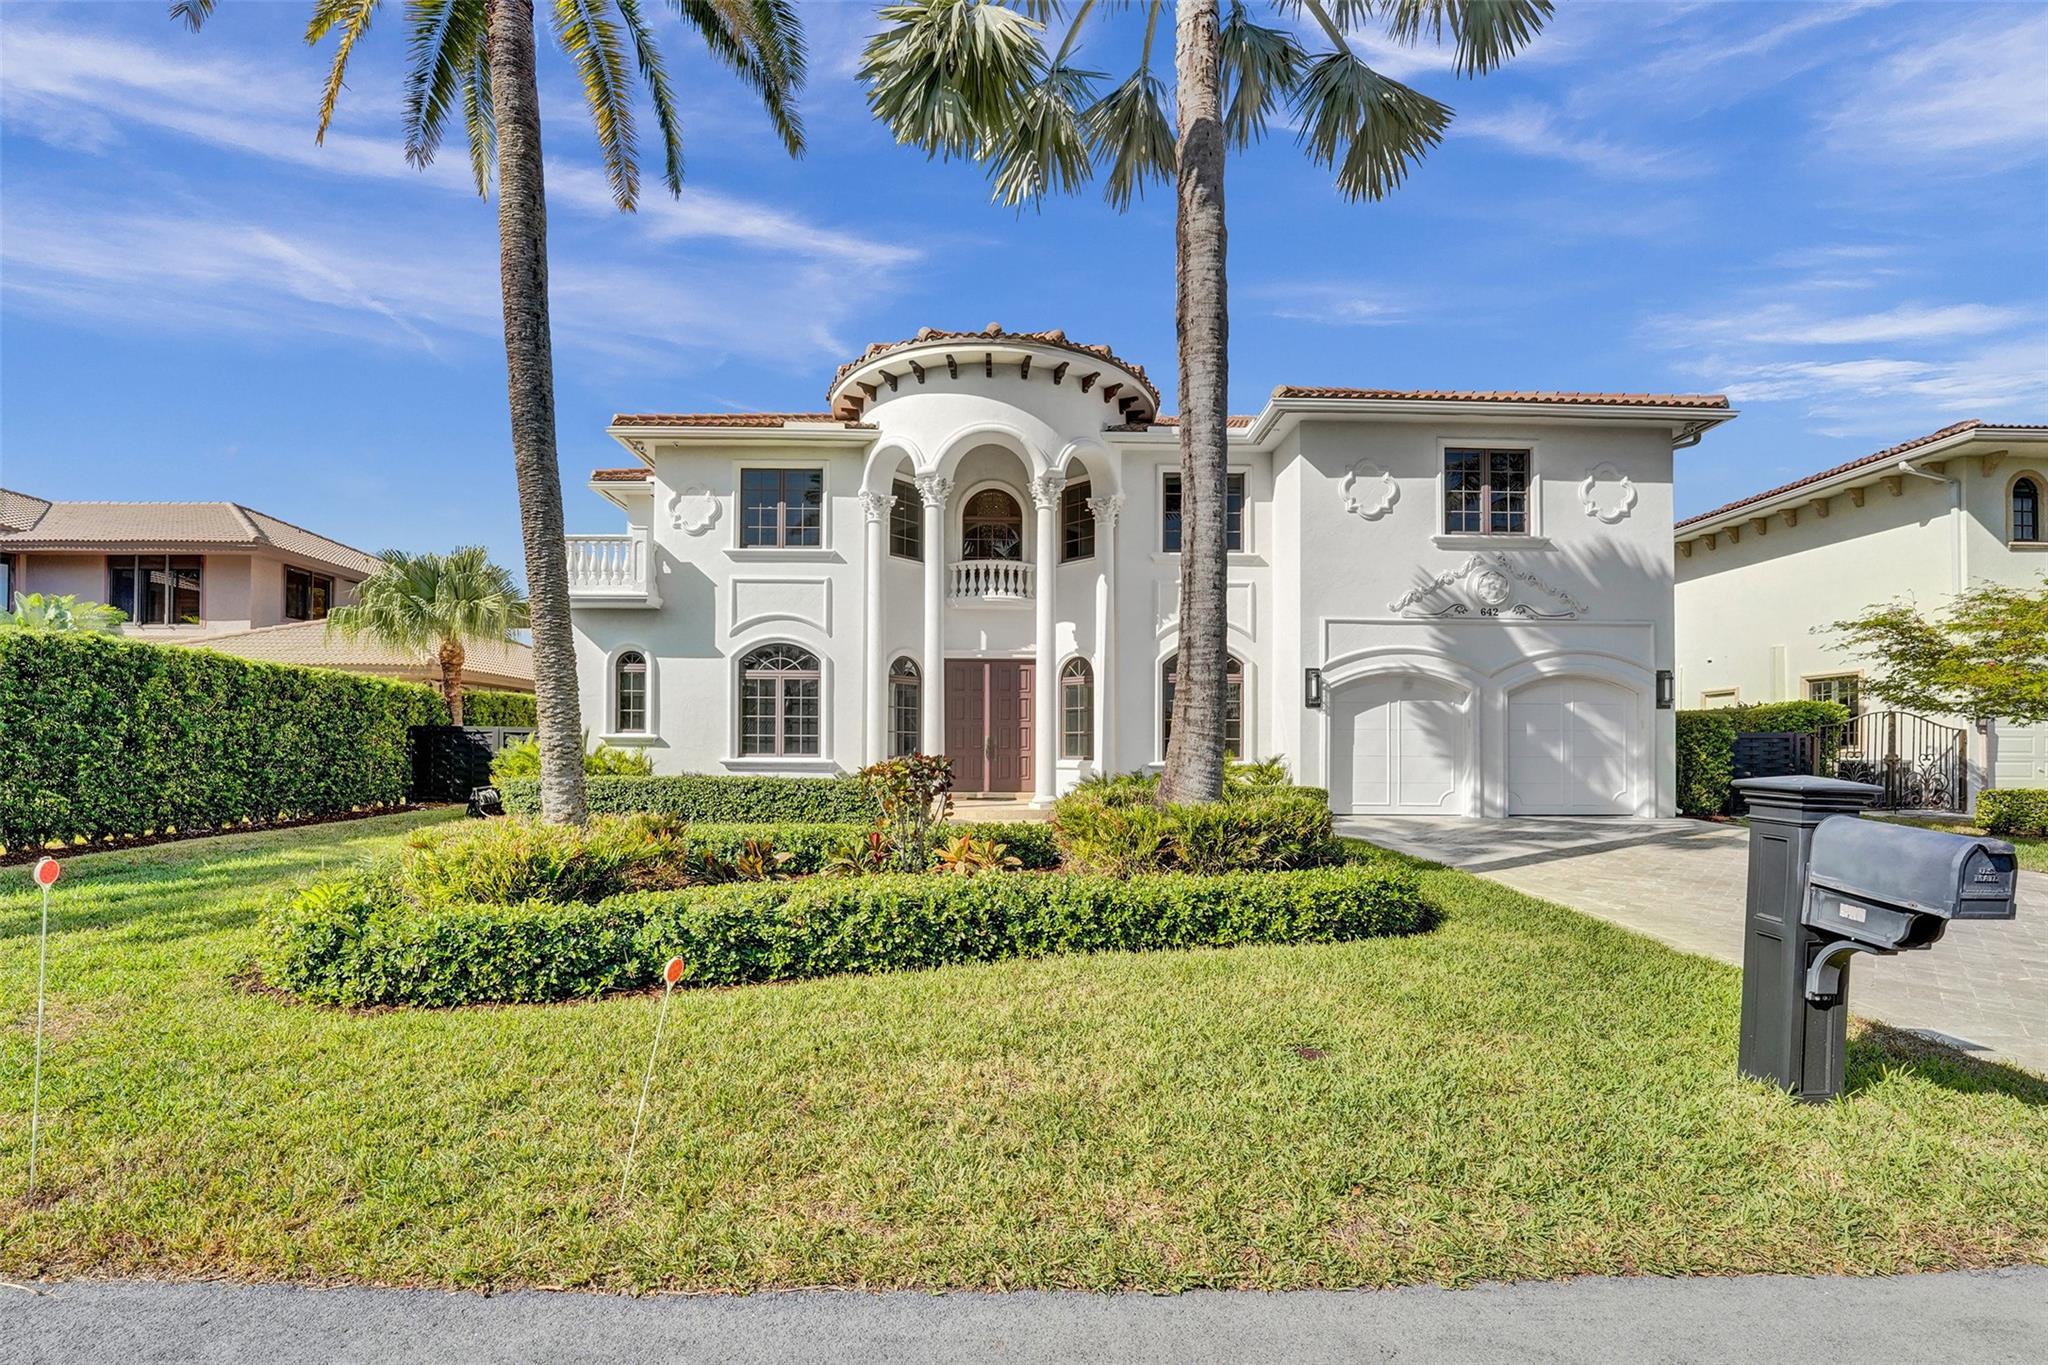
$6,199,000
7
bds
|
8
ba
|
5,660
sqft
|
built
2011
642 Palm Dr, Hallandale Beach, FL 33009
$-32,881
Cash flow
-27.7%
Cash-on-Cash Return
-0.1%
Cap rate
0.2%
Rent to Value Ratio
Active
$550,000
1
bds
|
2
ba
|
870
sqft
|
built
1971
1980 S Ocean Dr, Hallandale Beach, FL 33009
$-2,441
Cash flow
-23.2%
Cash-on-Cash Return
1.0%
Cap rate
0.5%
Rent to Value Ratio
Active
$500,000
3
bds
|
3
ba
|
1,740
sqft
|
built
1972
1985 S Ocean Dr, Hallandale Beach, FL 33009
$-1,799
Cash flow
-18.8%
Cash-on-Cash Return
2.0%
Cap rate
0.8%
Rent to Value Ratio
Active
$319,000
2
bds
|
2
ba
|
1,135
sqft
|
built
1973
400 Diplomat Pkwy, Hallandale Beach, FL 33009
$-954
Cash flow
-15.6%
Cash-on-Cash Return
2.7%
Cap rate
0.9%
Rent to Value Ratio
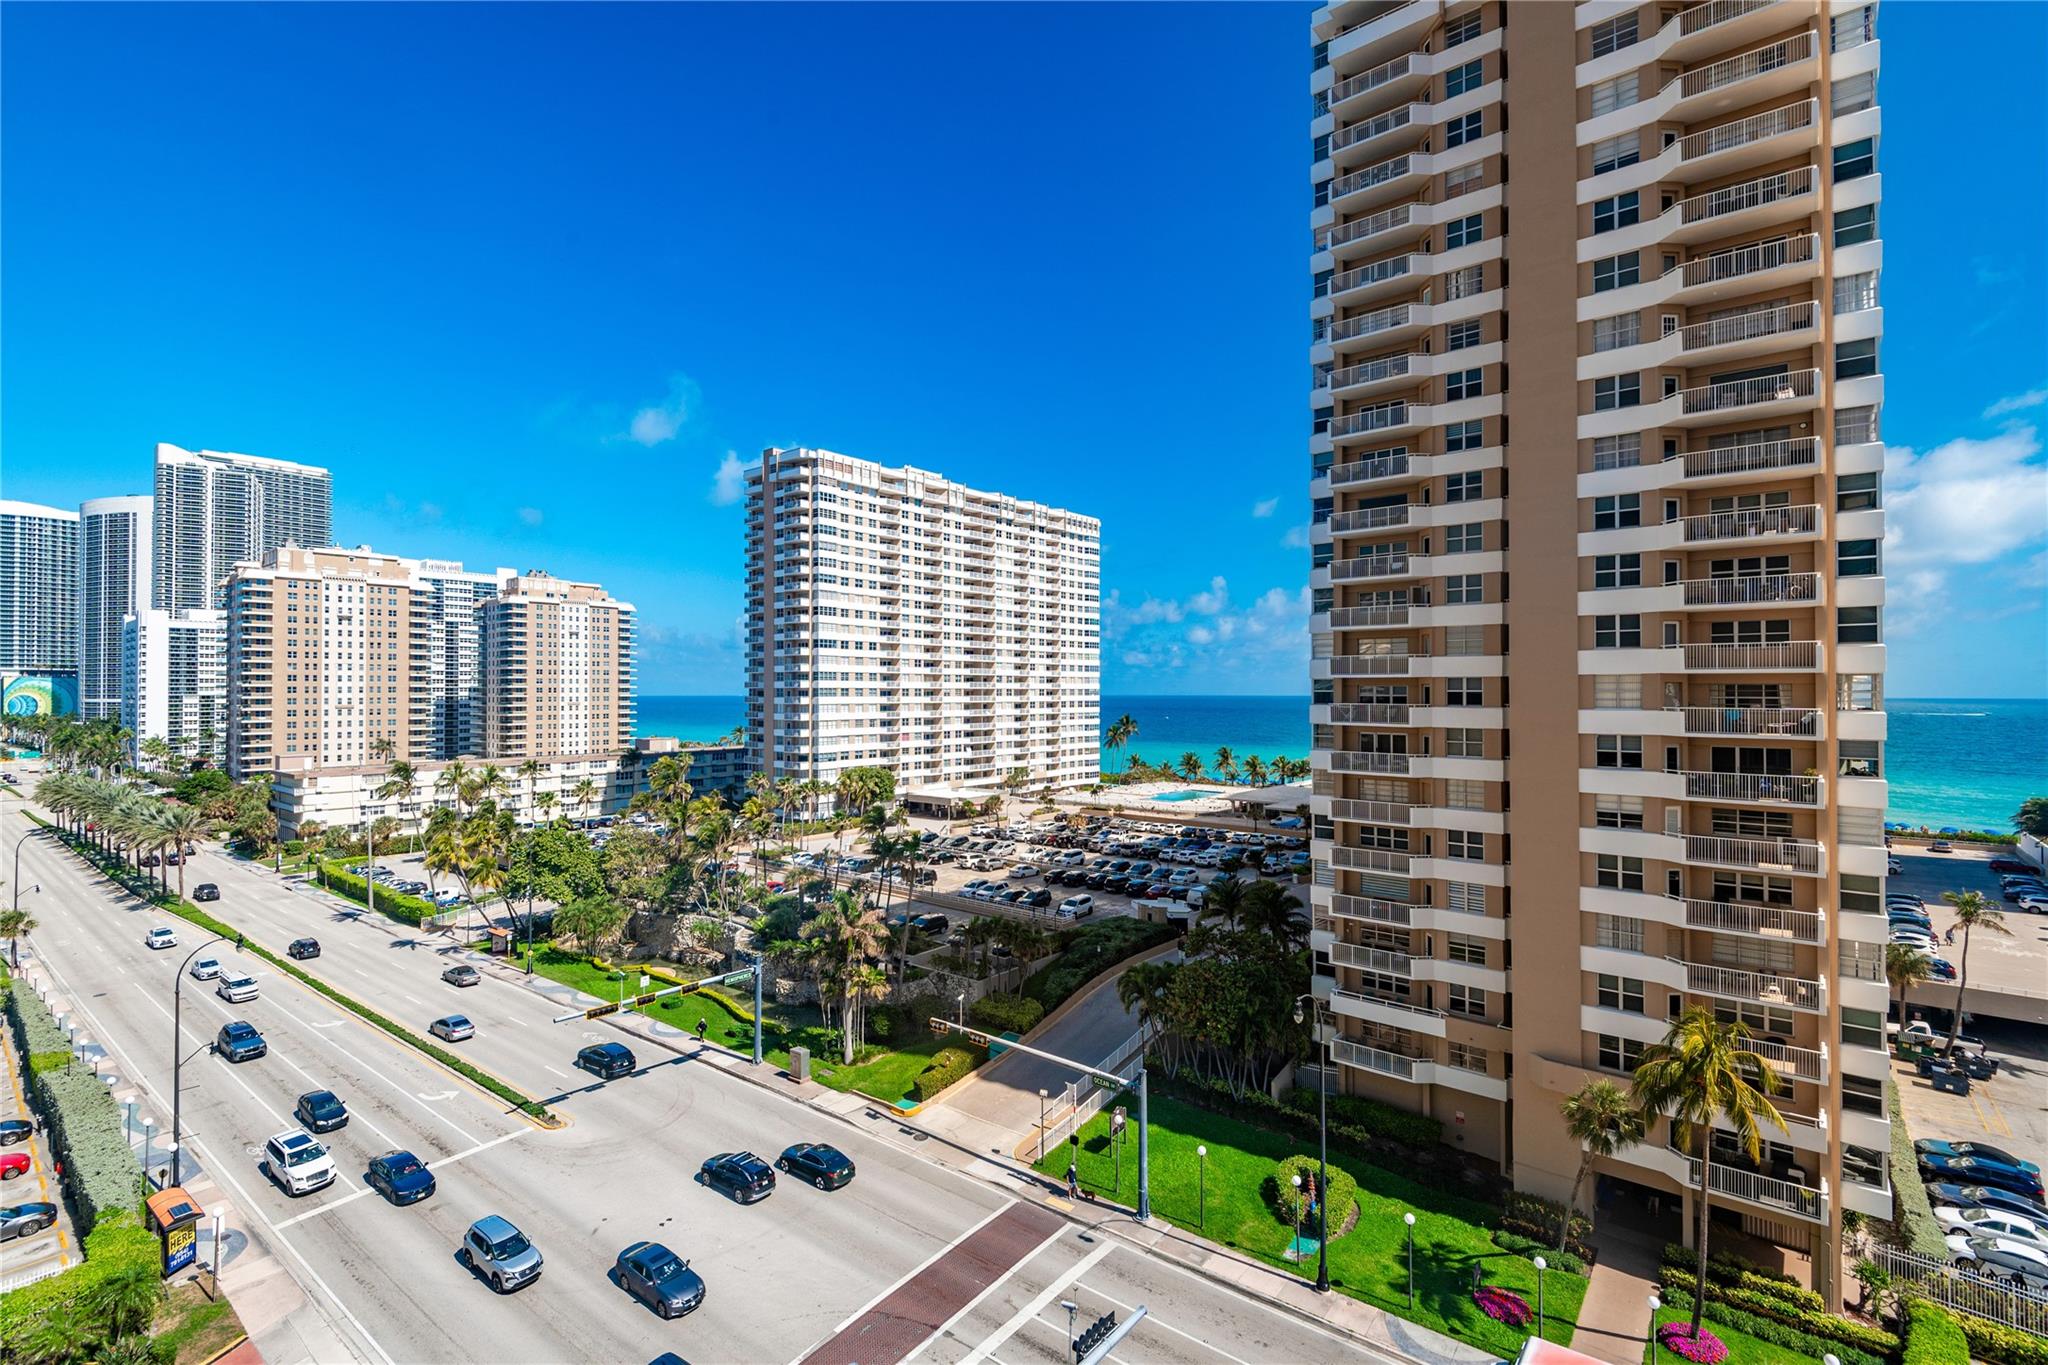
Active
$339,900
1
bds
|
1
ba
|
900
sqft
|
built
1979
3140 S Ocean Dr, Hallandale Beach, FL 33009
$-1,245
Cash flow
-19.1%
Cash-on-Cash Return
1.9%
Cap rate
0.7%
Rent to Value Ratio
Active
$547,000
2
bds
|
2
ba
|
1,150
sqft
|
built
2004
201 Golden Isles Dr, Hallandale Beach, FL 33009
$-2,083
Cash flow
-19.9%
Cash-on-Cash Return
1.7%
Cap rate
0.5%
Rent to Value Ratio
Active
$1,549,000
bds
|
0
ba
|
3,385
sqft
|
built
1961
101 SW 4th Ave, Hallandale Beach, FL 33009
$-6,517
Cash flow
-22.0%
Cash-on-Cash Return
1.2%
Cap rate
0.3%
Rent to Value Ratio
Active
$280,000
2
bds
|
2
ba
|
1,020
sqft
|
built
1964
450 Golden Isles Dr, Hallandale Beach, FL 33009
$-984
Cash flow
-18.3%
Cash-on-Cash Return
2.1%
Cap rate
0.8%
Rent to Value Ratio

Active
$11,995,000
7
bds
|
10
ba
|
6,996
sqft
|
built
2013
101 Holiday Dr, Hallandale Beach, FL 33009
$-69,237
Cash flow
-30.1%
Cash-on-Cash Return
-0.6%
Cap rate
0.1%
Rent to Value Ratio
Active
$439,000
2
bds
|
2
ba
|
1,430
sqft
|
built
1976
1000 Parkview Dr, Hallandale Beach, FL 33009
$-453
Cash flow
-5.4%
Cash-on-Cash Return
5.0%
Cap rate
0.8%
Rent to Value Ratio
Active
$459,800
1
bds
|
2
ba
|
832
sqft
|
built
1972
3180 S Ocean Dr, Hallandale Beach, FL 33009
$-1,699
Cash flow
-19.3%
Cash-on-Cash Return
1.9%
Cap rate
0.8%
Rent to Value Ratio

Active
$1,185,000
2
bds
|
3
ba
|
2,305
sqft
|
built
1975
1912 S Ocean Dr, Hallandale Beach, FL 33009
$-5,082
Cash flow
-22.4%
Cash-on-Cash Return
1.1%
Cap rate
0.5%
Rent to Value Ratio

Active
$388,000
2
bds
|
2
ba
|
1,443
sqft
|
built
1969
1825 S Ocean Dr, Hallandale Beach, FL 33009
$-1,440
Cash flow
-19.4%
Cash-on-Cash Return
1.8%
Cap rate
0.8%
Rent to Value Ratio
Active
$378,000
1
bds
|
2
ba
|
1,300
sqft
|
built
1974
1865 S Ocean Dr, Hallandale Beach, FL 33009
$-1,172
Cash flow
-16.2%
Cash-on-Cash Return
2.6%
Cap rate
0.8%
Rent to Value Ratio
Active
$469,000
2
bds
|
2
ba
|
1,710
sqft
|
built
1974
1865 S Ocean Dr, Hallandale Beach, FL 33009
$-2,532
Cash flow
-28.2%
Cash-on-Cash Return
-0.2%
Cap rate
0.6%
Rent to Value Ratio
Active
$1,825,000
3
bds
|
4
ba
|
2,078
sqft
|
built
2006
1800 S Ocean Dr, Hallandale Beach, FL 33009
$-7,481
Cash flow
-21.4%
Cash-on-Cash Return
1.4%
Cap rate
0.4%
Rent to Value Ratio
Active
$425,998
2
bds
|
2
ba
|
1,280
sqft
|
built
1981
2500 Parkview Dr, Hallandale Beach, FL 33009
$-1,736
Cash flow
-21.3%
Cash-on-Cash Return
1.4%
Cap rate
0.8%
Rent to Value Ratio
Active
$239,000
1
bds
|
2
ba
|
850
sqft
|
built
1970
300 Diplomat Pkwy, Hallandale Beach, FL 33009
$-927
Cash flow
-20.2%
Cash-on-Cash Return
1.6%
Cap rate
1.0%
Rent to Value Ratio
Active
$739,900
2
bds
|
2
ba
|
1,190
sqft
|
built
2002
2080 S Ocean Dr, Hallandale Beach, FL 33009
$-2,448
Cash flow
-17.3%
Cash-on-Cash Return
2.3%
Cap rate
0.6%
Rent to Value Ratio
Active
$464,000
2
bds
|
2
ba
|
1,081
sqft
|
built
2007
1755 E Hallandale Beach Blvd, Hallandale Beach, FL 33009
$-1,563
Cash flow
-17.6%
Cash-on-Cash Return
2.2%
Cap rate
0.8%
Rent to Value Ratio