Hallandale Beach, FL Investment Properties for Sale
Browse homes for sale and investment properties in Hallandale Beach, FL. Refine your search by price, property type, or more.
Best cash flowing properties in Hallandale Beach, FL
Active
$375,000
2
bds
|
2
ba
|
1,340
sqft
|
built
1972
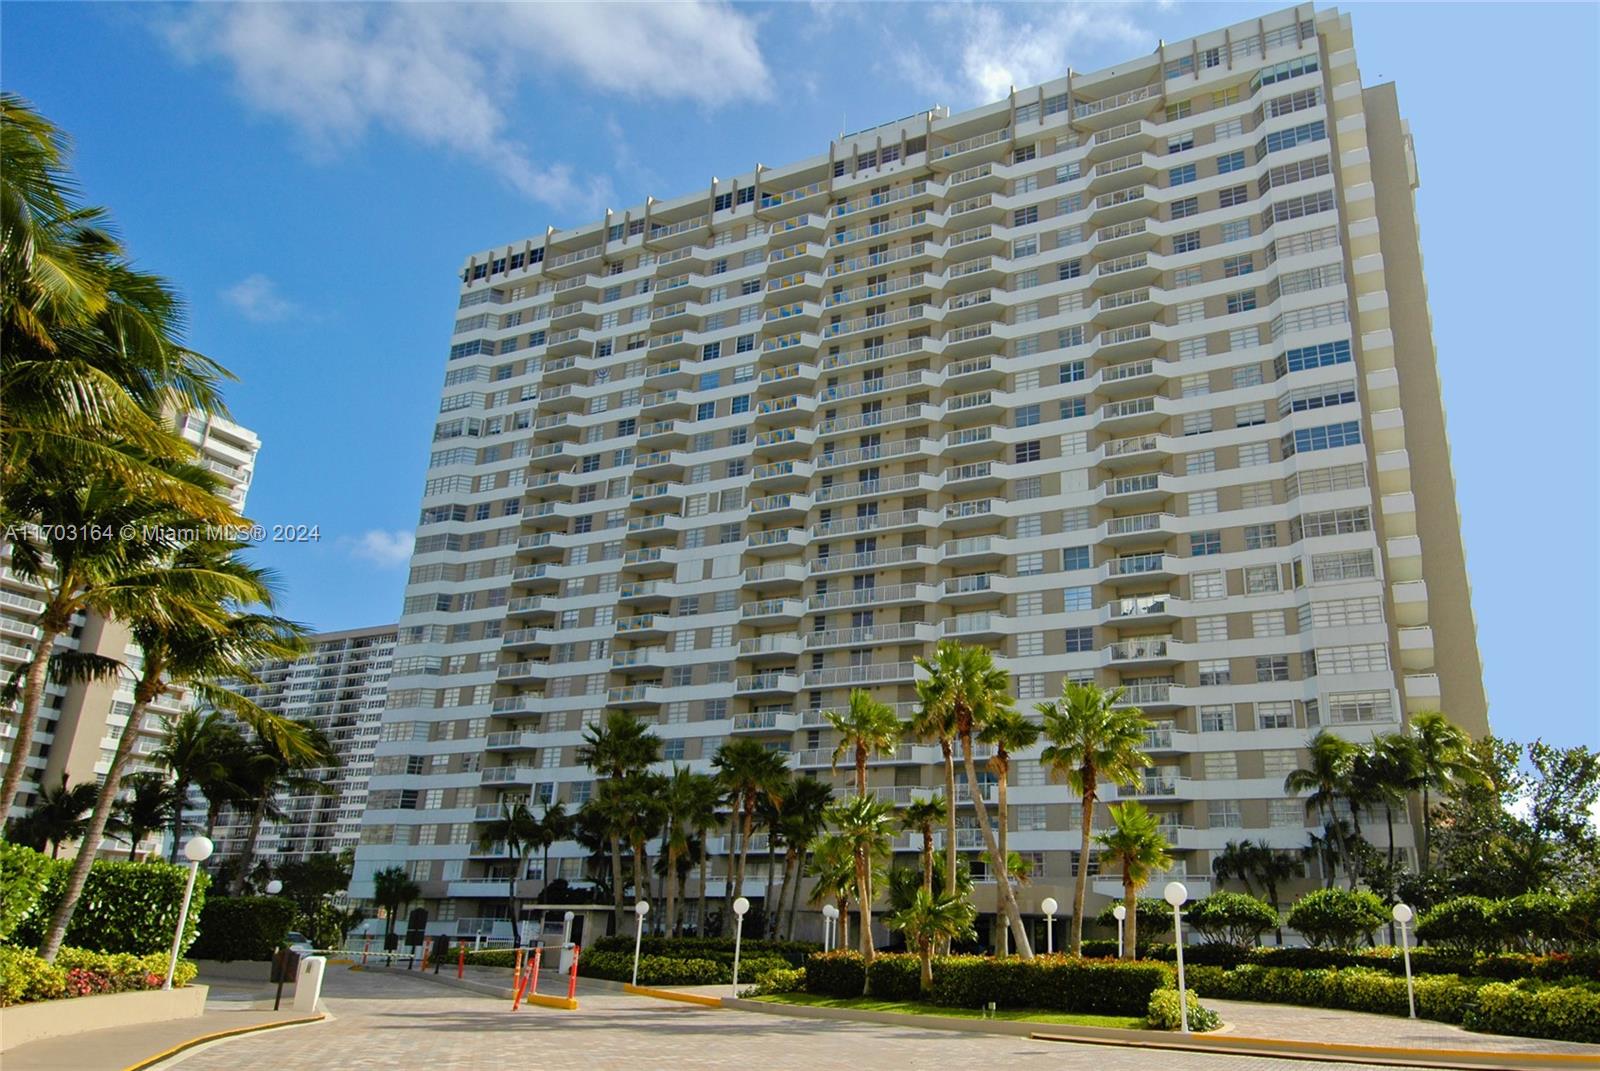
1985 S Ocean Dr, Hallandale Beach, FL 33009
$205
Cash flow
2.9%
Cash-on-Cash Return
6.9%
Cap rate
1.0%
Rent to Value Ratio
Active
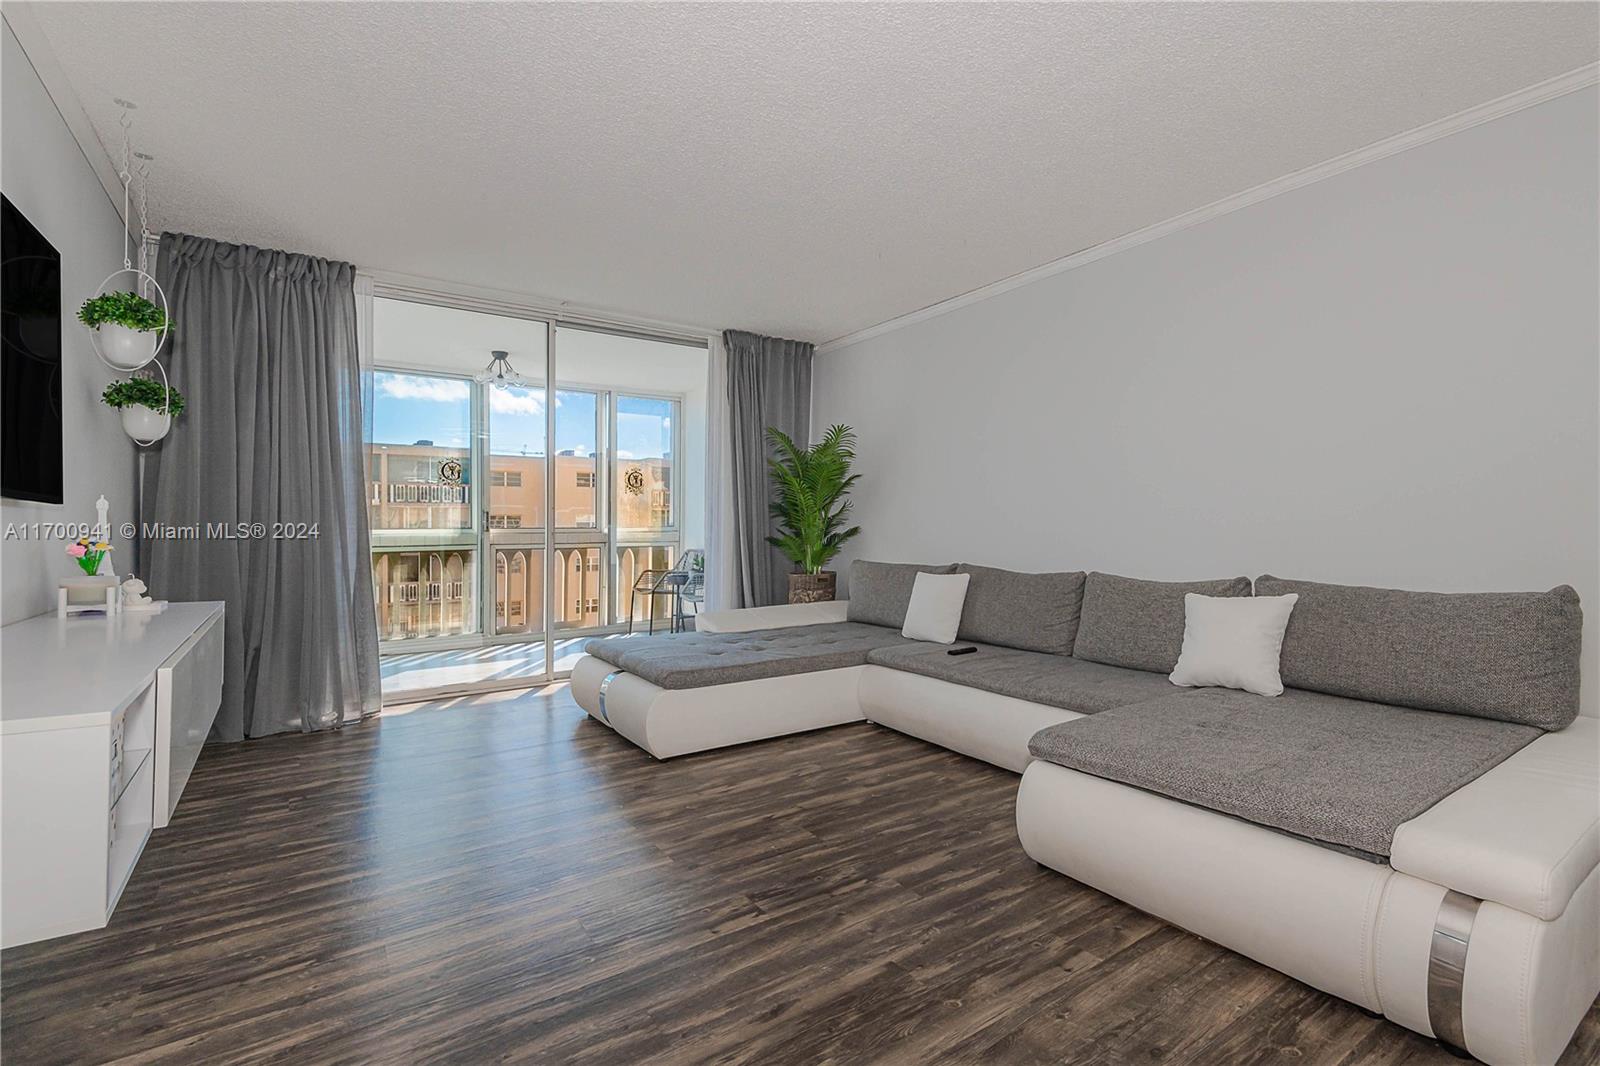
$199,000
1
bds
|
1
ba
|
730
sqft
|
built
1972
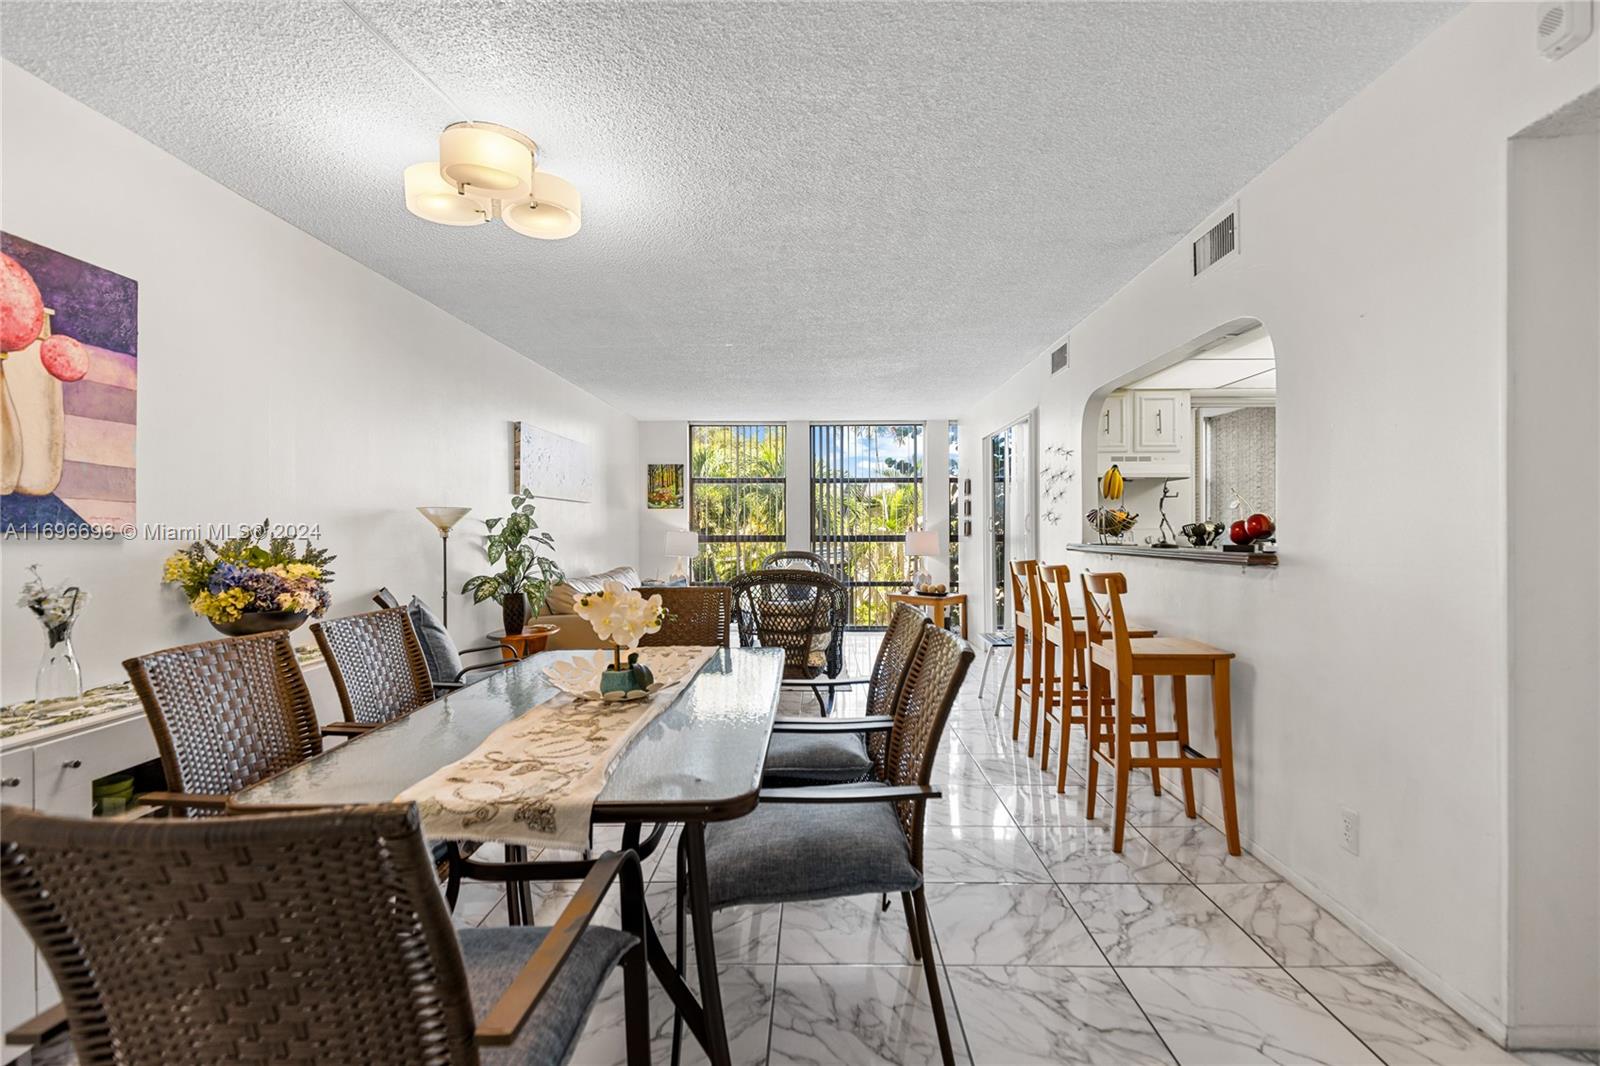
500 NE 12th Ave, Hallandale Beach, FL 33009
$-215
Cash flow
-5.6%
Cash-on-Cash Return
5.0%
Cap rate
1.2%
Rent to Value Ratio
832 out of 930 properties for sale in Hallandale Beach, FL
Limited Results Shown
Create a free account, or log in to reveal all property listings and enjoy the complete experience.
Active
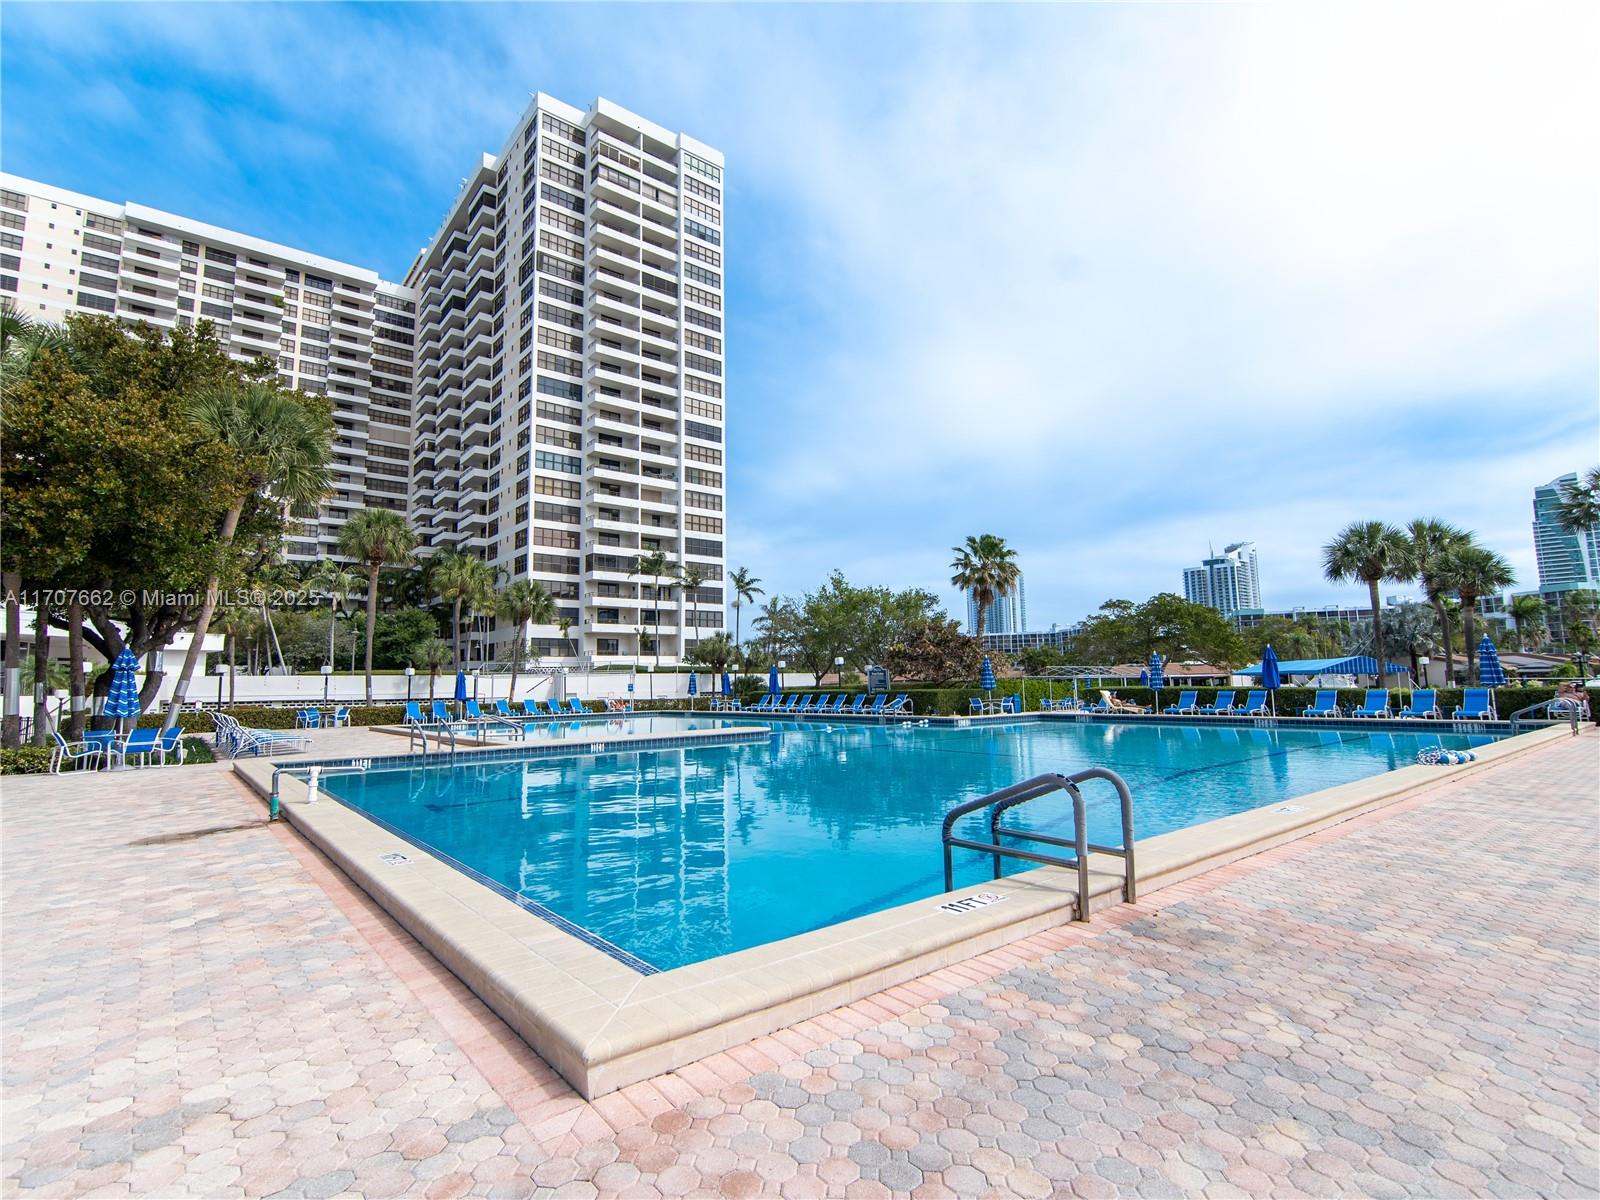
$385,000
2
bds
|
2
ba
|
1,580
sqft
|
built
1980
2500 Parkview Dr, Hallandale Beach, FL 33009
$-1,234
Cash flow
-16.7%
Cash-on-Cash Return
2.4%
Cap rate
0.9%
Rent to Value Ratio

Active
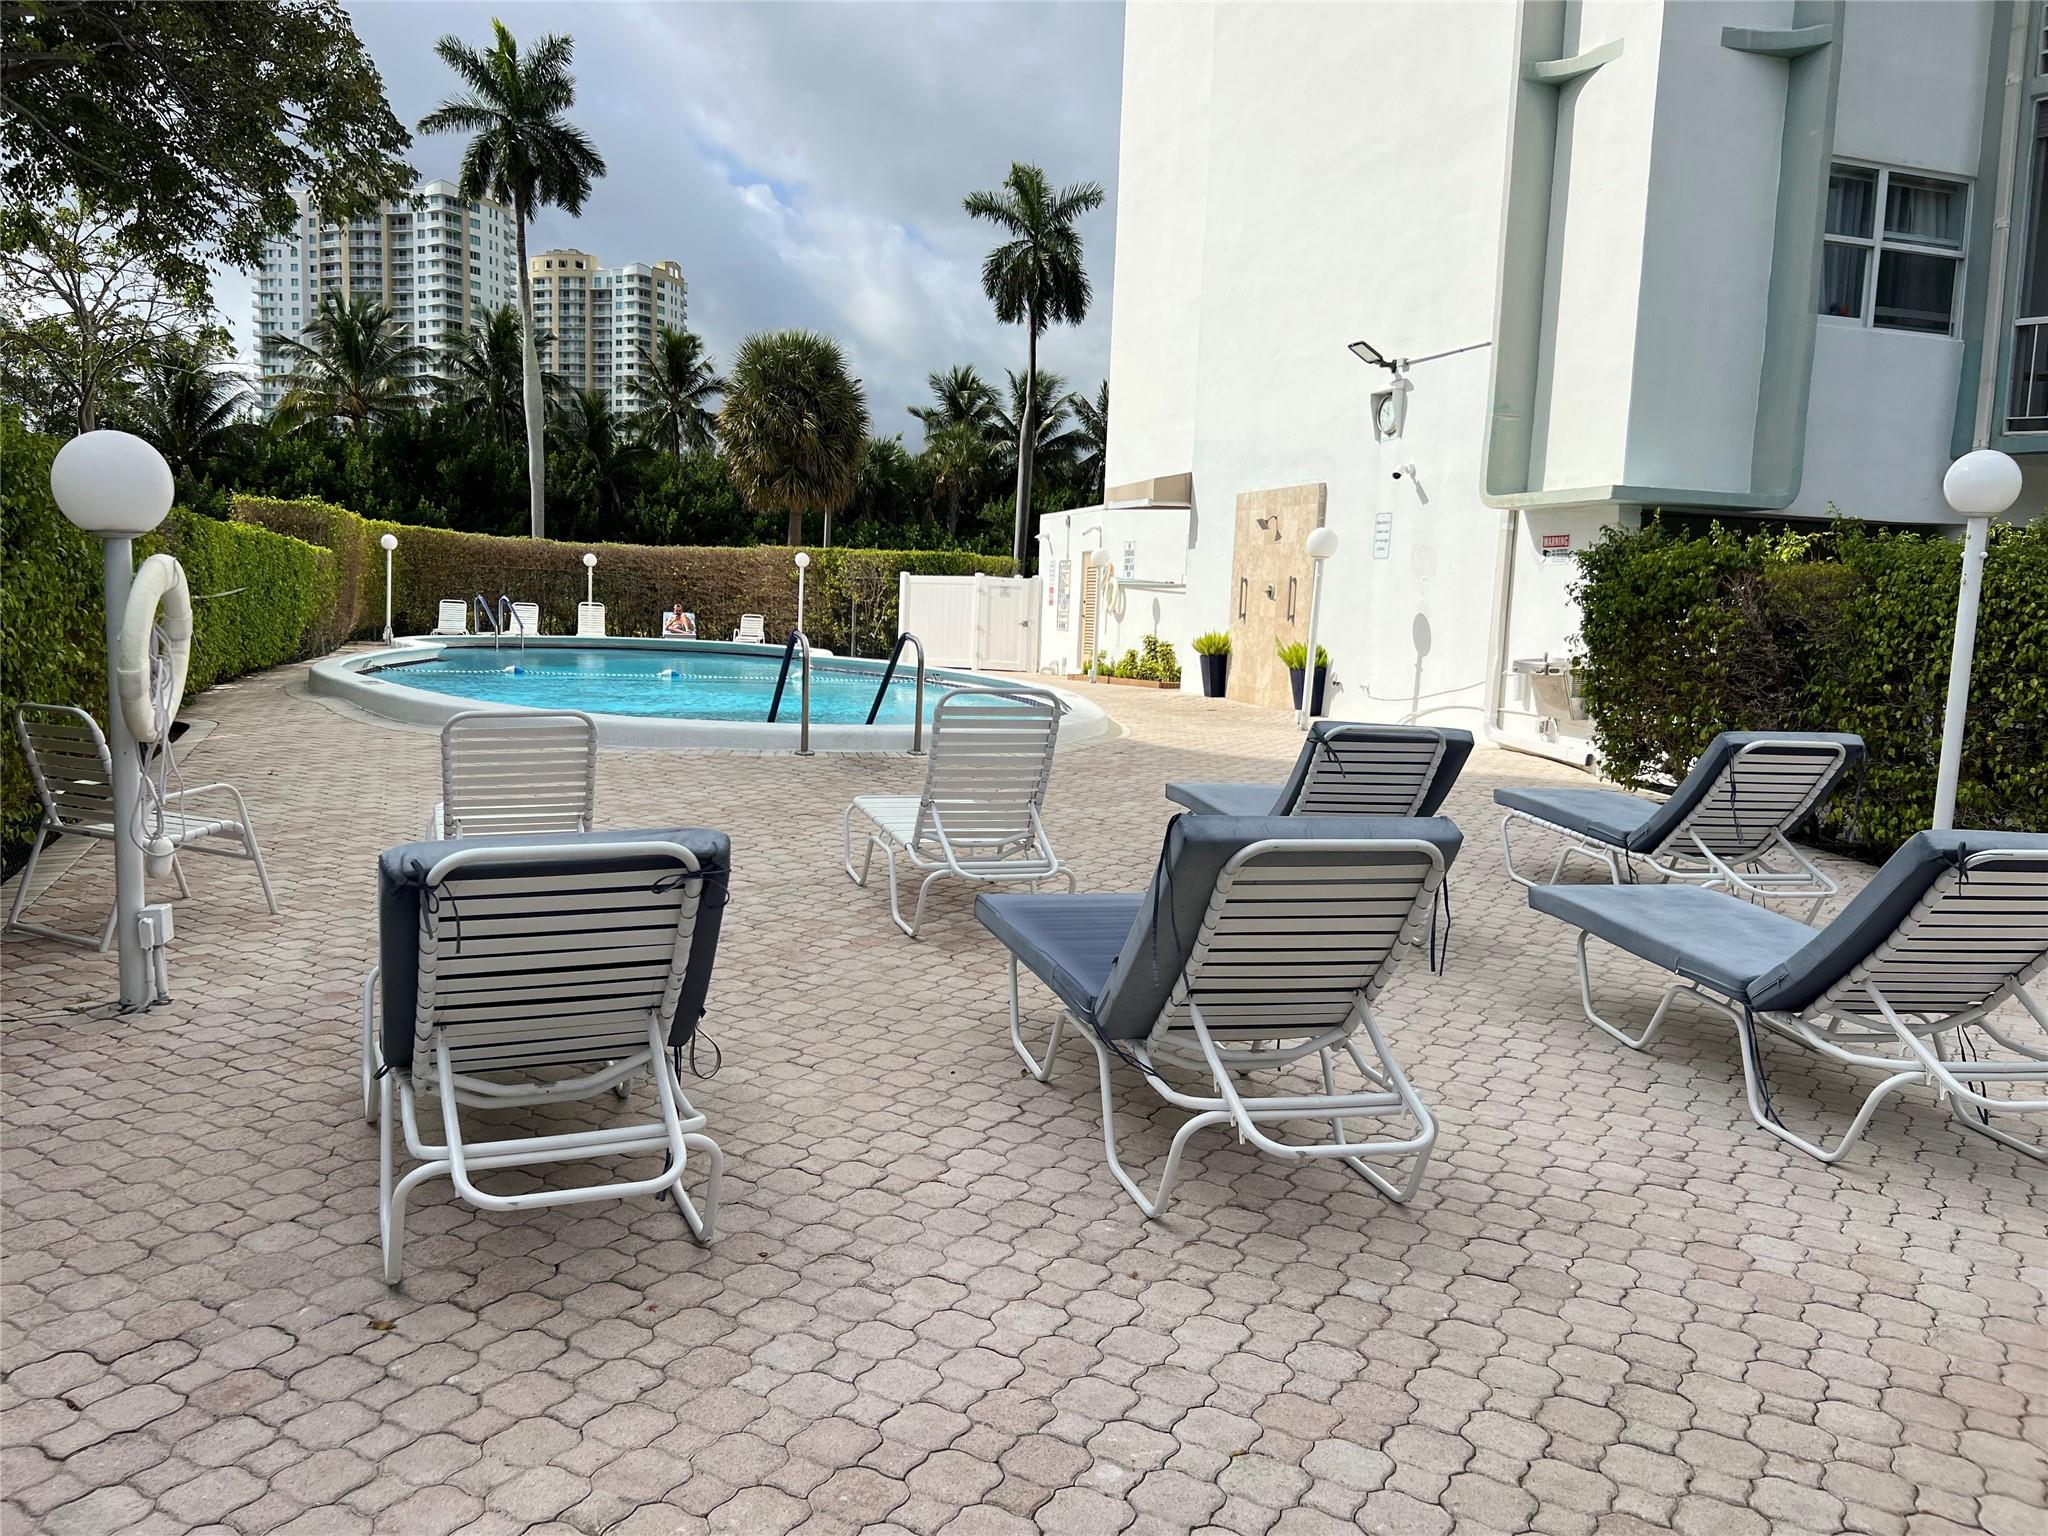
$305,000
2
bds
|
2
ba
|
1,100
sqft
|
built
1972
1833 S Ocean Dr, Hallandale Beach, FL 33009
$-1,273
Cash flow
-21.8%
Cash-on-Cash Return
1.3%
Cap rate
0.8%
Rent to Value Ratio
Active
$310,000
2
bds
|
2
ba
|
1,150
sqft
|
built
1970
200 Diplomat Pkwy, Hallandale Beach, FL 33009
$-1,277
Cash flow
-21.5%
Cash-on-Cash Return
1.3%
Cap rate
0.8%
Rent to Value Ratio
Active
$350,000
2
bds
|
2
ba
|
1,280
sqft
|
built
1978
2500 Parkview Dr, Hallandale Beach, FL 33009
$-1,809
Cash flow
-27.0%
Cash-on-Cash Return
0.1%
Cap rate
0.7%
Rent to Value Ratio
Active
$385,000
3
bds
|
2
ba
|
1,379
sqft
|
built
1970
121 Golden Isles Dr, Hallandale Beach, FL 33009
$-1,610
Cash flow
-21.8%
Cash-on-Cash Return
1.3%
Cap rate
0.8%
Rent to Value Ratio
Active
$374,000
2
bds
|
2
ba
|
1,150
sqft
|
built
1970
200 Diplomat Pkwy, Hallandale Beach, FL 33009
$-1,443
Cash flow
-20.1%
Cash-on-Cash Return
1.7%
Cap rate
0.7%
Rent to Value Ratio

Active
$650,000
3
bds
|
2
ba
|
1,624
sqft
|
built
1981
523 Leslie Dr, Hallandale Beach, FL 33009
$-1,855
Cash flow
-14.9%
Cash-on-Cash Return
2.9%
Cap rate
0.7%
Rent to Value Ratio
Active
$359,000
2
bds
|
2
ba
|
1,300
sqft
|
built
1970
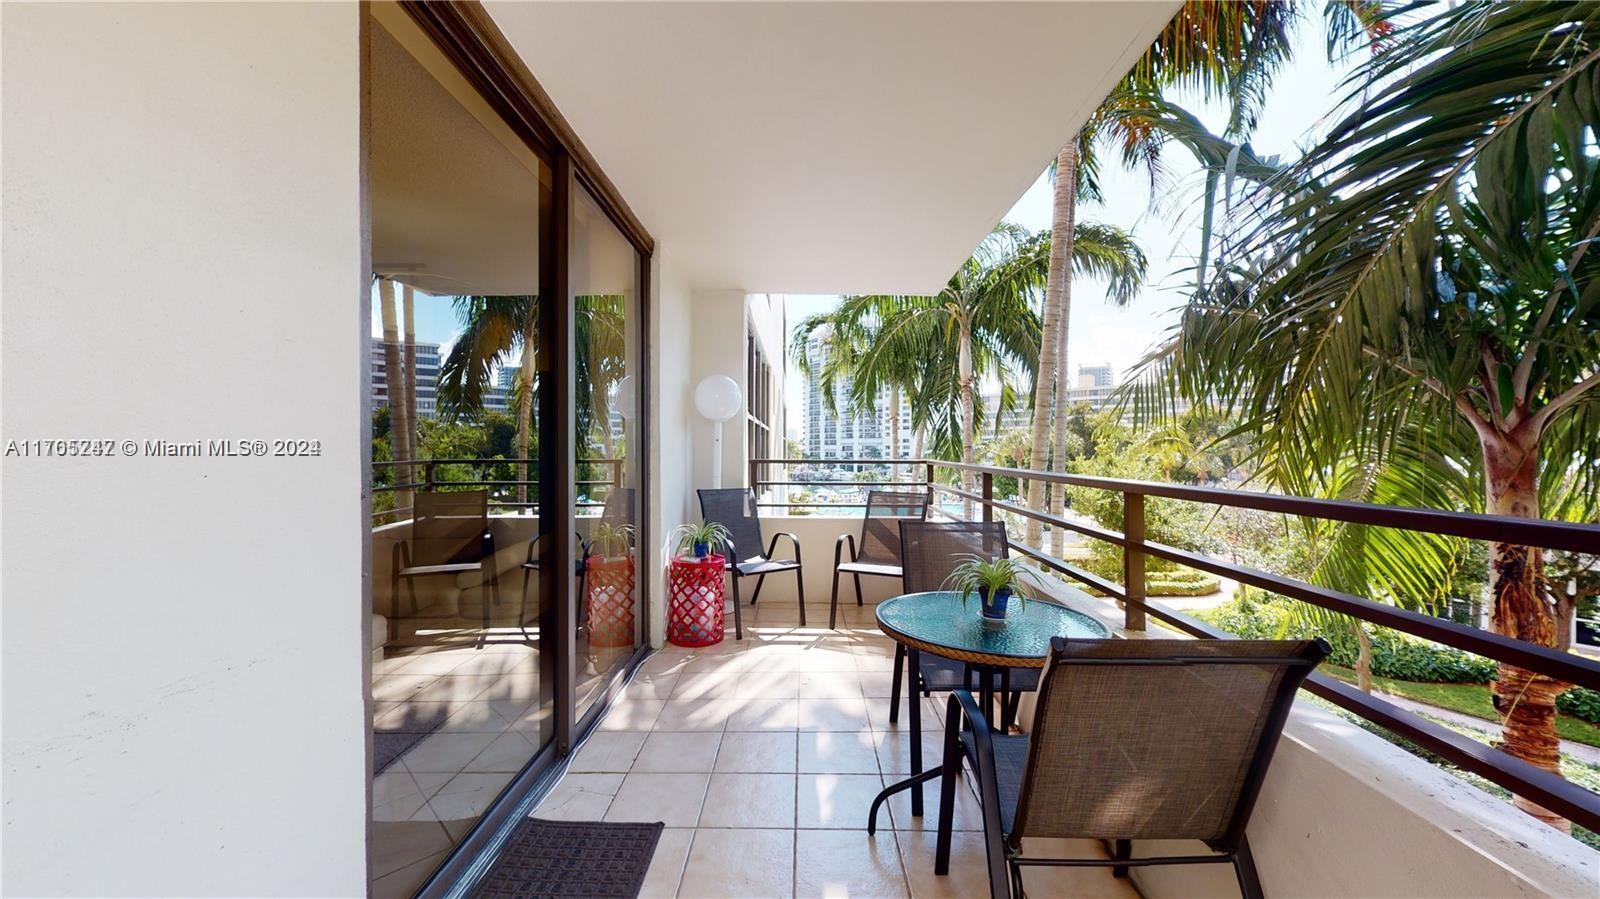
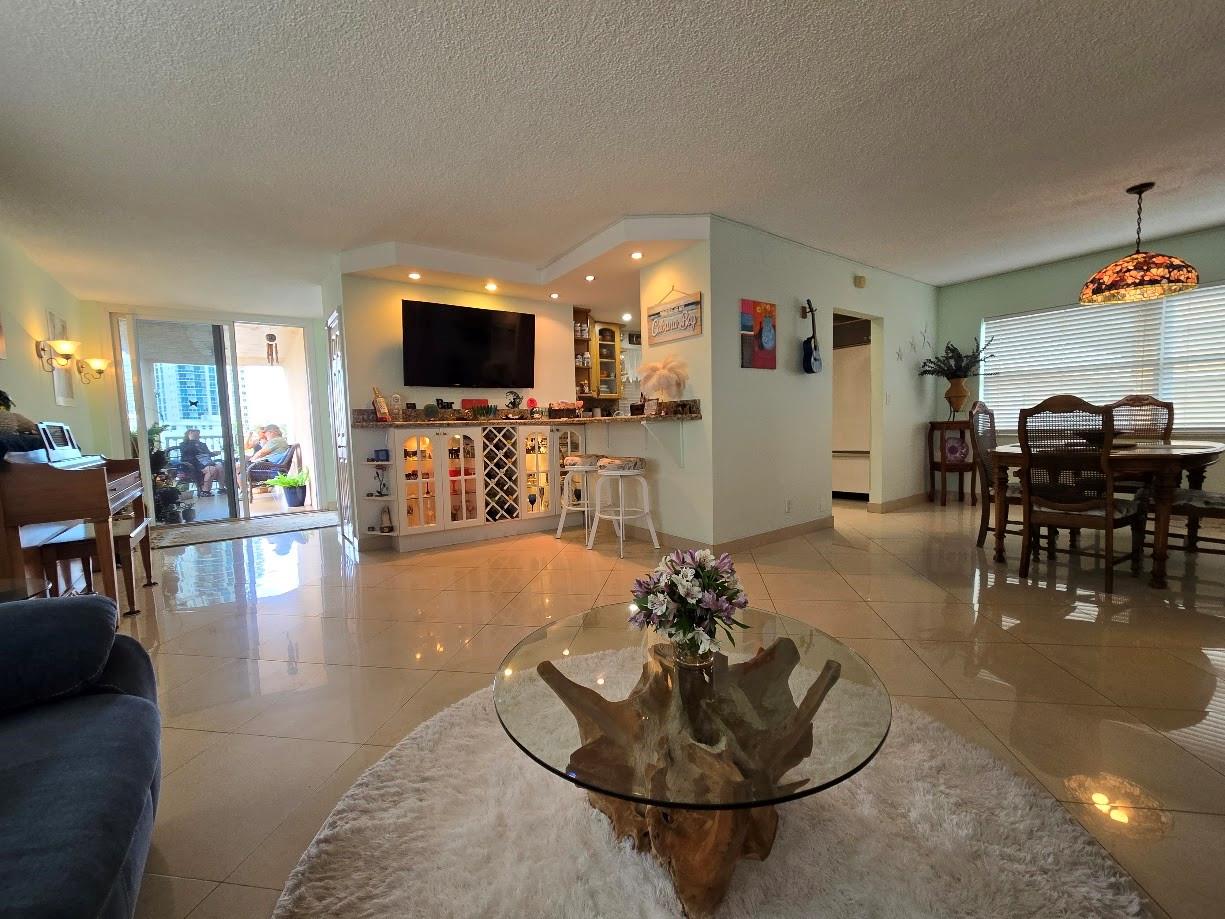
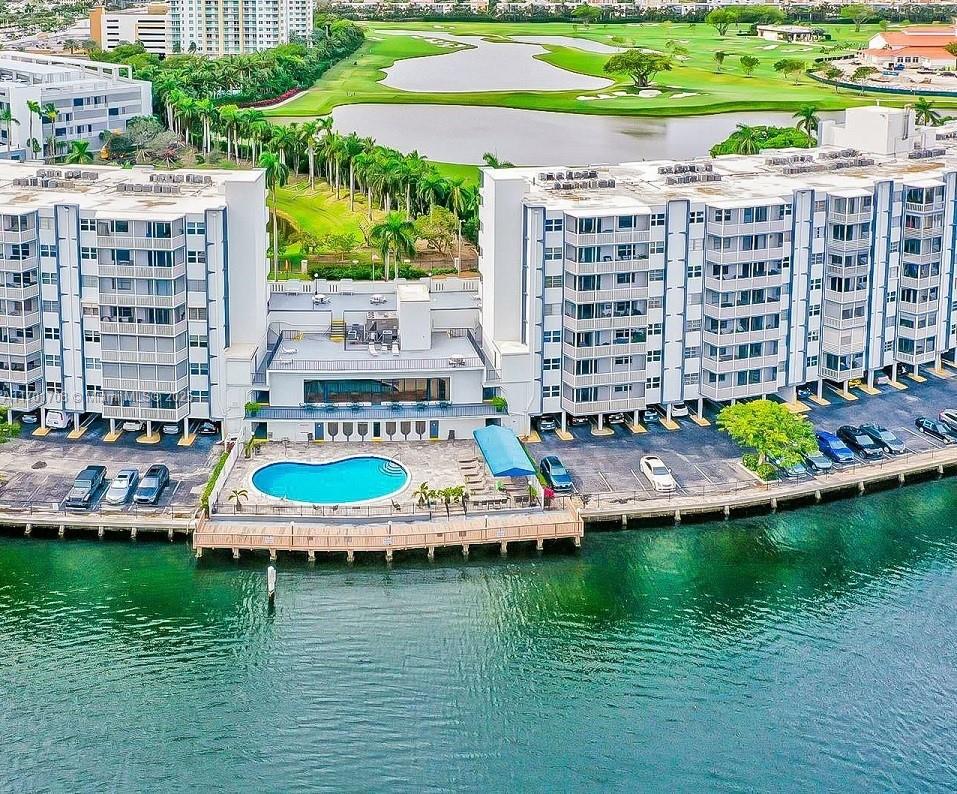
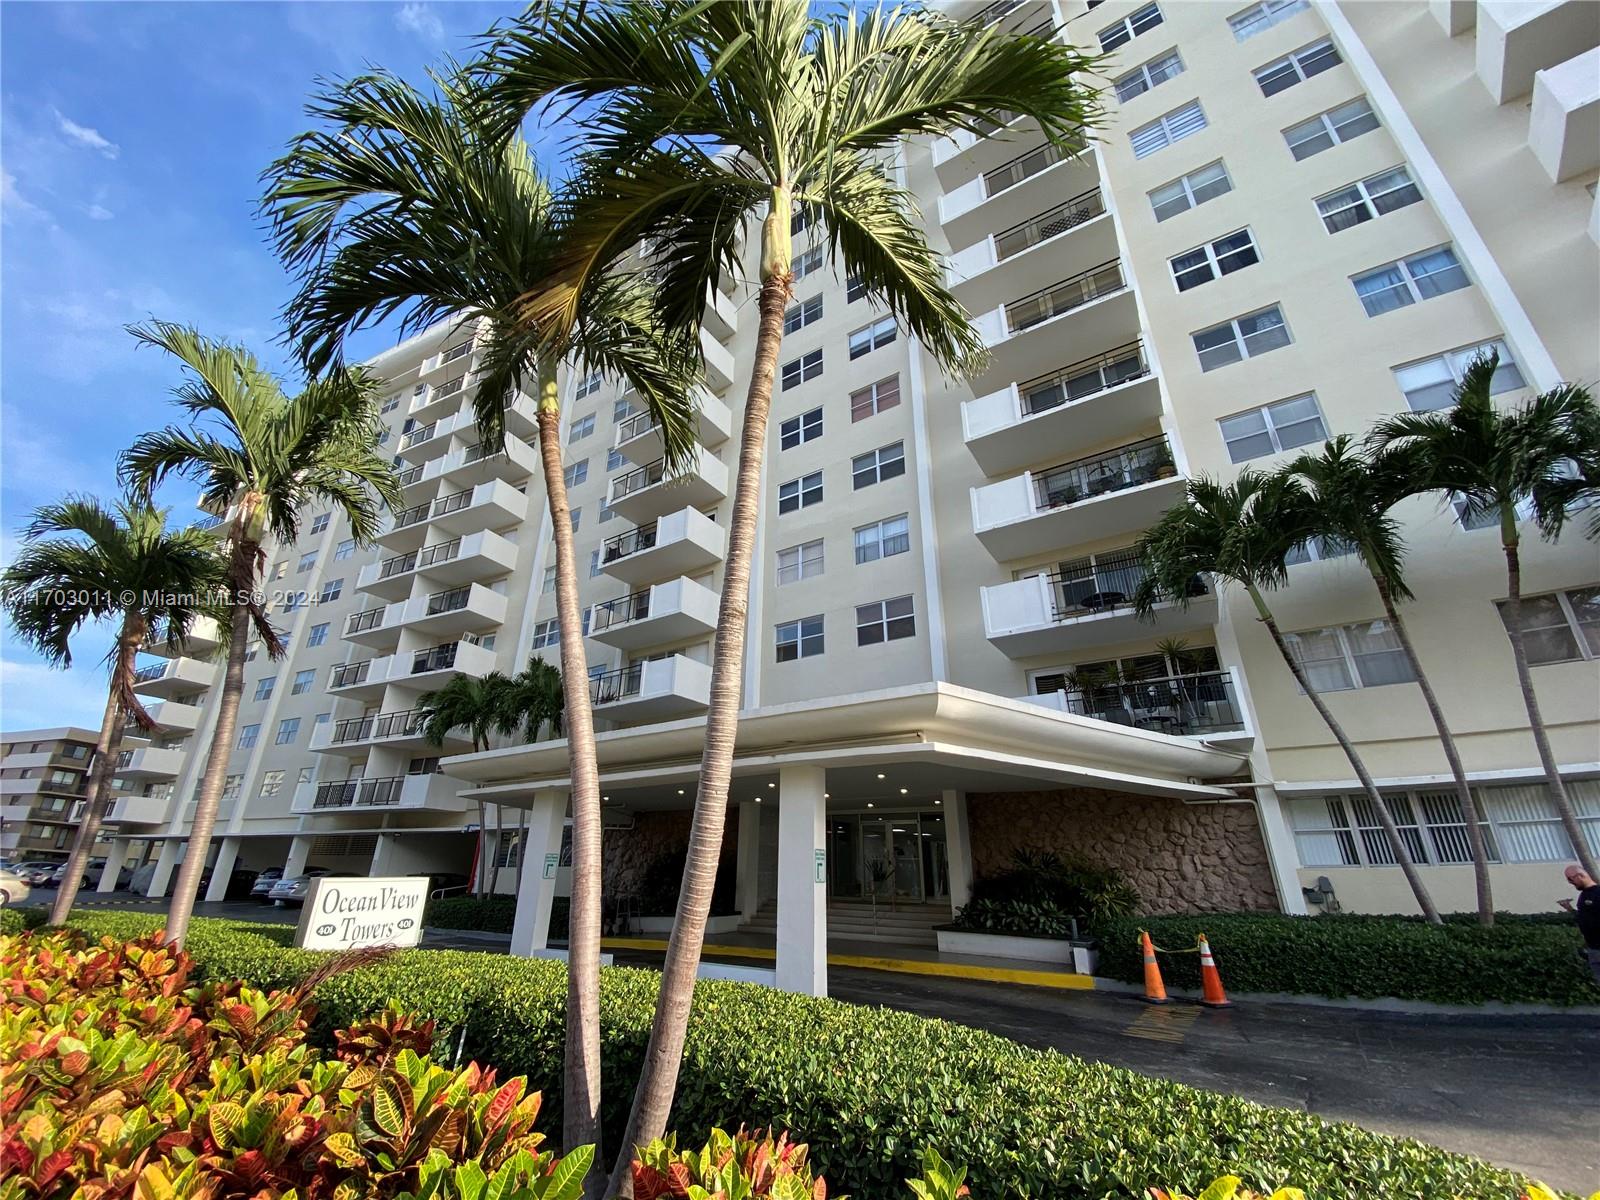
401 Golden Isles Dr, Hallandale Beach, FL 33009
$-1,586
Cash flow
-23.0%
Cash-on-Cash Return
1.0%
Cap rate
0.8%
Rent to Value Ratio
Active
$410,000
2
bds
|
2
ba
|
1,430
sqft
|
built
1976
800 Parkview Dr, Hallandale Beach, FL 33009
$-1,109
Cash flow
-14.1%
Cash-on-Cash Return
3.0%
Cap rate
0.9%
Rent to Value Ratio
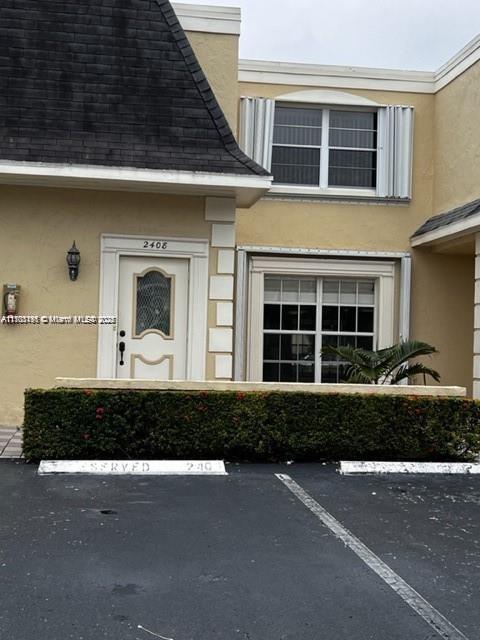
Active
$488,000
2
bds
|
3
ba
|
1,696
sqft
|
built
1977
2408 NE 10th St, Hallandale Beach, FL 33009
$-1,910
Cash flow
-20.4%
Cash-on-Cash Return
1.6%
Cap rate
0.7%
Rent to Value Ratio
Active
$375,000
2
bds
|
2
ba
|
1,340
sqft
|
built
1972
1985 S Ocean Dr, Hallandale Beach, FL 33009
$205
Cash flow
2.9%
Cash-on-Cash Return
6.9%
Cap rate
1.0%
Rent to Value Ratio
Active
$249,999
2
bds
|
2
ba
|
945
sqft
|
built
1980
1913 S Ocean Dr, Hallandale Beach, FL 33009
$-885
Cash flow
-18.5%
Cash-on-Cash Return
2.0%
Cap rate
0.9%
Rent to Value Ratio

Active
$375,000
2
bds
|
2
ba
|
1,200
sqft
|
built
1970
1849 S Ocean Dr, Hallandale Beach, FL 33009
$-1,121
Cash flow
-15.6%
Cash-on-Cash Return
2.7%
Cap rate
0.9%
Rent to Value Ratio
Active
$359,500
2
bds
|
2
ba
|
1,176
sqft
|
built
1970
1825 S Ocean Dr, Hallandale Beach, FL 33009
$-1,545
Cash flow
-22.4%
Cash-on-Cash Return
1.1%
Cap rate
0.7%
Rent to Value Ratio
Active
$359,900
1
bds
|
2
ba
|
896
sqft
|
built
1970
2030 S Ocean Dr, Hallandale Beach, FL 33009
$-2,041
Cash flow
-29.6%
Cash-on-Cash Return
-0.5%
Cap rate
0.6%
Rent to Value Ratio
Active
$368,000
1
bds
|
1
ba
|
798
sqft
|
built
1970
1965 S Ocean Dr, Hallandale Beach, FL 33009
$-1,321
Cash flow
-18.7%
Cash-on-Cash Return
2.0%
Cap rate
0.7%
Rent to Value Ratio
Active
$464,999
3
bds
|
2
ba
|
1,430
sqft
|
built
1979
600 Parkview Dr, Hallandale Beach, FL 33009
$-1,063
Cash flow
-11.9%
Cash-on-Cash Return
3.5%
Cap rate
0.8%
Rent to Value Ratio
Active
$299,900
2
bds
|
2
ba
|
1,025
sqft
|
built
1965
141 NE 10th Ave, Hallandale Beach, FL 33009
$-897
Cash flow
-15.6%
Cash-on-Cash Return
2.7%
Cap rate
0.8%
Rent to Value Ratio
Active
$479,000
2
bds
|
2
ba
|
1,425
sqft
|
built
2007
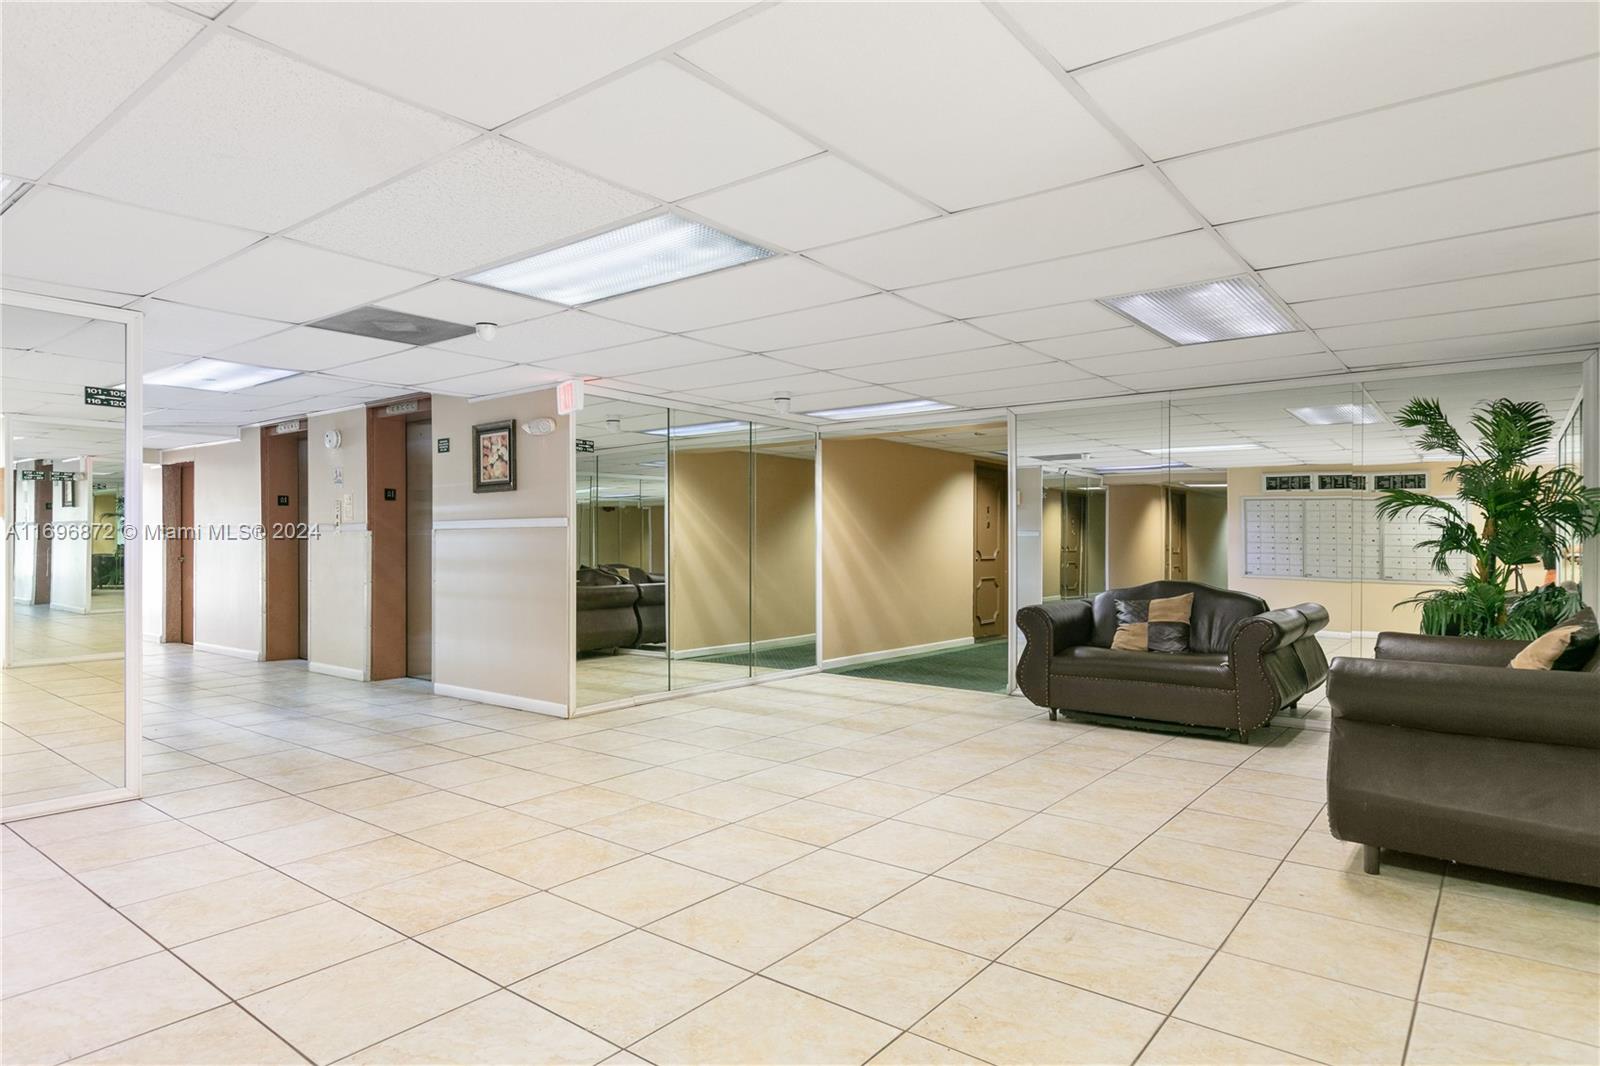
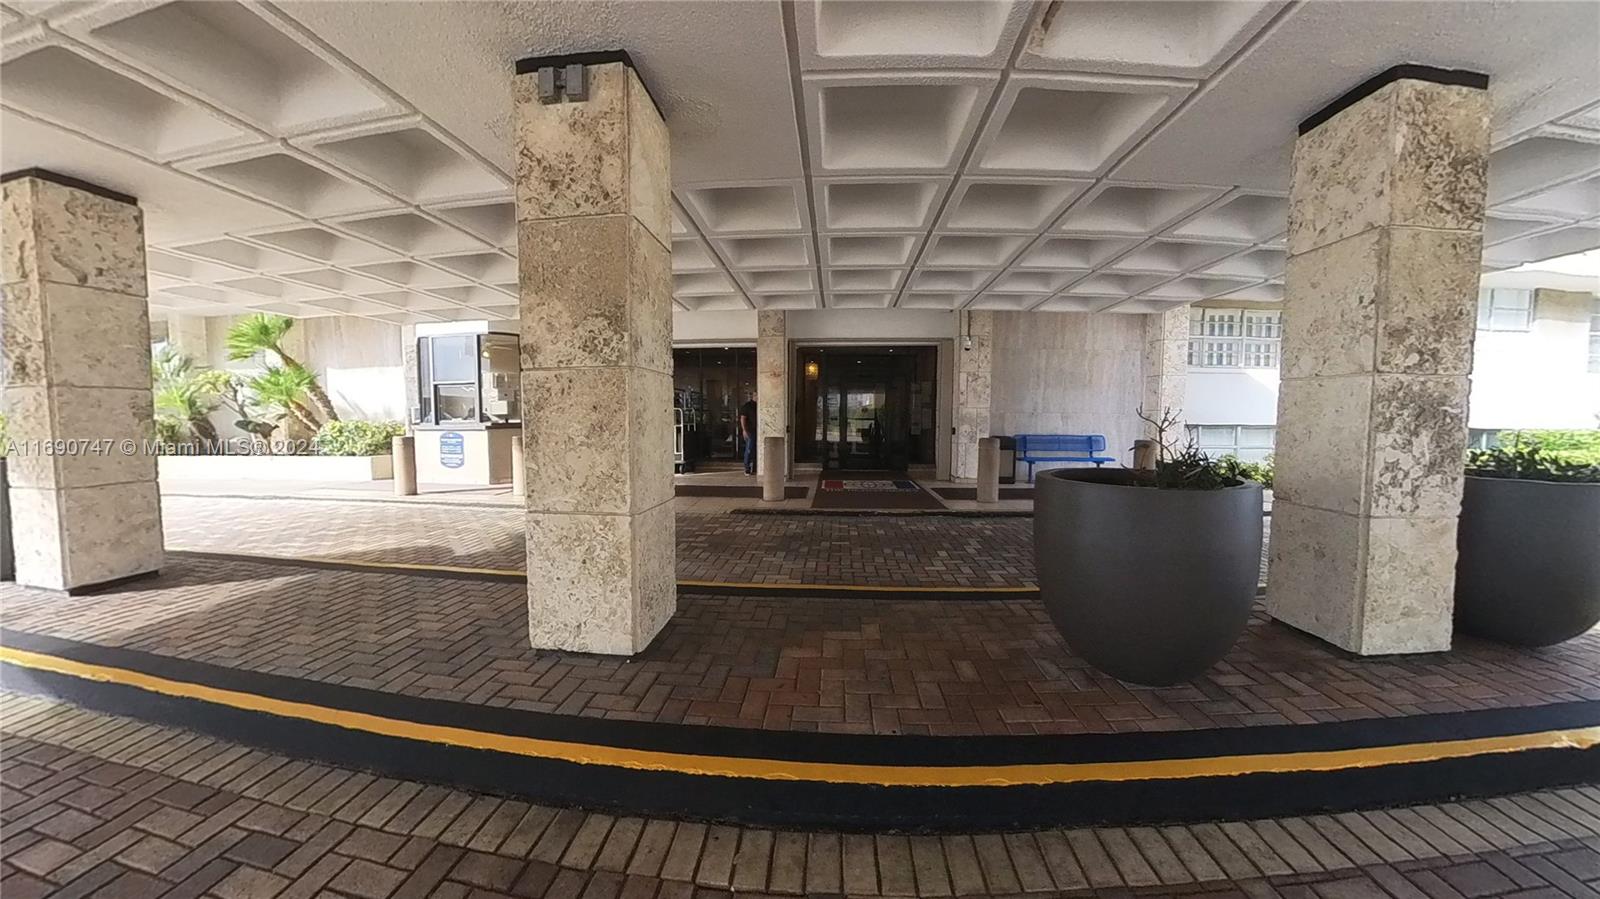
1745 E Hallandale Beach Blvd, Hallandale Beach, FL 33009
$-2,469
Cash flow
-26.9%
Cash-on-Cash Return
0.1%
Cap rate
0.7%
Rent to Value Ratio
Active
$199,000
1
bds
|
1
ba
|
730
sqft
|
built
1972
500 NE 12th Ave, Hallandale Beach, FL 33009
$-215
Cash flow
-5.6%
Cash-on-Cash Return
5.0%
Cap rate
1.2%
Rent to Value Ratio
Active
$320,000
1
bds
|
2
ba
|
1,300
sqft
|
built
1974
1865 S Ocean Dr, Hallandale Beach, FL 33009
$-1,214
Cash flow
-19.8%
Cash-on-Cash Return
1.7%
Cap rate
0.9%
Rent to Value Ratio
Active
$359,000
1
bds
|
2
ba
|
950
sqft
|
built
1980
2500 Parkview Dr, Hallandale Beach, FL 33009
$-1,434
Cash flow
-20.8%
Cash-on-Cash Return
1.5%
Cap rate
0.7%
Rent to Value Ratio

Active
$240,000
1
bds
|
2
ba
|
915
sqft
|
built
1976
800 Parkview Dr, Hallandale Beach, FL 33009
$-786
Cash flow
-17.1%
Cash-on-Cash Return
2.4%
Cap rate
0.9%
Rent to Value Ratio
Active
$425,000
2
bds
|
2
ba
|
1,248
sqft
|
built
1970
2030 S Ocean Dr, Hallandale Beach, FL 33009
$-1,885
Cash flow
-23.1%
Cash-on-Cash Return
1.0%
Cap rate
0.8%
Rent to Value Ratio

Active
$290,000
1
bds
|
2
ba
|
850
sqft
|
built
1970
300 Diplomat Pkwy, Hallandale Beach, FL 33009
$-1,111
Cash flow
-20.0%
Cash-on-Cash Return
1.7%
Cap rate
0.9%
Rent to Value Ratio
Active
$235,000
1
bds
|
2
ba
|
1,100
sqft
|
built
1974
2101 Atlantic Shores Blvd, Hallandale Beach, FL 33009
$-767
Cash flow
-17.0%
Cash-on-Cash Return
2.4%
Cap rate
0.9%
Rent to Value Ratio
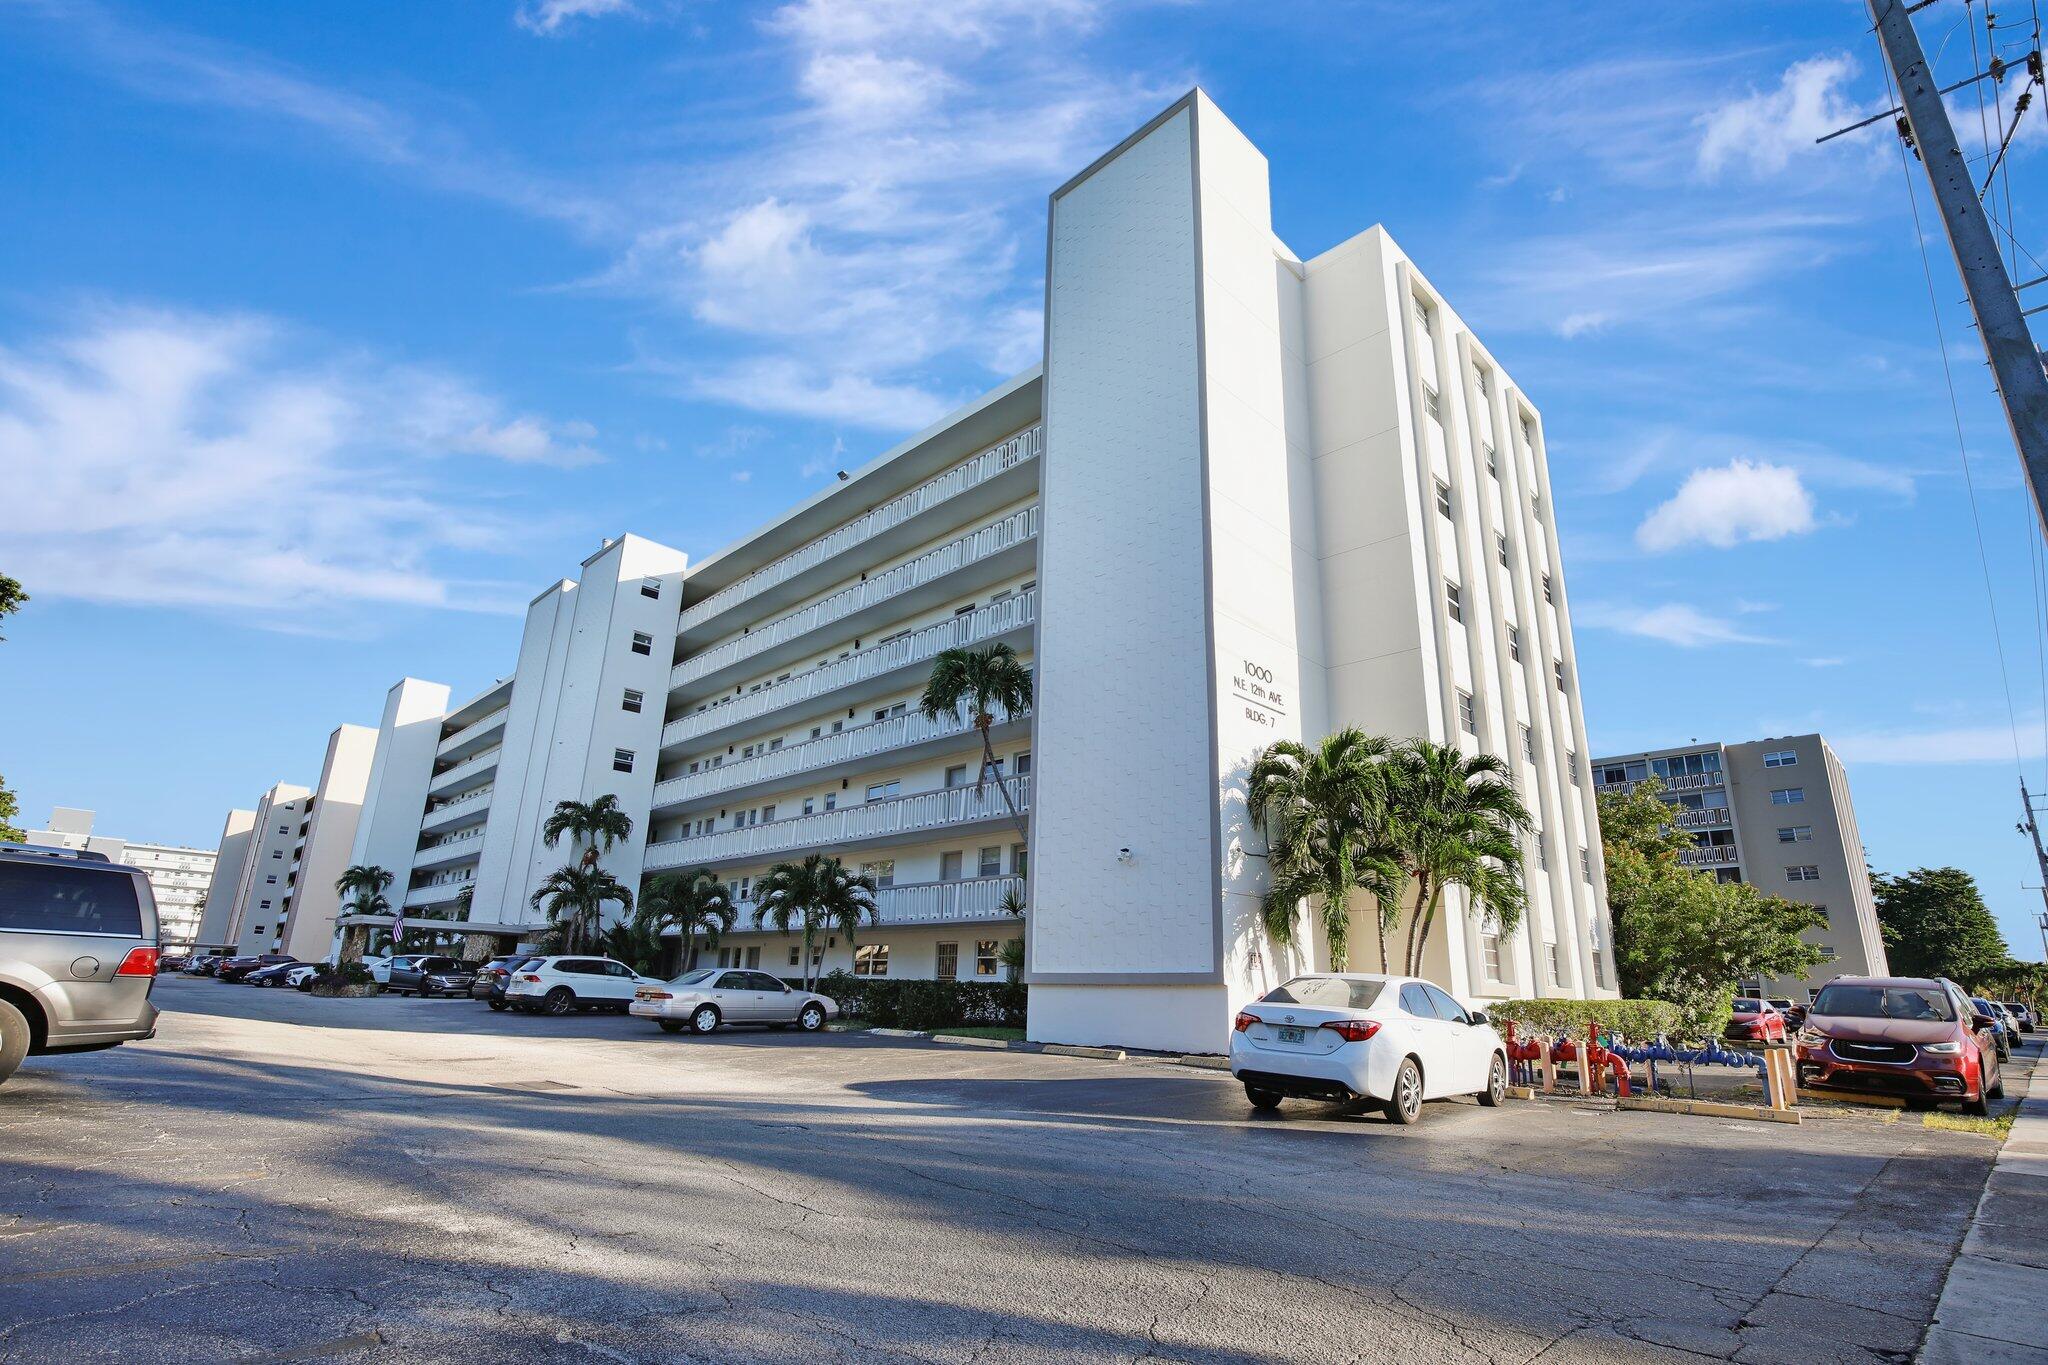
Active
$188,000
1
bds
|
1
ba
|
730
sqft
|
built
1973
1000 NE 12th Ave, Hallandale Beach, FL 33009
$-422
Cash flow
-11.7%
Cash-on-Cash Return
3.6%
Cap rate
1.0%
Rent to Value Ratio
Active
$699,900
4
bds
|
3
ba
|
1,577
sqft
|
built
2015
2600 E Hallandale Beach Blvd, Hallandale Beach, FL 33009
$-2,831
Cash flow
-21.1%
Cash-on-Cash Return
1.4%
Cap rate
0.7%
Rent to Value Ratio
Active
$265,000
1
bds
|
2
ba
|
878
sqft
|
built
1970
437 Golden Isles Dr, Hallandale Beach, FL 33009
$-653
Cash flow
-12.9%
Cash-on-Cash Return
3.3%
Cap rate
0.9%
Rent to Value Ratio
Active
$750,000
3
bds
|
3
ba
|
2,083
sqft
|
built
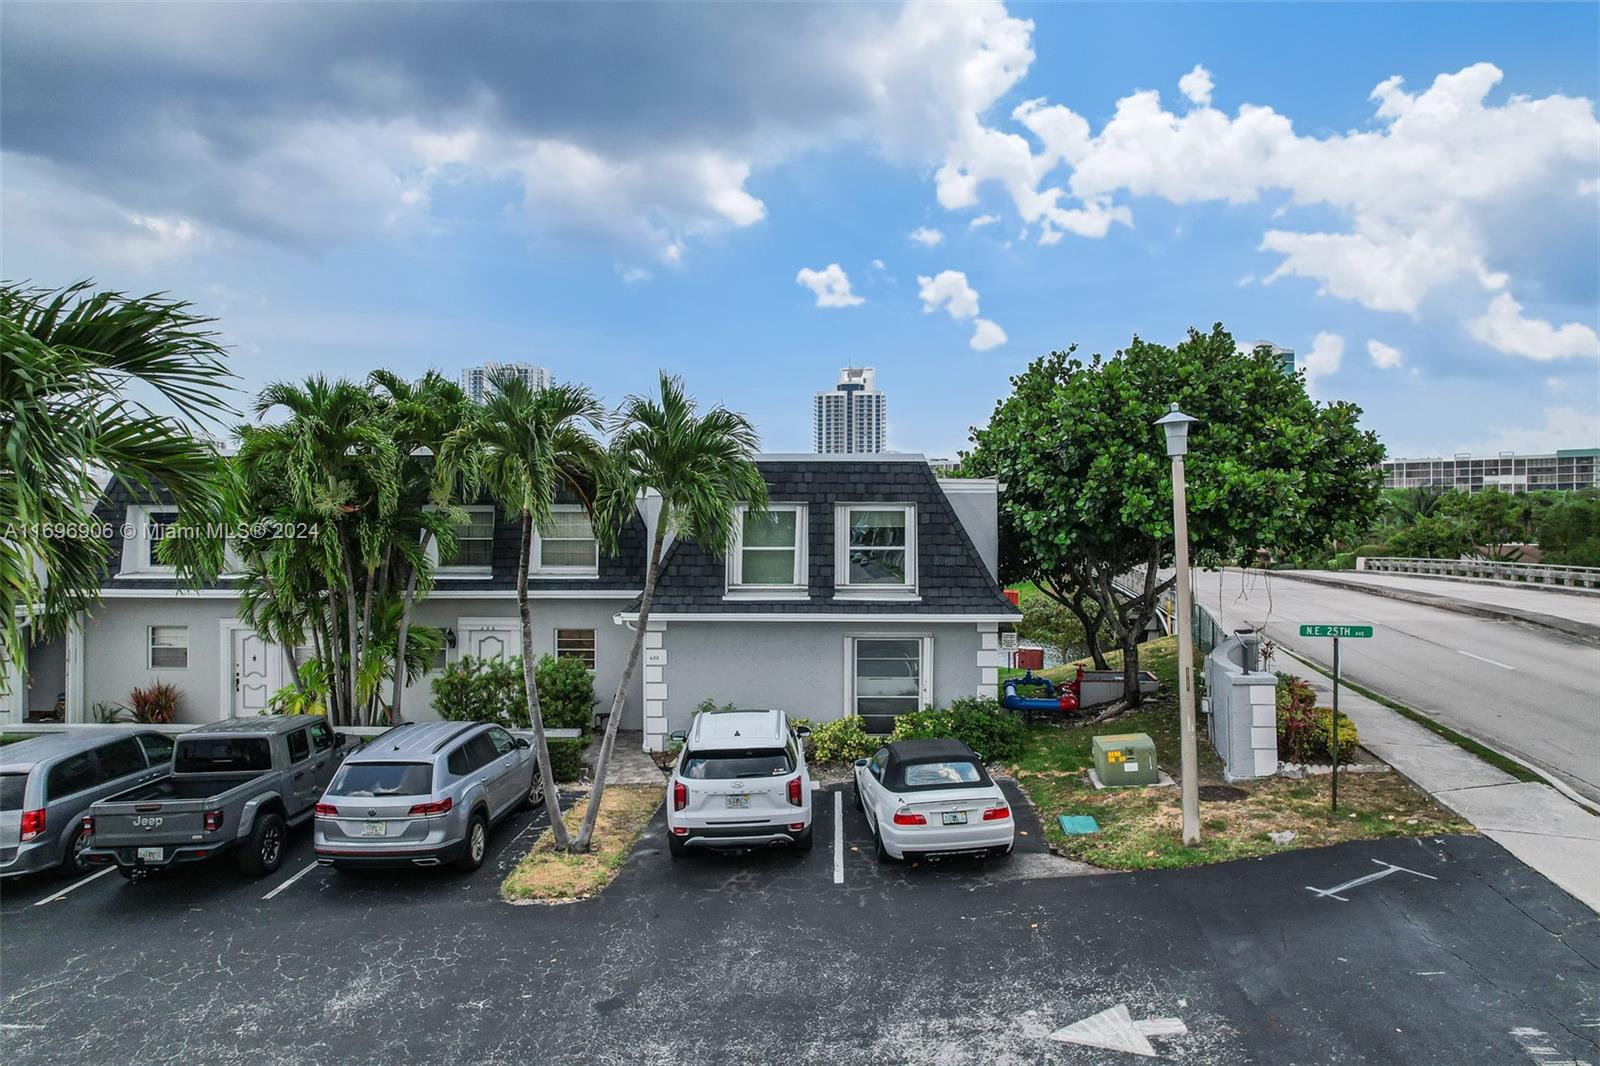
1976
600 NE 25th Ave, Hallandale Beach, FL 33009
$-1,741
Cash flow
-12.1%
Cash-on-Cash Return
3.5%
Cap rate
0.7%
Rent to Value Ratio

Active
$349,900
3
bds
|
3
ba
|
1,600
sqft
|
built
1984
1900 Diana Dr, Hallandale Beach, FL 33009
$-1,979
Cash flow
-29.5%
Cash-on-Cash Return
-0.5%
Cap rate
0.9%
Rent to Value Ratio
Active
$399,900
2
bds
|
2
ba
|
965
sqft
|
built
1970
1849 S Ocean Dr, Hallandale Beach, FL 33009
$-1,345
Cash flow
-17.5%
Cash-on-Cash Return
2.2%
Cap rate
0.7%
Rent to Value Ratio
Active
$369,000
2
bds
|
2
ba
|
1,171
sqft
|
built
1970
1965 S Ocean Dr, Hallandale Beach, FL 33009
$-1,345
Cash flow
-19.0%
Cash-on-Cash Return
1.9%
Cap rate
0.8%
Rent to Value Ratio
Active
$729,000
2
bds
|
2
ba
|
1,112
sqft
|
built
2007
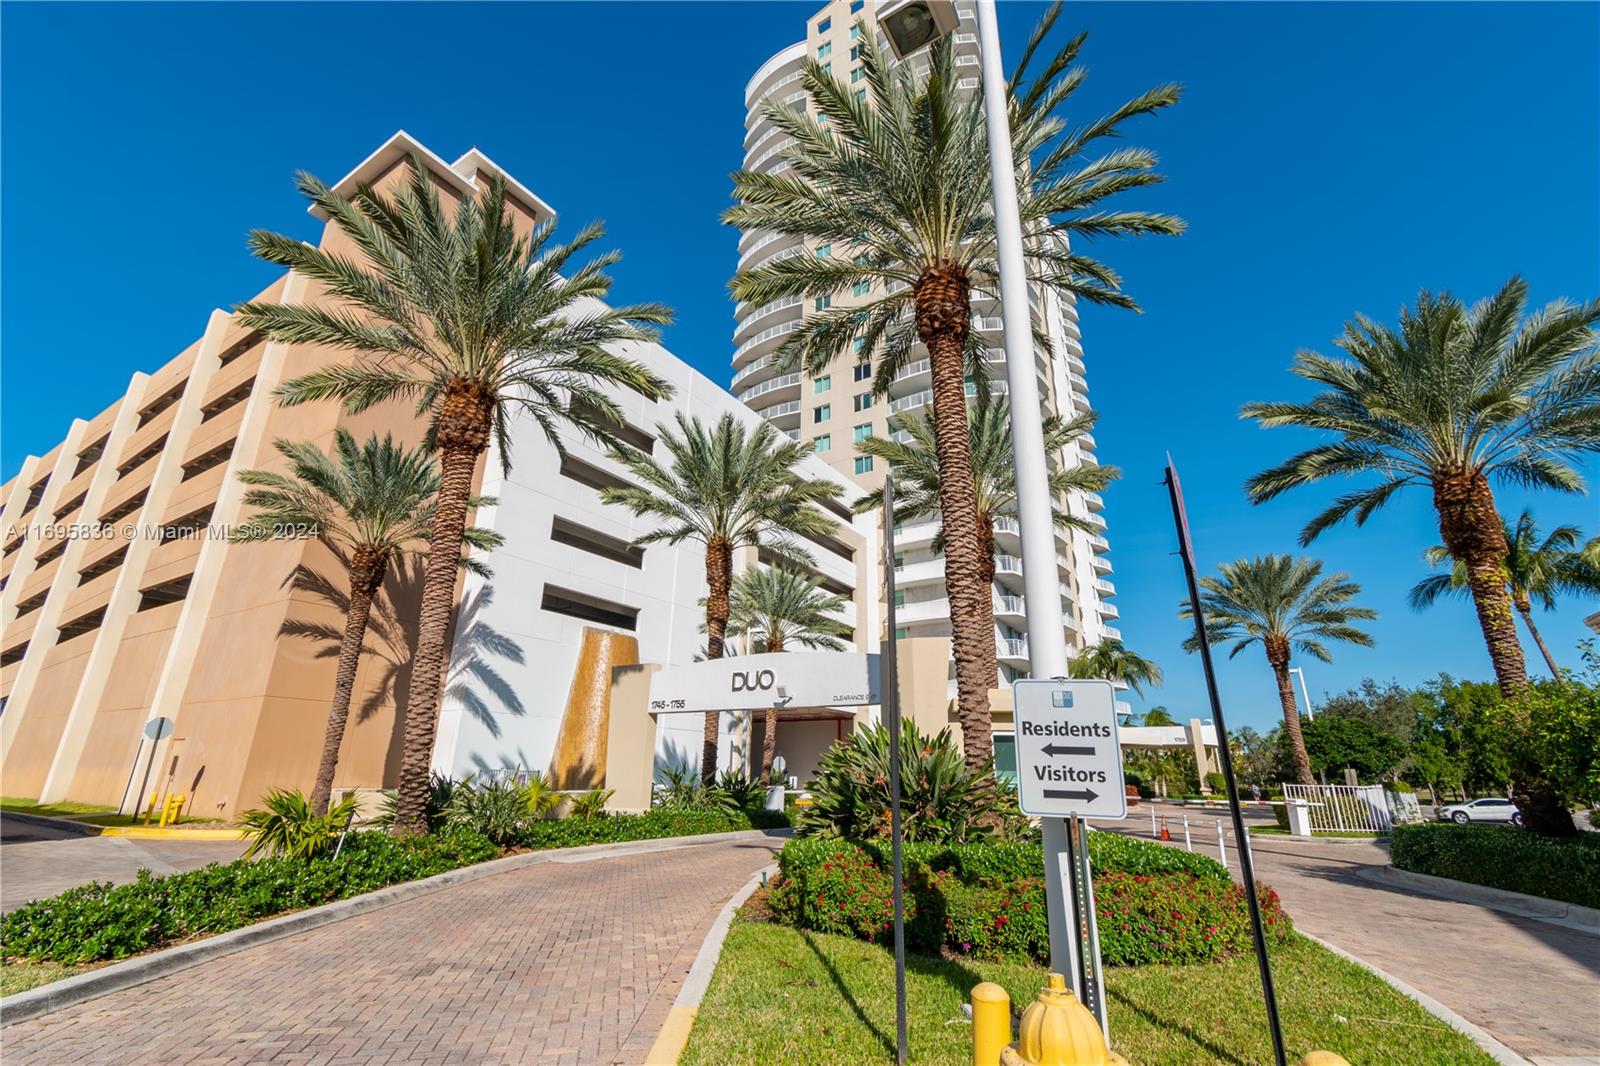
1945 S Ocean Dr, Hallandale Beach, FL 33009
$-3,442
Cash flow
-24.6%
Cash-on-Cash Return
0.6%
Cap rate
0.4%
Rent to Value Ratio
Active
$222,000
1
bds
|
2
ba
|
924
sqft
|
built
1974
2000 Atlantic Shores Blvd, Hallandale Beach, FL 33009
$-256
Cash flow
-6.0%
Cash-on-Cash Return
4.9%
Cap rate
1.0%
Rent to Value Ratio
Active
$320,000
1
bds
|
1
ba
|
798
sqft
|
built
1970
1965 S Ocean Dr, Hallandale Beach, FL 33009
$-763
Cash flow
-12.4%
Cash-on-Cash Return
3.4%
Cap rate
0.9%
Rent to Value Ratio
Active
$299,000
1
bds
|
2
ba
|
915
sqft
|
built
2007
1745 E Hallandale Beach Blvd, Hallandale Beach, FL 33009
$-1,423
Cash flow
-24.8%
Cash-on-Cash Return
0.6%
Cap rate
0.8%
Rent to Value Ratio
Active
$770,999
bds
|
0
ba
|
2,100
sqft
|
built
1978
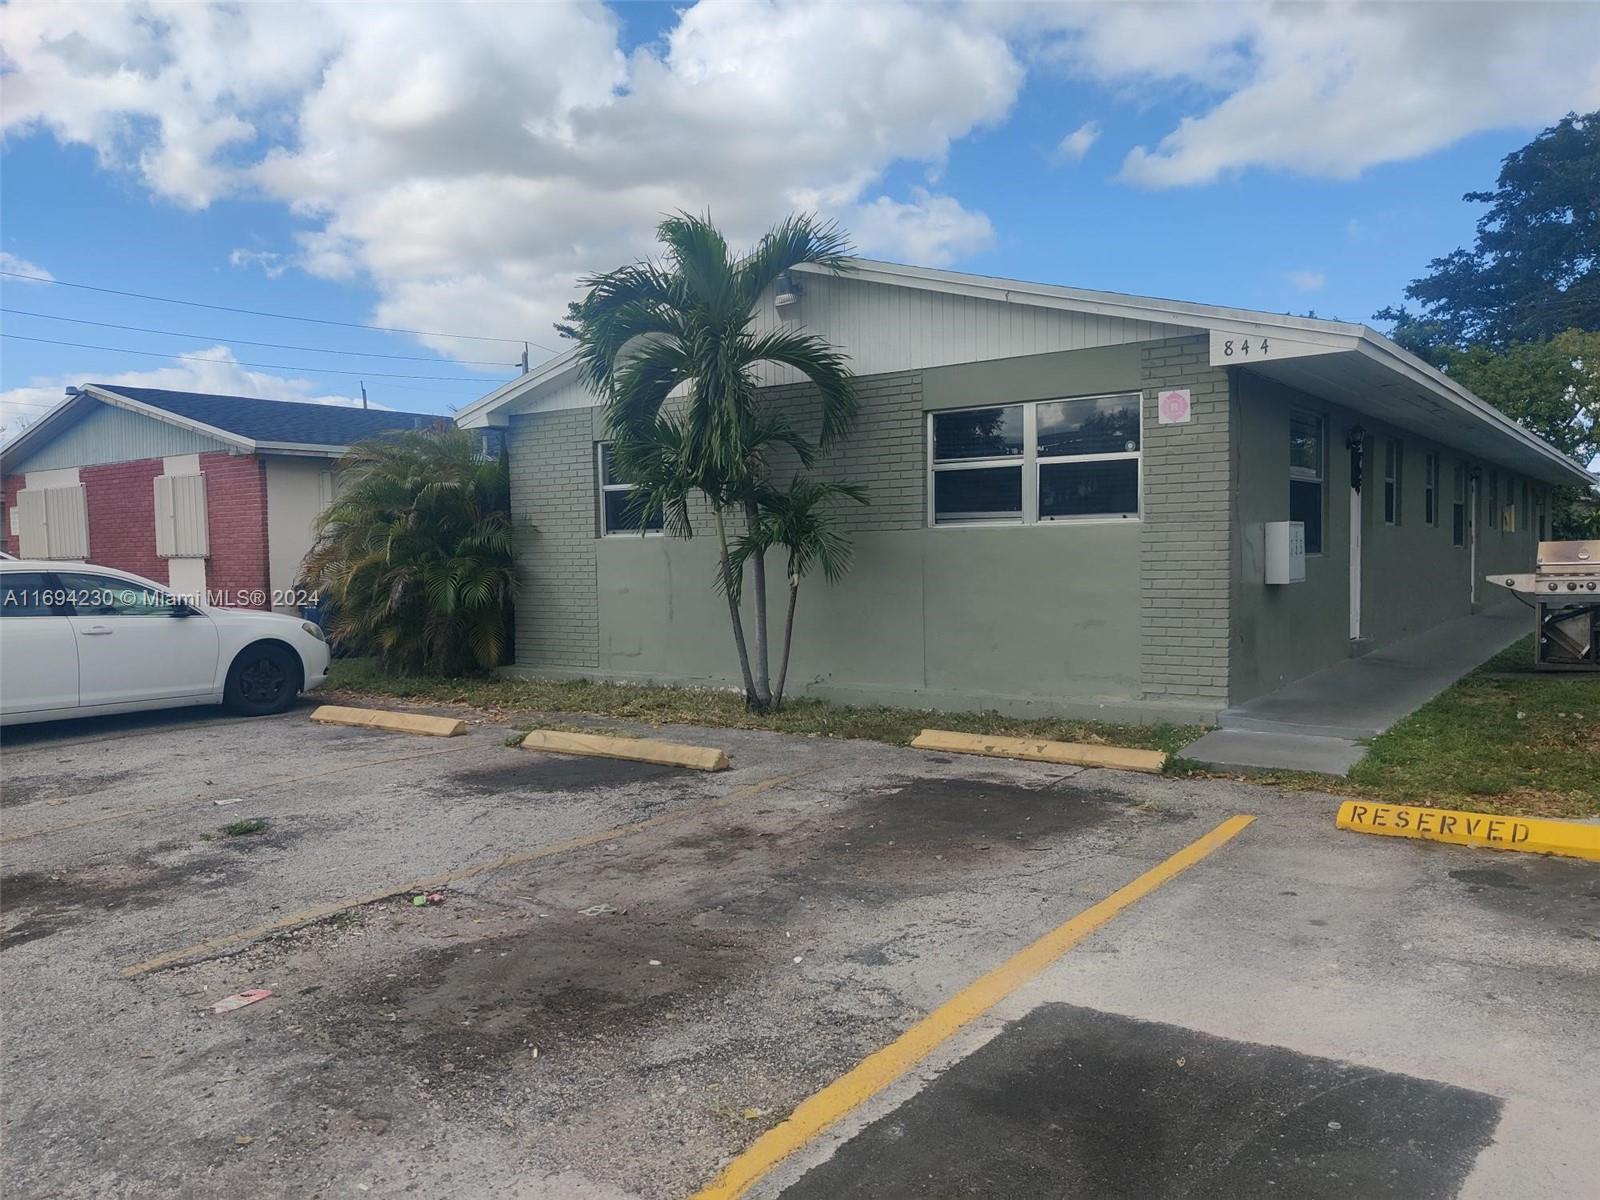
844 SW 10th St, Hallandale Beach, FL 33009
$-3,545
Cash flow
-24.0%
Cash-on-Cash Return
0.8%
Cap rate
0.3%
Rent to Value Ratio
Active
$207,000
2
bds
|
1
ba
|
924
sqft
|
built
1974
2000 Atlantic Shores Blvd, Hallandale Beach, FL 33009
$-715
Cash flow
-18.0%
Cash-on-Cash Return
2.1%
Cap rate
1.0%
Rent to Value Ratio

Active
$290,000
2
bds
|
2
ba
|
1,200
sqft
|
built
1970
401 Golden Isles Dr, Hallandale Beach, FL 33009
$-1,469
Cash flow
-26.4%
Cash-on-Cash Return
0.2%
Cap rate
0.7%
Rent to Value Ratio