Hallandale Beach, FL Investment Properties for Sale
Browse homes for sale and investment properties in Hallandale Beach, FL. Refine your search by price, property type, or more.
Best cash flowing properties in Hallandale Beach, FL

Pending
$225,000
1
bds
|
2
ba
|
850
sqft
|
built
1976
3113 S Ocean Dr, Hallandale Beach, FL 33009
$-28
Cash flow
-0.6%
Cash-on-Cash Return
6.0%
Cap rate
1.1%
Rent to Value Ratio

Active
$295,000
2
bds
|
2
ba
|
1,250
sqft
|
built
1968
111 Golden Isles Dr, Hallandale Beach, FL 33009
$-143
Cash flow
-2.5%
Cash-on-Cash Return
5.6%
Cap rate
0.8%
Rent to Value Ratio
833 out of 931 properties for sale in Hallandale Beach, FL
Limited Results Shown
Create a free account, or log in to reveal all property listings and enjoy the complete experience.
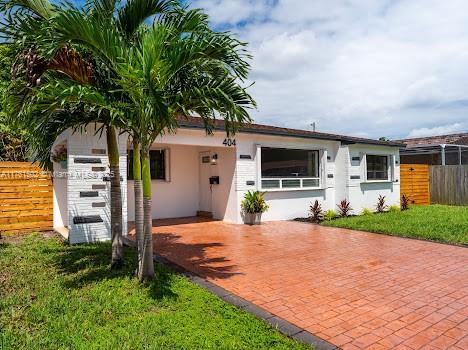
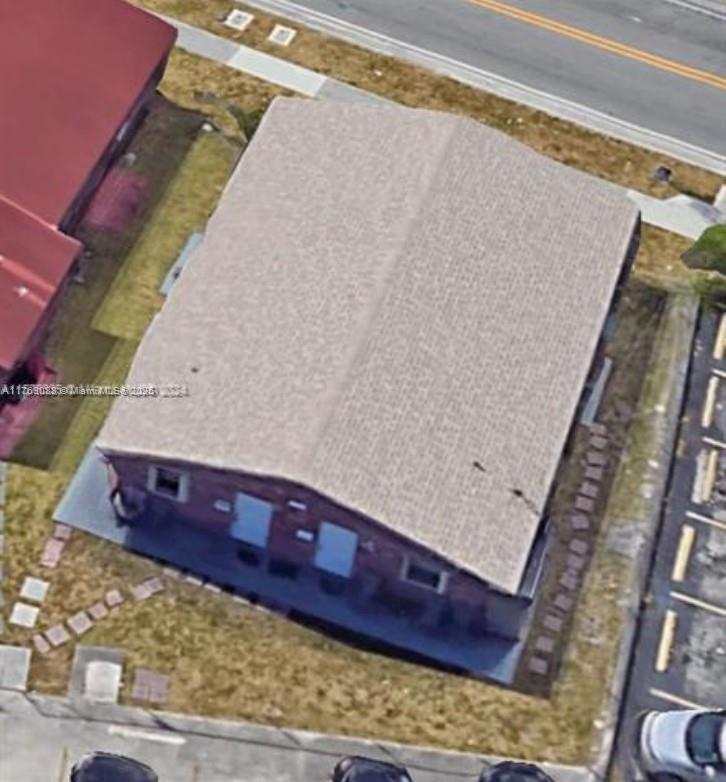
Active
$575,000
3
bds
|
2
ba
|
1,230
sqft
|
built
1958
404 SW 4th Ter, Hallandale Beach, FL 33009
$-729
Cash flow
-6.6%
Cash-on-Cash Return
4.6%
Cap rate
0.7%
Rent to Value Ratio
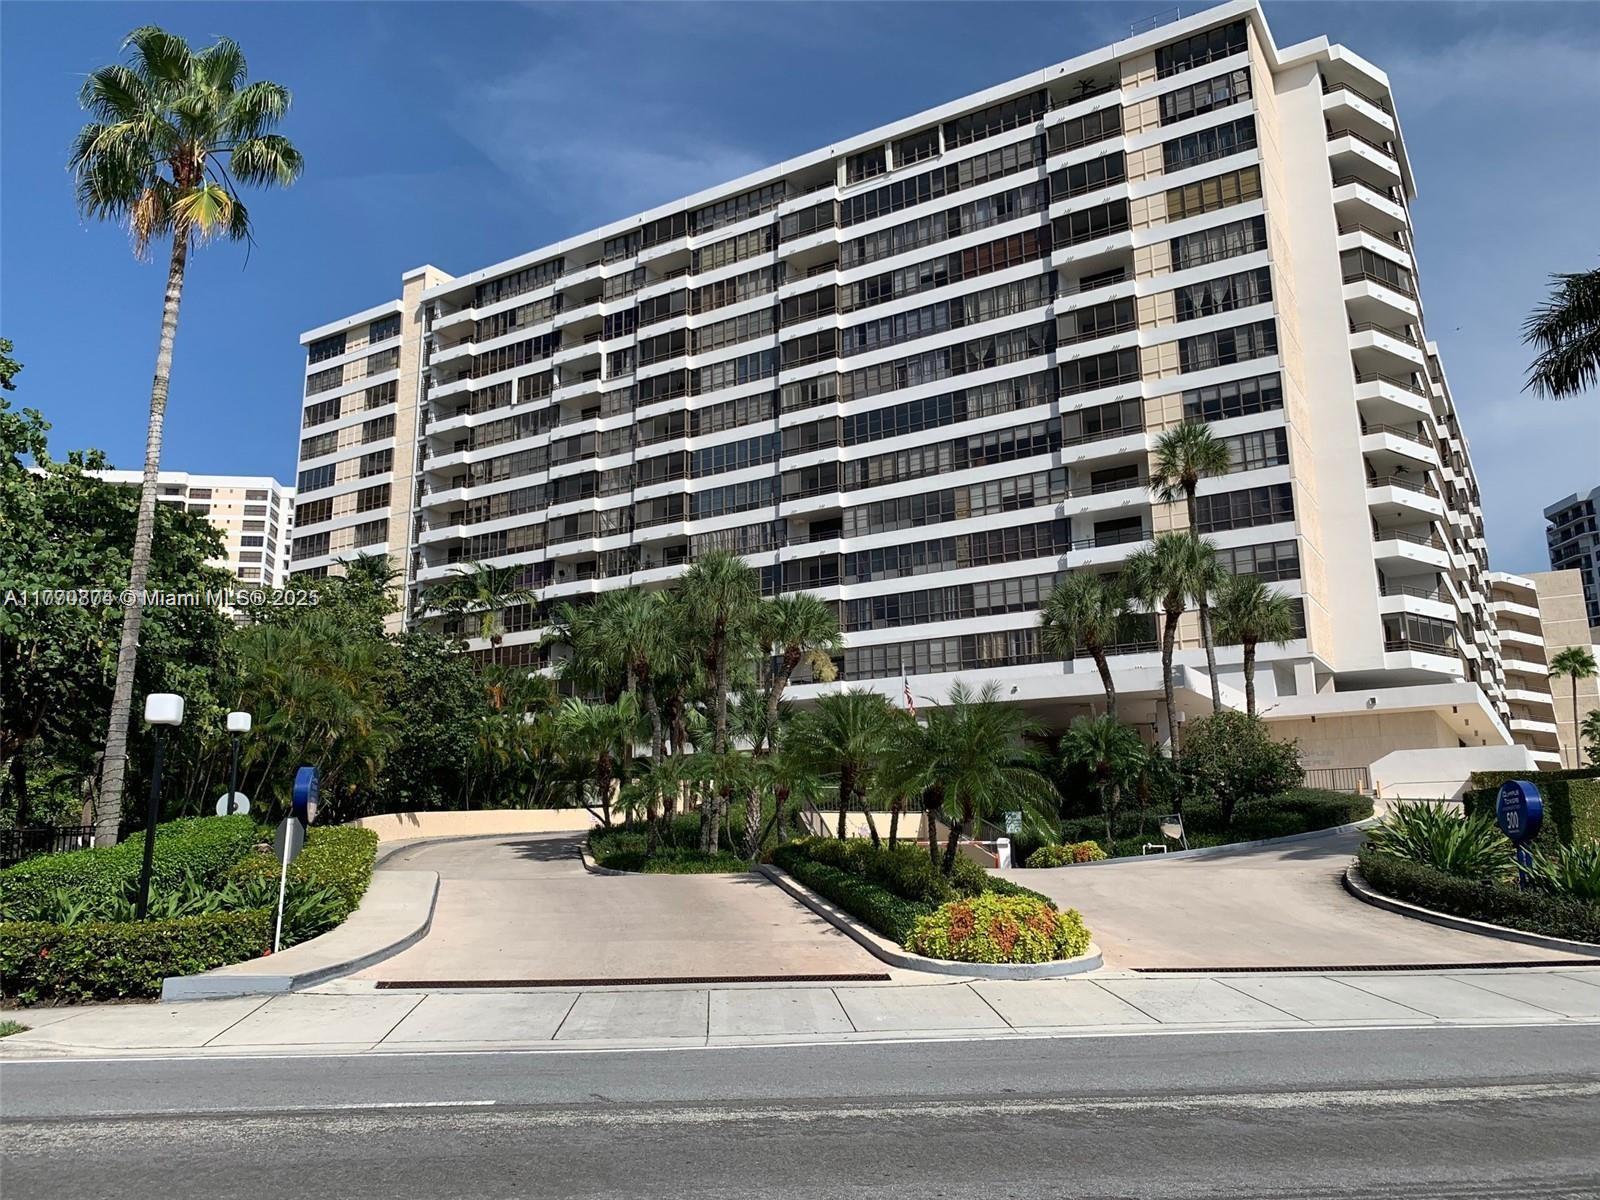
Active
$230,000
1
bds
|
2
ba
|
828
sqft
|
built
1974
500 Three Islands Blvd, Hallandale Beach, FL 33009
$-1,127
Cash flow
-25.6%
Cash-on-Cash Return
0.3%
Cap rate
0.8%
Rent to Value Ratio
Active
$175,000
1
bds
|
1
ba
|
660
sqft
|
built
1967
180 NE 12th Ave, Hallandale Beach, FL 33009
$-613
Cash flow
-18.3%
Cash-on-Cash Return
1.9%
Cap rate
1.0%
Rent to Value Ratio

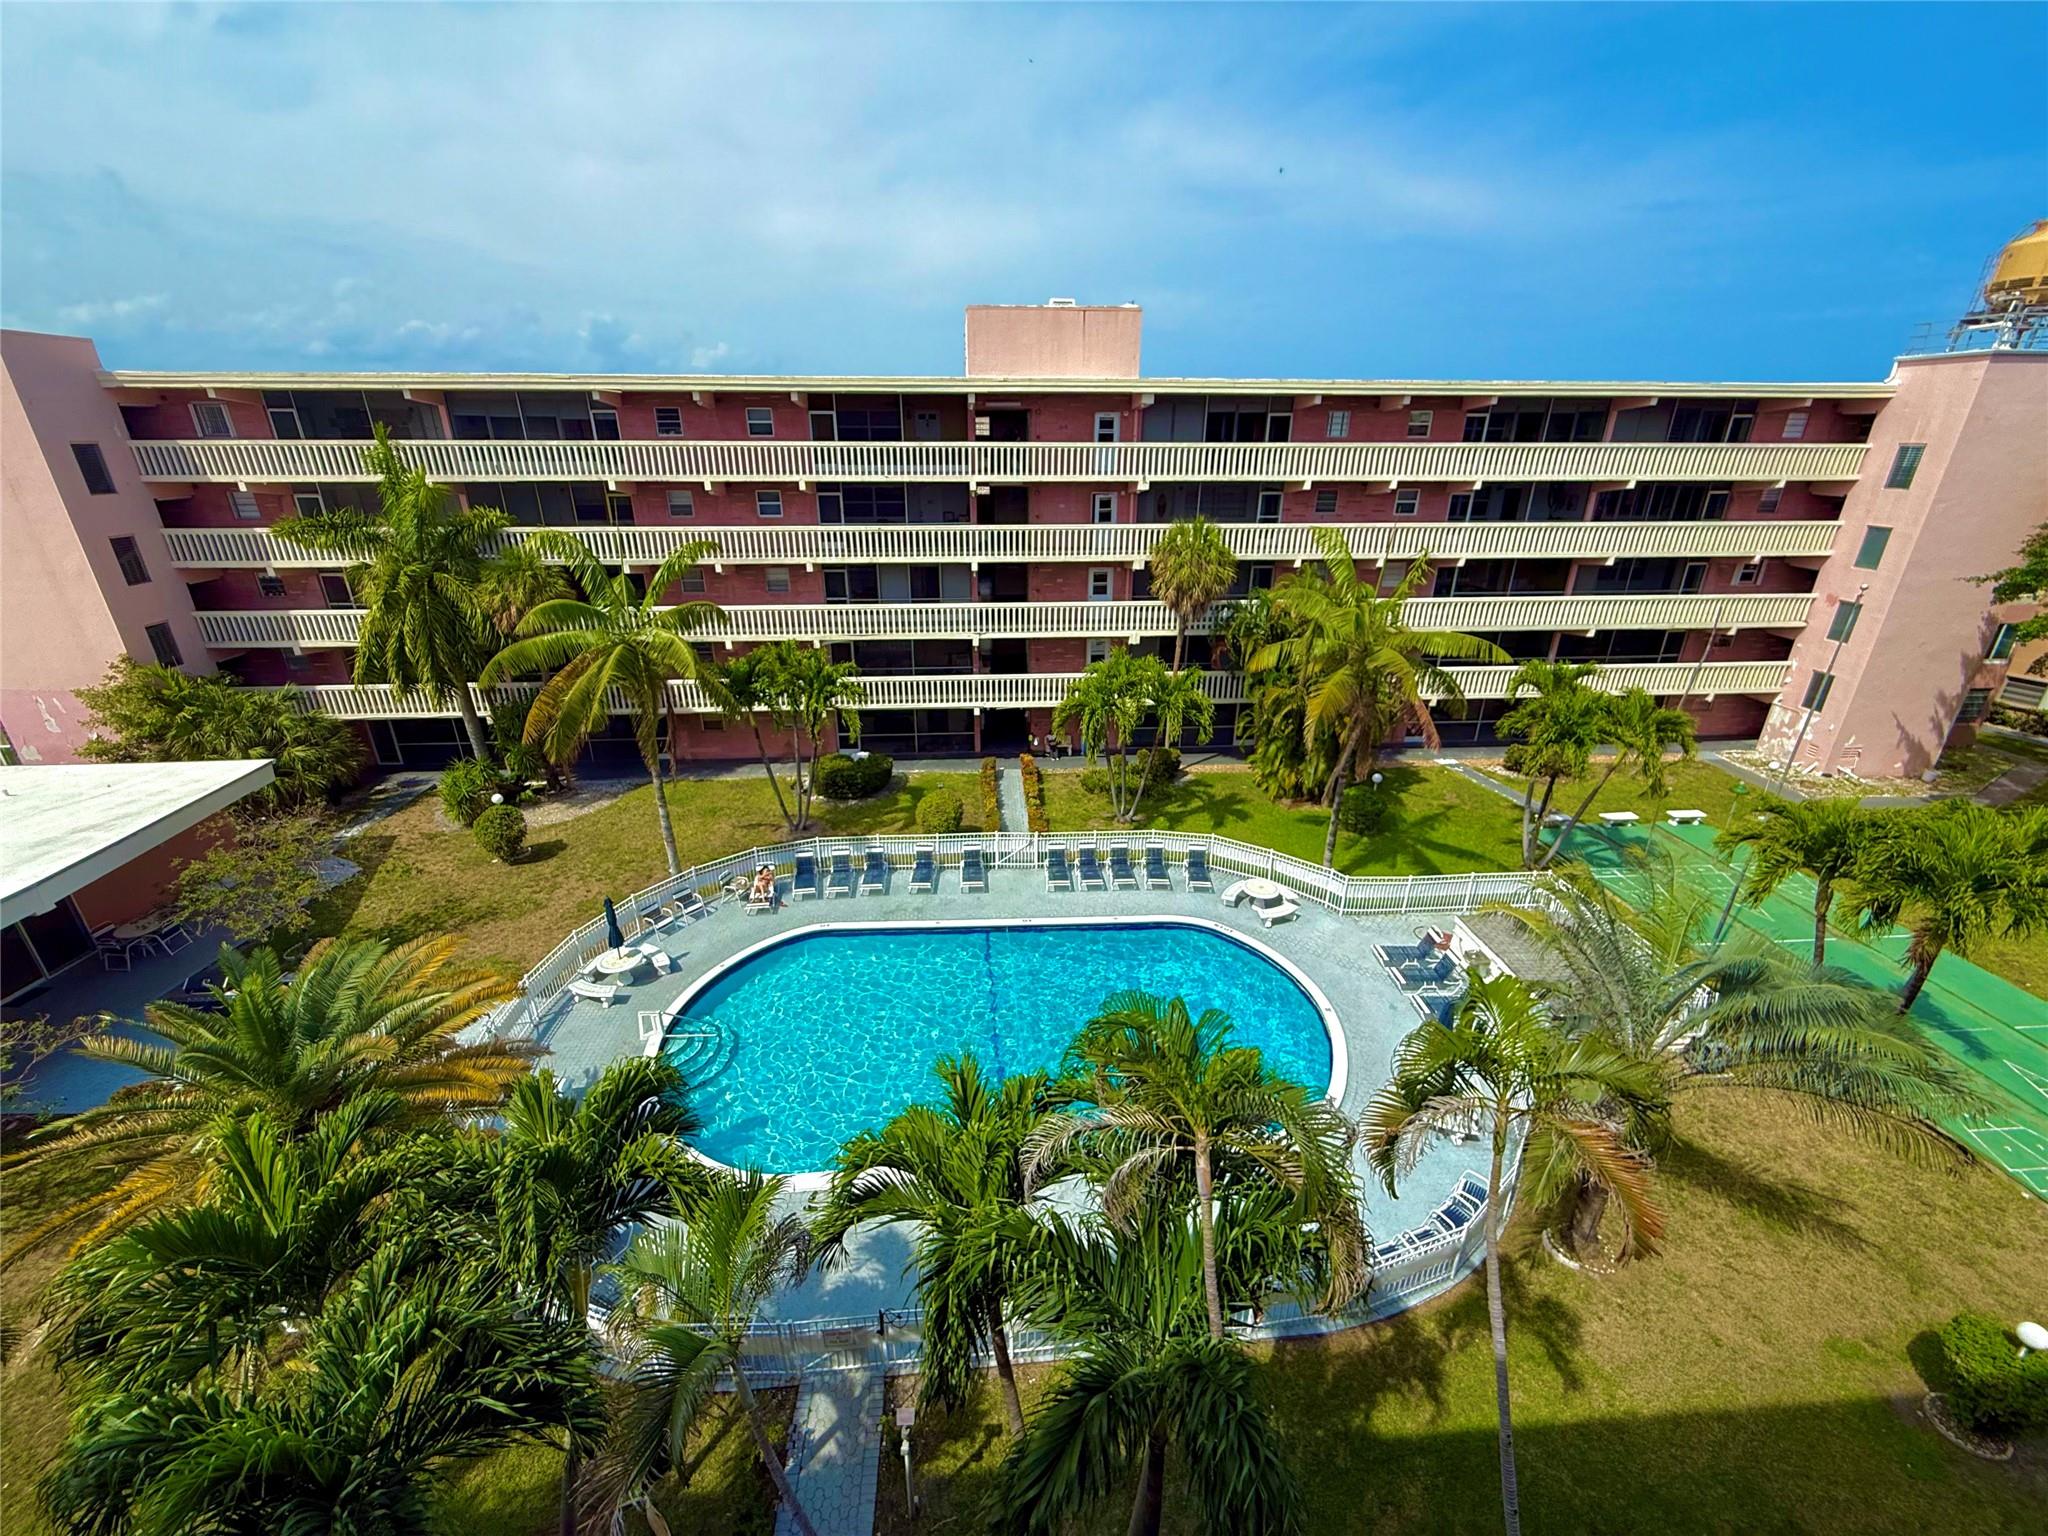
Active
$288,000
2
bds
|
2
ba
|
1,430
sqft
|
built
1979
600 Parkview Dr, Hallandale Beach, FL 33009
$-667
Cash flow
-12.1%
Cash-on-Cash Return
3.4%
Cap rate
1.1%
Rent to Value Ratio

Active
$375,000
2
bds
|
2
ba
|
1,250
sqft
|
built
1976
3113 S Ocean Dr, Hallandale Beach, FL 33009
$-1,117
Cash flow
-15.5%
Cash-on-Cash Return
2.6%
Cap rate
0.7%
Rent to Value Ratio
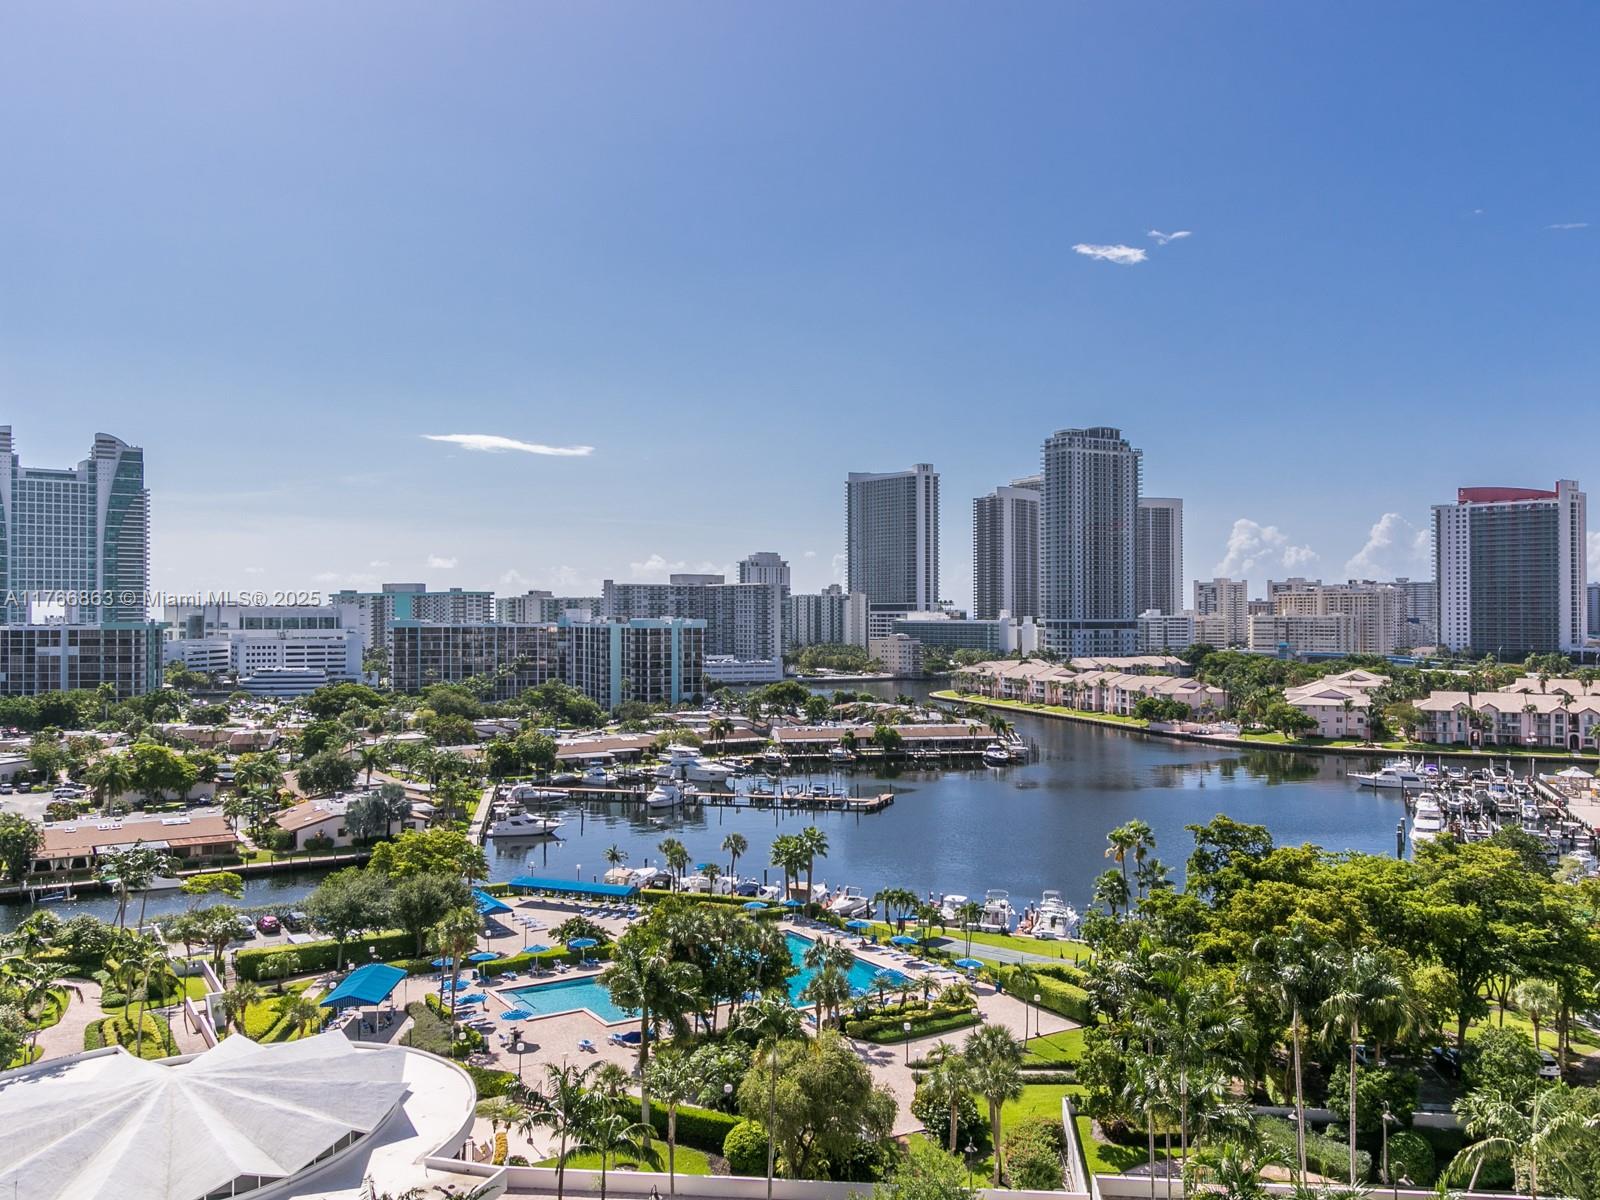
Active
$494,900
3
bds
|
2
ba
|
1,780
sqft
|
built
1977
600 Three Islands Blvd, Hallandale Beach, FL 33009
$-2,034
Cash flow
-21.4%
Cash-on-Cash Return
1.2%
Cap rate
0.7%
Rent to Value Ratio
Active
$7,999,999
5
bds
|
5
ba
|
5,220
sqft
|
built
1975
406 Holiday Dr, Hallandale Beach, FL 33009
$-35,847
Cash flow
-23.4%
Cash-on-Cash Return
0.8%
Cap rate
0.1%
Rent to Value Ratio
Active
$199,000
1
bds
|
2
ba
|
1,075
sqft
|
built
1976
1000 Parkview Dr, Hallandale Beach, FL 33009
$-265
Cash flow
-6.9%
Cash-on-Cash Return
4.5%
Cap rate
0.9%
Rent to Value Ratio
Active
$180,000
1
bds
|
1
ba
|
765
sqft
|
built
1980
250 Layne Blvd, Hallandale Beach, FL 33009
$-586
Cash flow
-17.0%
Cash-on-Cash Return
2.2%
Cap rate
1.0%
Rent to Value Ratio
Active
$417,500
1
bds
|
1
ba
|
831
sqft
|
built
2007
1945 S Ocean Dr, Hallandale Beach, FL 33009
$-1,404
Cash flow
-17.5%
Cash-on-Cash Return
2.1%
Cap rate
0.7%
Rent to Value Ratio
Active
$599,000
bds
|
0
ba
|
1,504
sqft
|
built
1976
817 Foster Rd, Hallandale Beach, FL 33009
$-2,184
Cash flow
-19.0%
Cash-on-Cash Return
1.8%
Cap rate
0.3%
Rent to Value Ratio
Active
$499,000
2
bds
|
2
ba
|
1,248
sqft
|
built
1970
2030 S Ocean Dr, Hallandale Beach, FL 33009
$-1,316
Cash flow
-13.8%
Cash-on-Cash Return
3.0%
Cap rate
0.6%
Rent to Value Ratio
Active
$159,000
1
bds
|
1
ba
|
578
sqft
|
built
1970
110 SE 2nd St, Hallandale Beach, FL 33009
$-220
Cash flow
-7.2%
Cash-on-Cash Return
4.5%
Cap rate
1.0%
Rent to Value Ratio
Active
$693,000
2
bds
|
2
ba
|
1,090
sqft
|
built
1974
2017 S Ocean Dr, Hallandale Beach, FL 33009
$-2,399
Cash flow
-18.1%
Cash-on-Cash Return
2.0%
Cap rate
0.5%
Rent to Value Ratio

Active
$468,000
2
bds
|
2
ba
|
1,176
sqft
|
built
1969
1825 S Ocean Dr, Hallandale Beach, FL 33009
$-1,965
Cash flow
-21.9%
Cash-on-Cash Return
1.1%
Cap rate
0.6%
Rent to Value Ratio
Active
$585,000
3
bds
|
2
ba
|
1,624
sqft
|
built
1980
531 Leslie Dr, Hallandale Beach, FL 33009
$-1,415
Cash flow
-12.6%
Cash-on-Cash Return
3.2%
Cap rate
0.7%
Rent to Value Ratio
Active
$178,900
1
bds
|
2
ba
|
847
sqft
|
built
1971
320 NE 12th Ave, Hallandale Beach, FL 33009
$-348
Cash flow
-10.1%
Cash-on-Cash Return
3.8%
Cap rate
1.1%
Rent to Value Ratio

Active
$299,000
2
bds
|
2
ba
|
1,700
sqft
|
built
1974
500 Three Islands Blvd, Hallandale Beach, FL 33009
$-189
Cash flow
-3.3%
Cash-on-Cash Return
5.4%
Cap rate
0.9%
Rent to Value Ratio

Active
$480,000
1
bds
|
2
ba
|
960
sqft
|
built
1970
1904 S Ocean Dr, Hallandale Beach, FL 33009
$-1,917
Cash flow
-20.8%
Cash-on-Cash Return
1.4%
Cap rate
0.6%
Rent to Value Ratio
Active
$589,000
2
bds
|
2
ba
|
1,240
sqft
|
built
1971
1980 S Ocean Dr, Hallandale Beach, FL 33009
$-2,288
Cash flow
-20.3%
Cash-on-Cash Return
1.5%
Cap rate
0.7%
Rent to Value Ratio

Active
$232,000
1
bds
|
1
ba
|
820
sqft
|
built
1974
501 Three Islands Blvd, Hallandale Beach, FL 33009
$-750
Cash flow
-16.9%
Cash-on-Cash Return
2.3%
Cap rate
0.8%
Rent to Value Ratio
Active
$295,000
2
bds
|
1
ba
|
940
sqft
|
built
1974
701 Three Islands Blvd, Hallandale Beach, FL 33009
$-1,146
Cash flow
-20.3%
Cash-on-Cash Return
1.5%
Cap rate
0.6%
Rent to Value Ratio
Active
$349,000
2
bds
|
2
ba
|
1,310
sqft
|
built
1974
851 Three Islands Blvd, Hallandale Beach, FL 33009
$-913
Cash flow
-13.6%
Cash-on-Cash Return
3.0%
Cap rate
0.8%
Rent to Value Ratio
Active
$615,000
2
bds
|
2
ba
|
1,240
sqft
|
built
1971
1980 S Ocean Dr, Hallandale Beach, FL 33009
$-2,559
Cash flow
-21.7%
Cash-on-Cash Return
1.2%
Cap rate
0.5%
Rent to Value Ratio
Pending
$225,000
1
bds
|
2
ba
|
850
sqft
|
built
1976
3113 S Ocean Dr, Hallandale Beach, FL 33009
$-28
Cash flow
-0.6%
Cash-on-Cash Return
6.0%
Cap rate
1.1%
Rent to Value Ratio
Active
$439,900
1
bds
|
2
ba
|
870
sqft
|
built
1972
1985 S Ocean Dr, Hallandale Beach, FL 33009
$-1,442
Cash flow
-17.1%
Cash-on-Cash Return
2.2%
Cap rate
0.6%
Rent to Value Ratio

Active
$669,000
2
bds
|
1
ba
|
1,086
sqft
|
built
2007
1800 S Ocean Dr, Hallandale Beach, FL 33009
$-2,737
Cash flow
-21.3%
Cash-on-Cash Return
1.2%
Cap rate
0.6%
Rent to Value Ratio

Active
$660,000
1
bds
|
1
ba
|
871
sqft
|
built
2006
1830 S Ocean Dr, Hallandale Beach, FL 33009
$-1,659
Cash flow
-13.1%
Cash-on-Cash Return
3.1%
Cap rate
0.7%
Rent to Value Ratio

Active
$489,000
2
bds
|
2
ba
|
1,340
sqft
|
built
1972
1985 S Ocean Dr, Hallandale Beach, FL 33009
$-1,793
Cash flow
-19.1%
Cash-on-Cash Return
1.7%
Cap rate
0.7%
Rent to Value Ratio
Active
$295,000
2
bds
|
2
ba
|
1,250
sqft
|
built
1968
111 Golden Isles Dr, Hallandale Beach, FL 33009
$-143
Cash flow
-2.5%
Cash-on-Cash Return
5.6%
Cap rate
0.8%
Rent to Value Ratio
Active
$370,000
2
bds
|
2
ba
|
1,280
sqft
|
built
1981
2500 Parkview Dr, Hallandale Beach, FL 33009
$-1,594
Cash flow
-22.5%
Cash-on-Cash Return
1.0%
Cap rate
0.8%
Rent to Value Ratio
Active
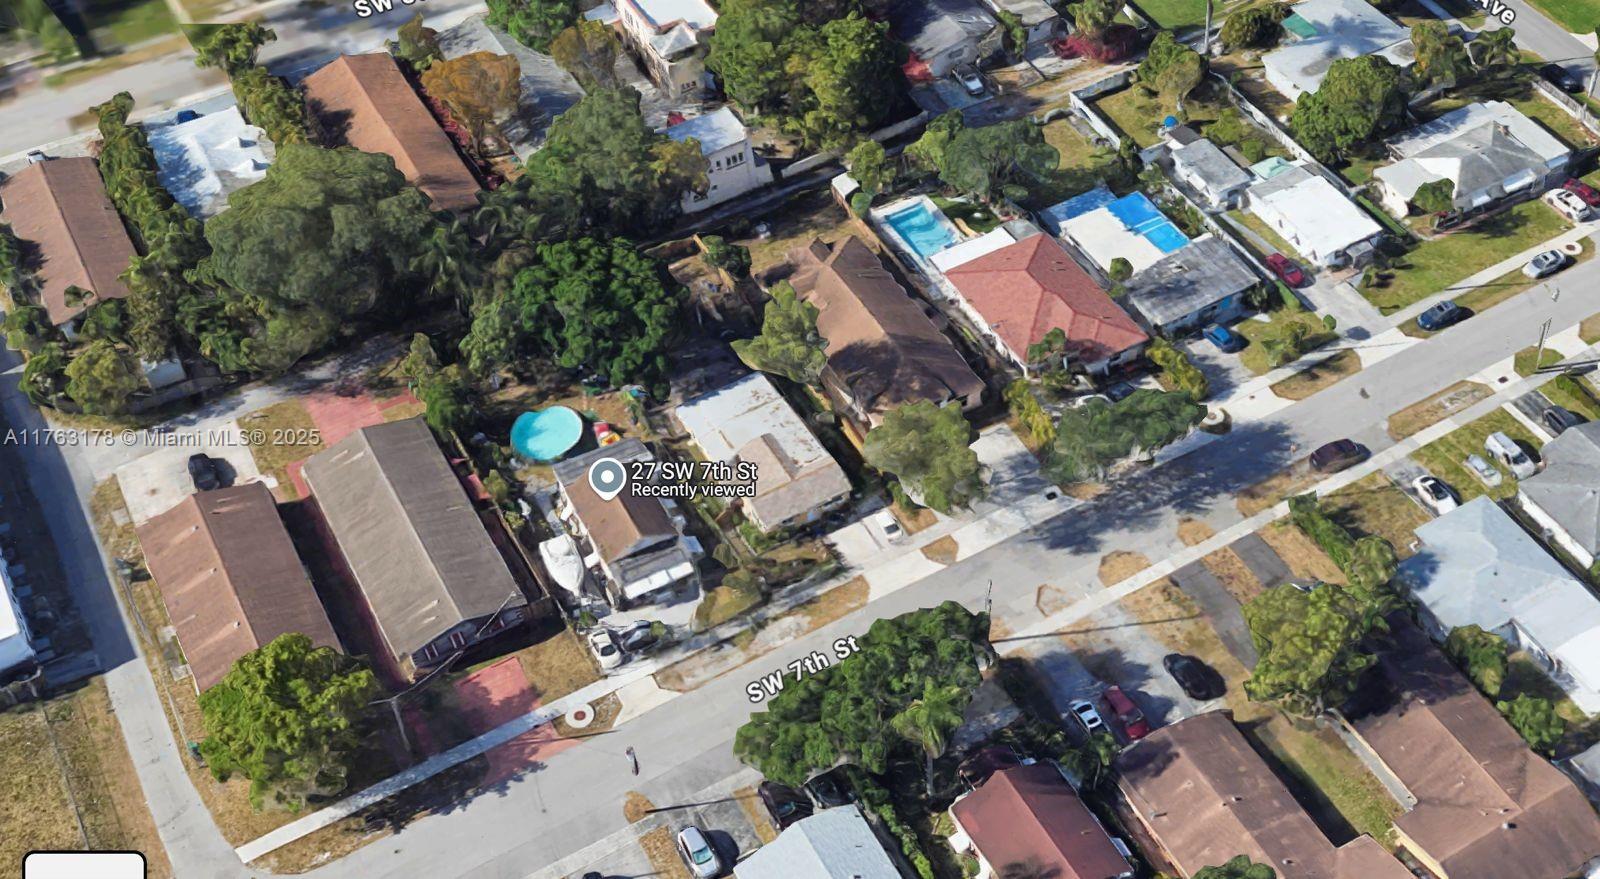
$544,900
3
bds
|
2
ba
|
1,008
sqft
|
built
1953
27 SW 7th St, Hallandale Beach, FL 33009
$-1,294
Cash flow
-12.4%
Cash-on-Cash Return
3.3%
Cap rate
0.5%
Rent to Value Ratio

Active
$239,990
1
bds
|
1
ba
|
800
sqft
|
built
1975
2001 Atlantic Shores Blvd, Hallandale Beach, FL 33009
$-679
Cash flow
-14.8%
Cash-on-Cash Return
2.8%
Cap rate
0.9%
Rent to Value Ratio

Active
$195,000
1
bds
|
2
ba
|
868
sqft
|
built
1972
427 Golden Isles Dr, Hallandale Beach, FL 33009
$-833
Cash flow
-22.3%
Cash-on-Cash Return
1.0%
Cap rate
1.1%
Rent to Value Ratio

Active
$739,000
2
bds
|
1
ba
|
1,086
sqft
|
built
2006
1800 S Ocean Dr, Hallandale Beach, FL 33009
$-3,084
Cash flow
-21.8%
Cash-on-Cash Return
1.1%
Cap rate
0.5%
Rent to Value Ratio
Active
$1,125,000
2
bds
|
2
ba
|
1,782
sqft
|
built
2006
1800 S Ocean Dr, Hallandale Beach, FL 33009
$-5,111
Cash flow
-23.7%
Cash-on-Cash Return
0.7%
Cap rate
0.6%
Rent to Value Ratio

Active
$1,175,000
2
bds
|
2
ba
|
1,458
sqft
|
built
2006
1830 S Ocean Dr, Hallandale Beach, FL 33009
$-5,010
Cash flow
-22.2%
Cash-on-Cash Return
1.0%
Cap rate
0.6%
Rent to Value Ratio
Active
$280,000
1
bds
|
2
ba
|
850
sqft
|
built
1970
300 Diplomat Pkwy, Hallandale Beach, FL 33009
$-1,244
Cash flow
-23.2%
Cash-on-Cash Return
0.8%
Cap rate
0.8%
Rent to Value Ratio
Active
$250,000
1
bds
|
2
ba
|
925
sqft
|
built
1970
401 Golden Isles Dr, Hallandale Beach, FL 33009
$-817
Cash flow
-17.1%
Cash-on-Cash Return
2.2%
Cap rate
0.9%
Rent to Value Ratio
Active
$189,000
1
bds
|
1
ba
|
658
sqft
|
built
1969
1100 NE 1st Ct, Hallandale Beach, FL 33009
$-500
Cash flow
-13.8%
Cash-on-Cash Return
3.0%
Cap rate
1.0%
Rent to Value Ratio