Hazel Crest, IL Investment Properties for Sale
Browse homes for sale and investment properties in Hazel Crest, IL. Refine your search by price, property type, or more.
Best cash flowing properties in Hazel Crest, IL
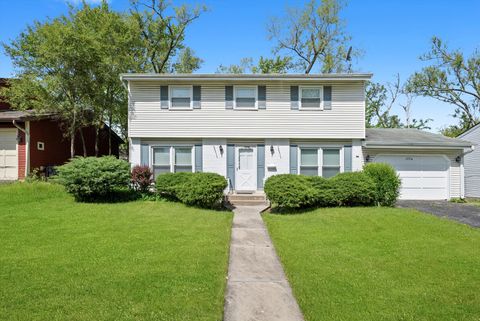
Active
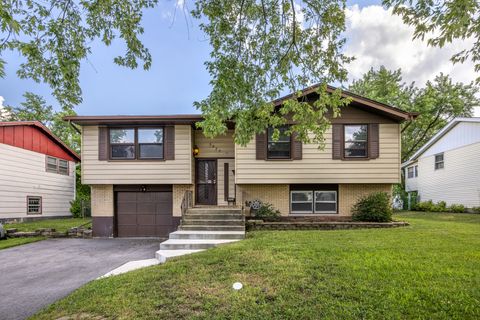
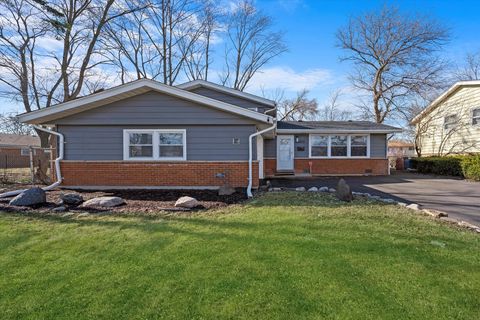
$185,000
3
bds
|
2
ba
|
1,246
sqft
|
built
1960
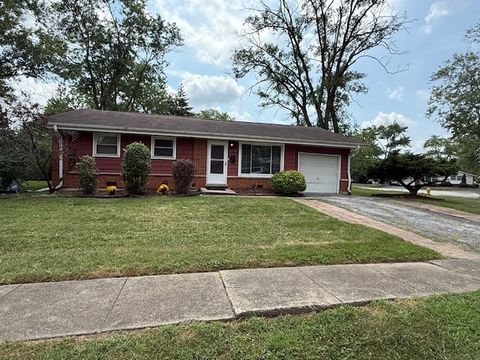
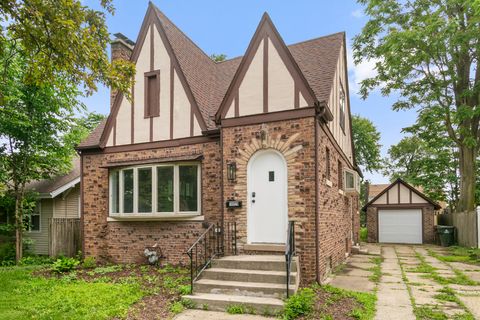
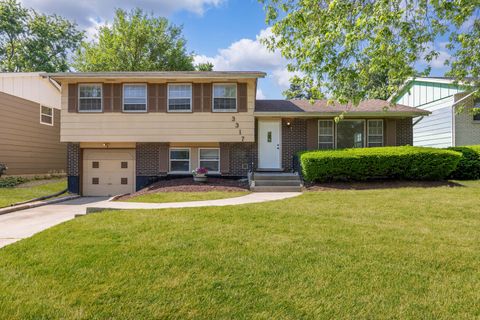
3213 Woodworth Pl, Hazel Crest, IL 60429
$819
Cash flow
23.1%
Cash-on-Cash Return
11.0%
Cap rate
1.4%
Rent to Value Ratio
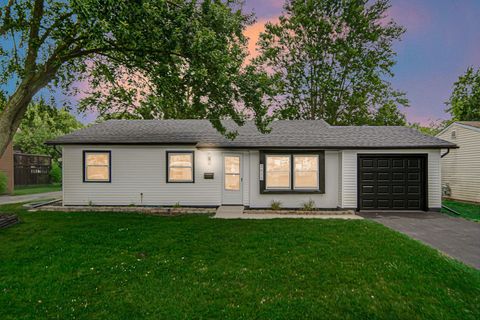
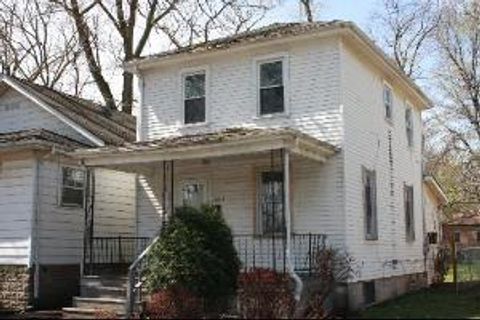
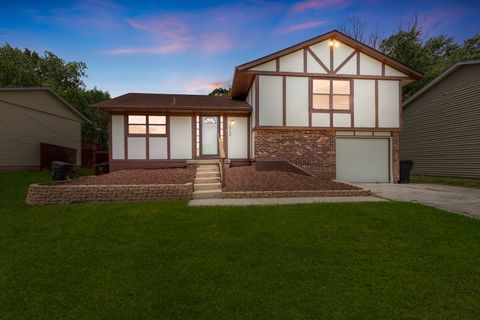
Active
$129,000
4
bds
|
1
ba
|
1,279
sqft
|
built
1952
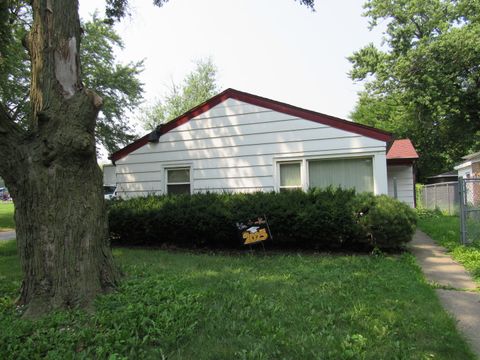
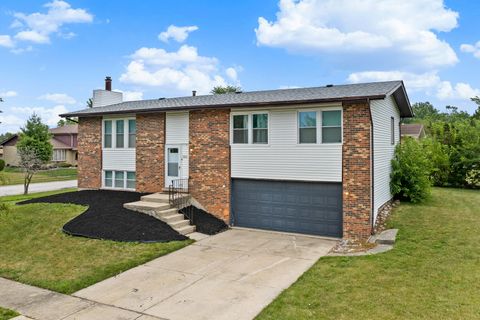
16840 Bulger Ave, Hazel Crest, IL 60429
$779
Cash flow
31.5%
Cash-on-Cash Return
12.9%
Cap rate
1.9%
Rent to Value Ratio
30 out of 32 properties for sale in Hazel Crest, IL
Limited Results Shown
Create a free account, or log in to reveal all property listings and enjoy the complete experience.
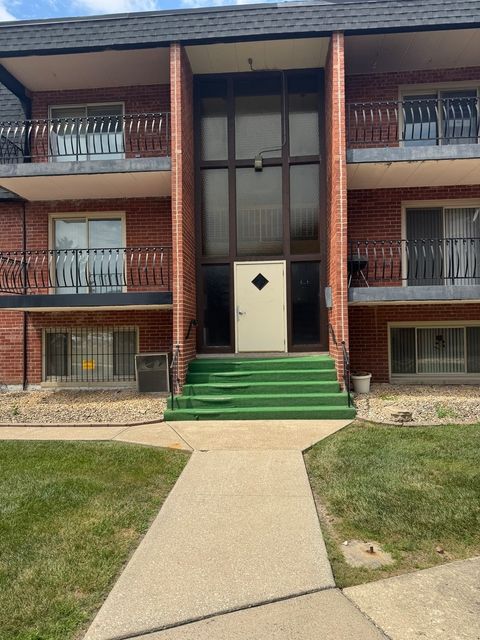
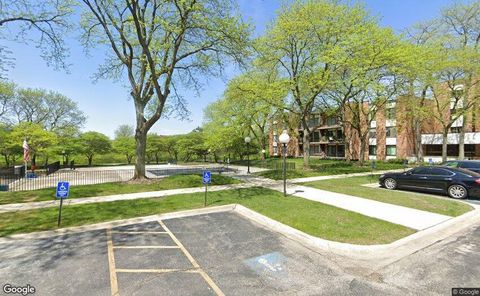
Active
$50,000
1
bds
|
1
ba
|
0
sqft
|
built
1978
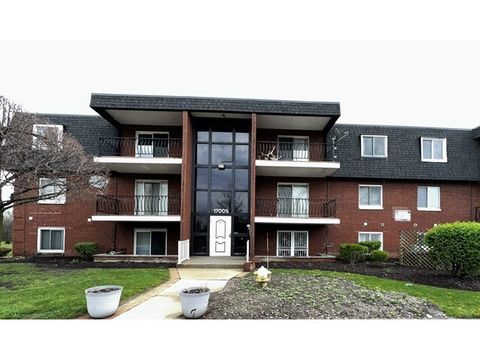
17005 Albany Ave, Hazel Crest, IL 60429
$664
Cash flow
15.5%
Cash-on-Cash Return
15.9%
Cap rate
3.2%
Rent to Value Ratio
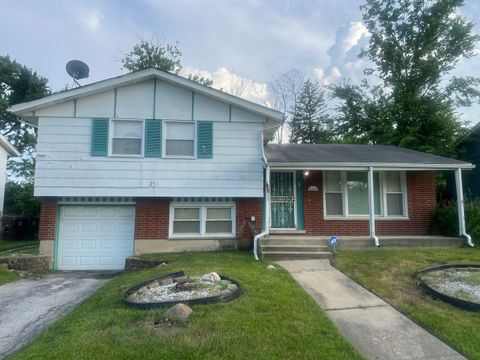
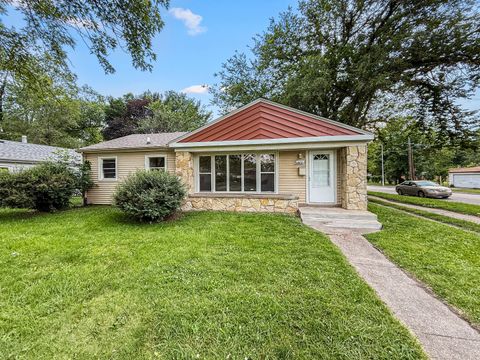
Active
$179,999
3
bds
|
2
ba
|
1,228
sqft
|
built
1972
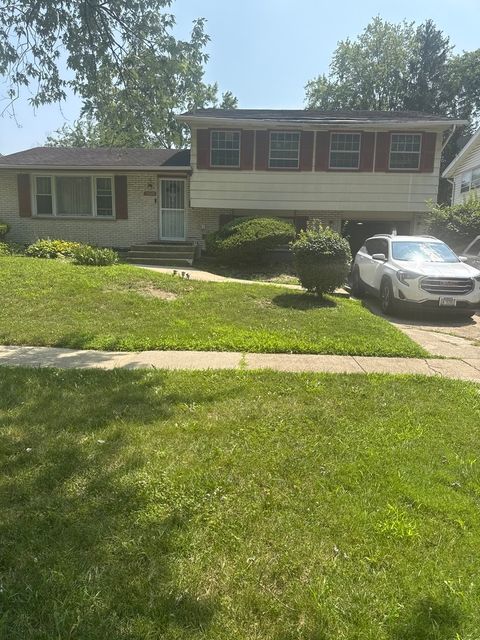
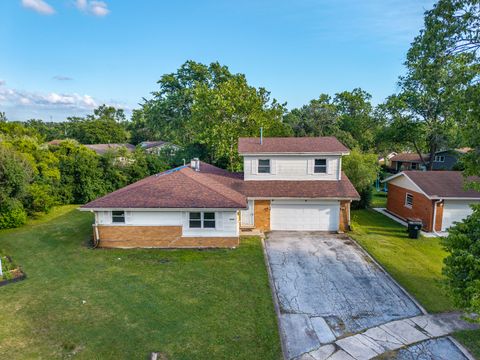
3509 Birchwood Dr, Hazel Crest, IL 60429
$331
Cash flow
9.6%
Cash-on-Cash Return
7.9%
Cap rate
1.4%
Rent to Value Ratio
Active
$225,000
4
bds
|
2
ba
|
1,256
sqft
|
built
1972
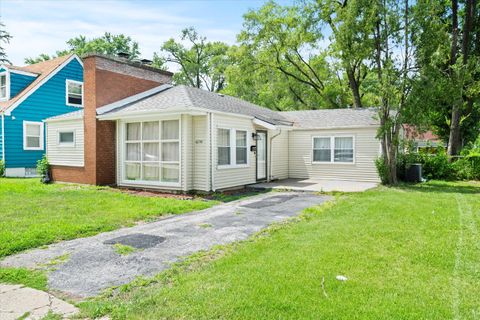
3425 Birchwood Dr, Hazel Crest, IL 60429
$46
Cash flow
1.1%
Cash-on-Cash Return
5.9%
Cap rate
1.2%
Rent to Value Ratio
Active
$279,000
3
bds
|
1
ba
|
1,500
sqft
|
built
1972
3611 Tamarind Ln, Hazel Crest, IL 60429
$-314
Cash flow
-5.9%
Cash-on-Cash Return
4.3%
Cap rate
0.8%
Rent to Value Ratio
Active
$69,900
1
bds
|
1
ba
|
0
sqft
|
built
1978
3012 171st St, Hazel Crest, IL 60429
$659
Cash flow
11.0%
Cash-on-Cash Return
11.3%
Cap rate
2.0%
Rent to Value Ratio
Active
$155,000
3
bds
|
1
ba
|
1,130
sqft
|
built
1964
3325 Laurel Ln, Hazel Crest, IL 60429
$477
Cash flow
16.1%
Cash-on-Cash Return
9.4%
Cap rate
1.6%
Rent to Value Ratio
Active
$209,900
3
bds
|
2
ba
|
1,500
sqft
|
built
1962
3508 Maple Ln, Hazel Crest, IL 60429
$85
Cash flow
2.1%
Cash-on-Cash Return
6.2%
Cap rate
1.3%
Rent to Value Ratio
Active
$190,000
2
bds
|
2
ba
|
1,350
sqft
|
built
1973
3505 Lakeview Dr, Hazel Crest, IL 60429
$-1
Cash flow
0.0%
Cash-on-Cash Return
5.7%
Cap rate
1.2%
Rent to Value Ratio
Active
$120,000
3
bds
|
1
ba
|
1,400
sqft
|
built
1918
16918 Shea Ave, Hazel Crest, IL 60429
$619
Cash flow
26.9%
Cash-on-Cash Return
11.9%
Cap rate
1.8%
Rent to Value Ratio
Active
$215,000
4
bds
|
2
ba
|
1,682
sqft
|
built
1953
16802 Anthony Ave, Hazel Crest, IL 60429
$5
Cash flow
0.1%
Cash-on-Cash Return
5.7%
Cap rate
1.0%
Rent to Value Ratio
Active
$239,700
3
bds
|
2
ba
|
1,699
sqft
|
built
1928
16929 Wood St, Hazel Crest, IL 60429
$203
Cash flow
4.4%
Cash-on-Cash Return
6.7%
Cap rate
1.0%
Rent to Value Ratio
Active
$269,000
3
bds
|
2
ba
|
1,983
sqft
|
built
1975
3111 Smoke Tree Ct, Hazel Crest, IL 60429
$-445
Cash flow
-8.6%
Cash-on-Cash Return
3.7%
Cap rate
0.9%
Rent to Value Ratio
Active
$200,000
5
bds
|
3
ba
|
2,238
sqft
|
built
1961
3205 Oak Ct, Hazel Crest, IL 60429
$296
Cash flow
7.7%
Cash-on-Cash Return
7.5%
Cap rate
1.6%
Rent to Value Ratio
Active
$155,000
3
bds
|
1
ba
|
1,003
sqft
|
built
1951
16744 Trapet Ave, Hazel Crest, IL 60429
$286
Cash flow
9.6%
Cash-on-Cash Return
7.9%
Cap rate
1.6%
Rent to Value Ratio
Active
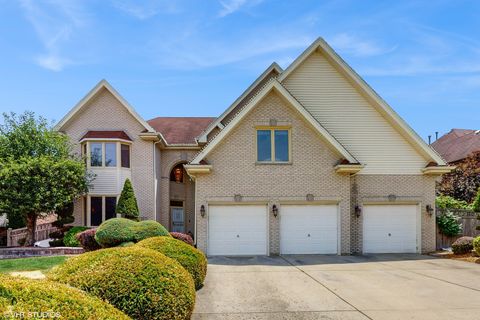
$515,000
4
bds
|
4
ba
|
3,592
sqft
|
built
2004
11 Carrington Ct, Hazel Crest, IL 60429
$-1,334
Cash flow
-13.5%
Cash-on-Cash Return
2.6%
Cap rate
0.8%
Rent to Value Ratio
Active
$254,000
3
bds
|
2
ba
|
958
sqft
|
built
1976
18104 Fountainbleau Dr, Hazel Crest, IL 60429
$-117
Cash flow
-2.4%
Cash-on-Cash Return
5.1%
Cap rate
1.0%
Rent to Value Ratio
Active
$418,000
4
bds
|
3
ba
|
3,623
sqft
|
built
1997
18507 Indie Ct, Hazel Crest, IL 60429
$-791
Cash flow
-9.9%
Cash-on-Cash Return
3.4%
Cap rate
0.9%
Rent to Value Ratio
Active
$189,000
3
bds
|
3
ba
|
1,982
sqft
|
built
1962
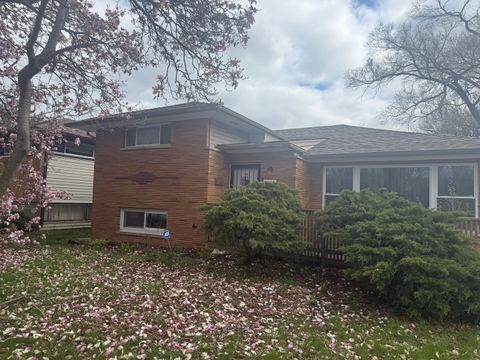
17714 Dogwood Ln, Hazel Crest, IL 60429
$-151
Cash flow
-4.2%
Cash-on-Cash Return
4.7%
Cap rate
1.3%
Rent to Value Ratio
Active
$189,000
3
bds
|
2
ba
|
1,223
sqft
|
built
1971
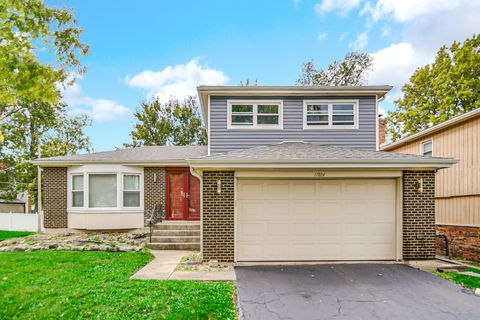
3317 Birchwood Dr, Hazel Crest, IL 60429
$191
Cash flow
5.3%
Cash-on-Cash Return
6.9%
Cap rate
1.3%
Rent to Value Ratio
Active
$206,000
2
bds
|
2
ba
|
1,468
sqft
|
built
1956
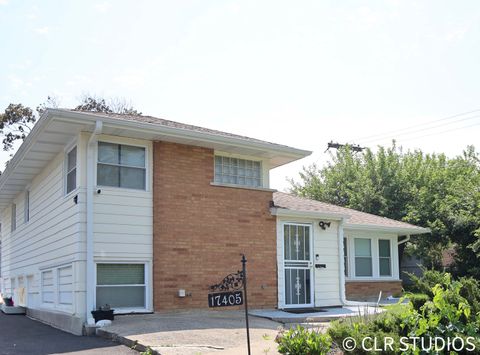
17405 Longfellow Ave, Hazel Crest, IL 60429
$80
Cash flow
2.0%
Cash-on-Cash Return
6.1%
Cap rate
1.2%
Rent to Value Ratio
Active
$270,000
3
bds
|
3
ba
|
2,300
sqft
|
built
1971
17804 Pebblewood Ln, Hazel Crest, IL 60429
$-344
Cash flow
-6.6%
Cash-on-Cash Return
4.2%
Cap rate
1.1%
Rent to Value Ratio
Active
$199,000
4
bds
|
2
ba
|
1,378
sqft
|
built
1955
3105 172nd St, Hazel Crest, IL 60429
$126
Cash flow
3.3%
Cash-on-Cash Return
6.4%
Cap rate
1.3%
Rent to Value Ratio
Active
$208,000
3
bds
|
3
ba
|
1,349
sqft
|
built
1973
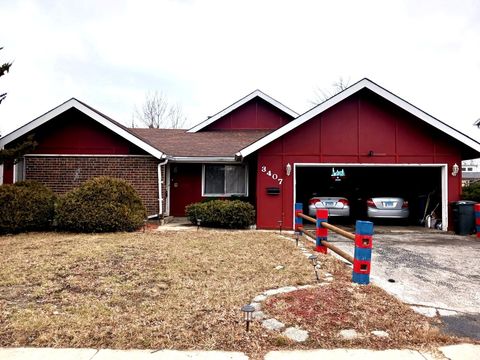
3407 Fountainbleau Dr, Hazel Crest, IL 60429
$2
Cash flow
0.1%
Cash-on-Cash Return
5.7%
Cap rate
1.2%
Rent to Value Ratio
Active
$179,000
2
bds
|
1
ba
|
812
sqft
|
built
1948
16780 Head Ave, Hazel Crest, IL 60429
$-101
Cash flow
-2.9%
Cash-on-Cash Return
5.0%
Cap rate
0.9%
Rent to Value Ratio
Active
$214,000
3
bds
|
2
ba
|
1,059
sqft
|
built
1976
3400 Seine Ct, Hazel Crest, IL 60429
$-81
Cash flow
-2.0%
Cash-on-Cash Return
5.2%
Cap rate
1.1%
Rent to Value Ratio
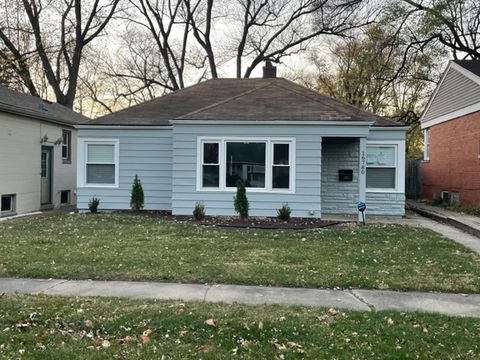
Active
$210,000
3
bds
|
1
ba
|
1,110
sqft
|
built
1951
2814 Lexington Dr, Hazel Crest, IL 60429
$12
Cash flow
0.3%
Cash-on-Cash Return
5.7%
Cap rate
1.0%
Rent to Value Ratio

Active
$200,000
4
bds
|
2
ba
|
1,236
sqft
|
built
1970
16916 Magnolia Dr, Hazel Crest, IL 60429
$54
Cash flow
1.4%
Cash-on-Cash Return
6.0%
Cap rate
1.2%
Rent to Value Ratio
Active
$215,000
2
bds
|
2
ba
|
936
sqft
|
built
1956
16873 Bulger Ave, Hazel Crest, IL 60429
$-86
Cash flow
-2.1%
Cash-on-Cash Return
5.2%
Cap rate
1.0%
Rent to Value Ratio