Henderson, NV Investment Properties for Sale
Browse homes for sale and investment properties in Henderson, NV. Refine your search by price, property type, or more.
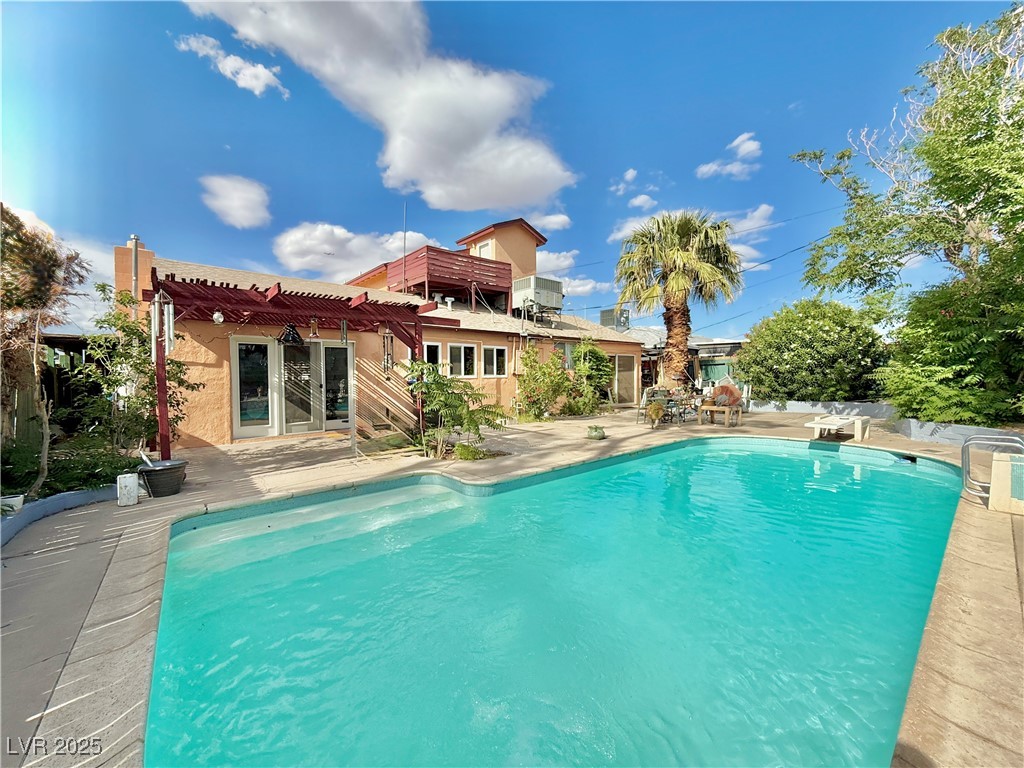
Best cash flowing properties in Henderson, NV
Active
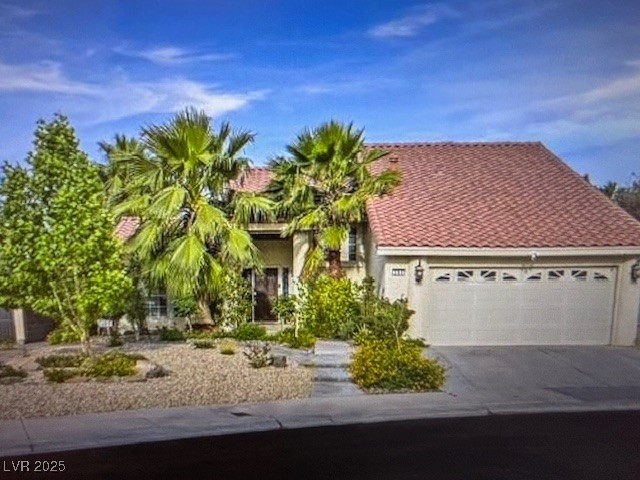
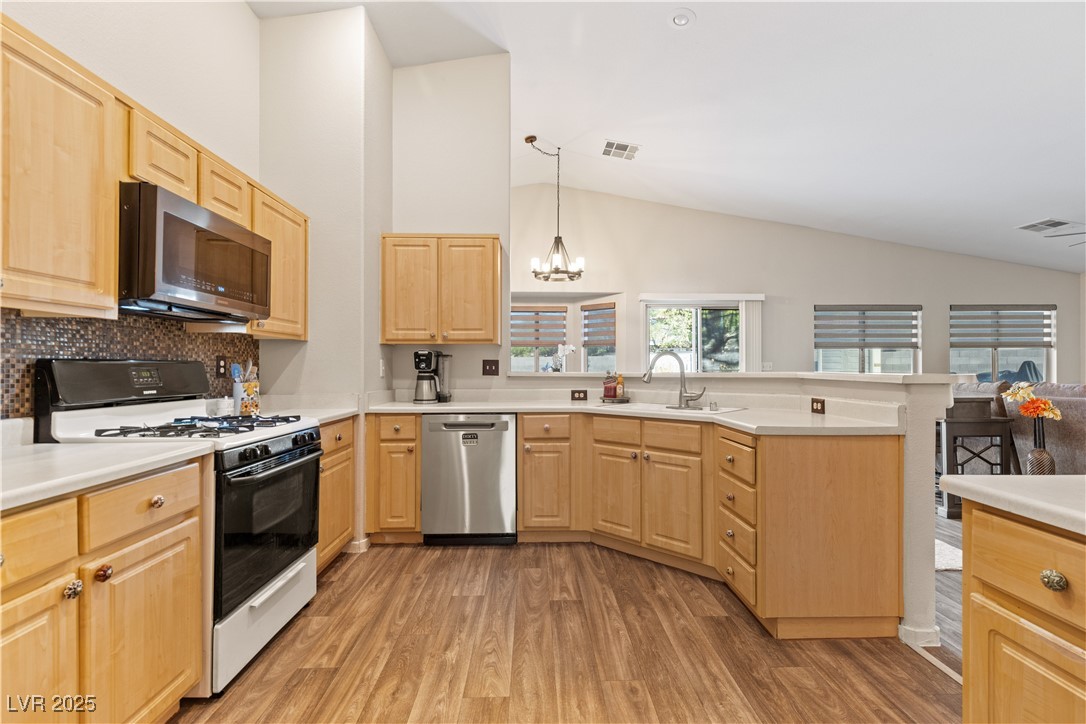
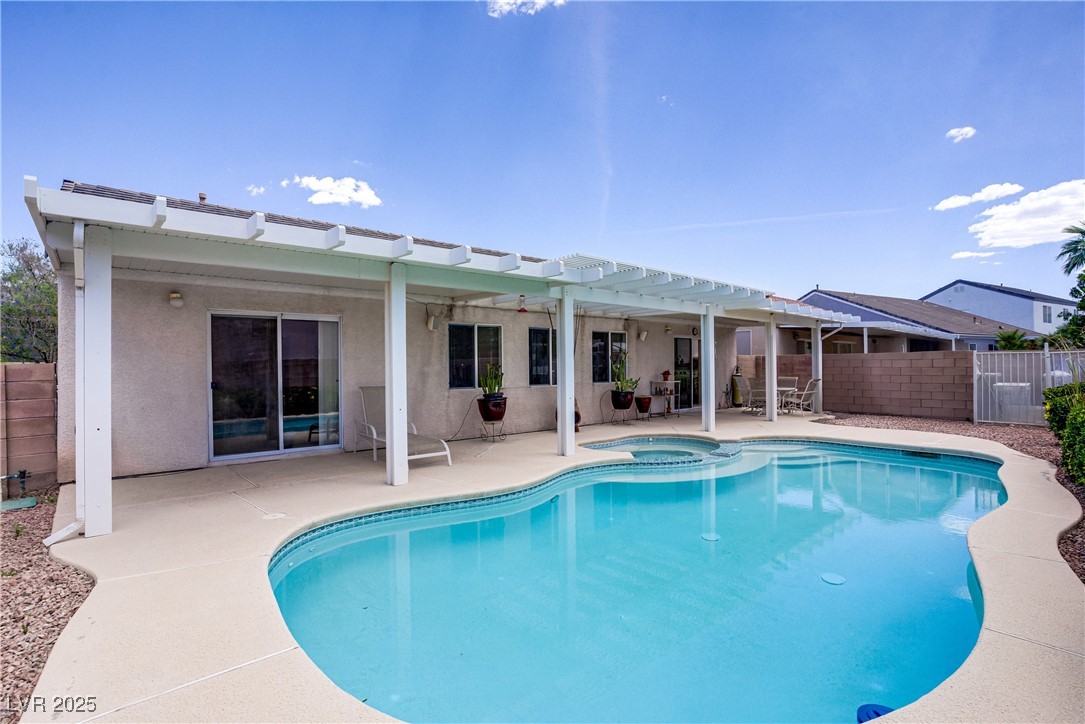
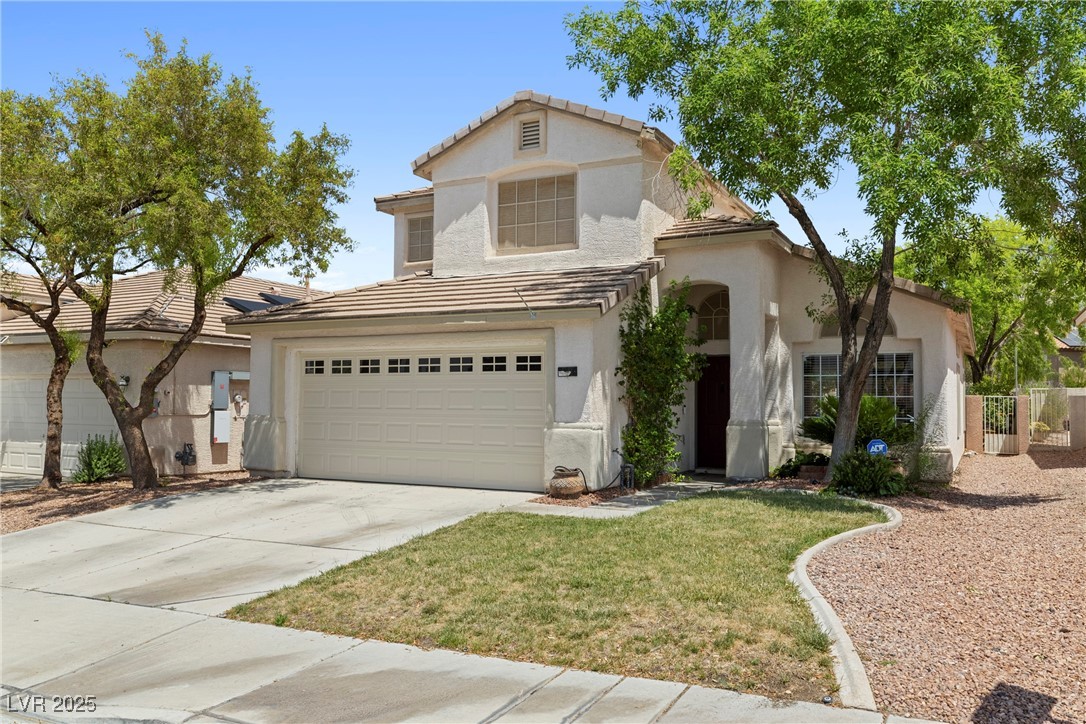
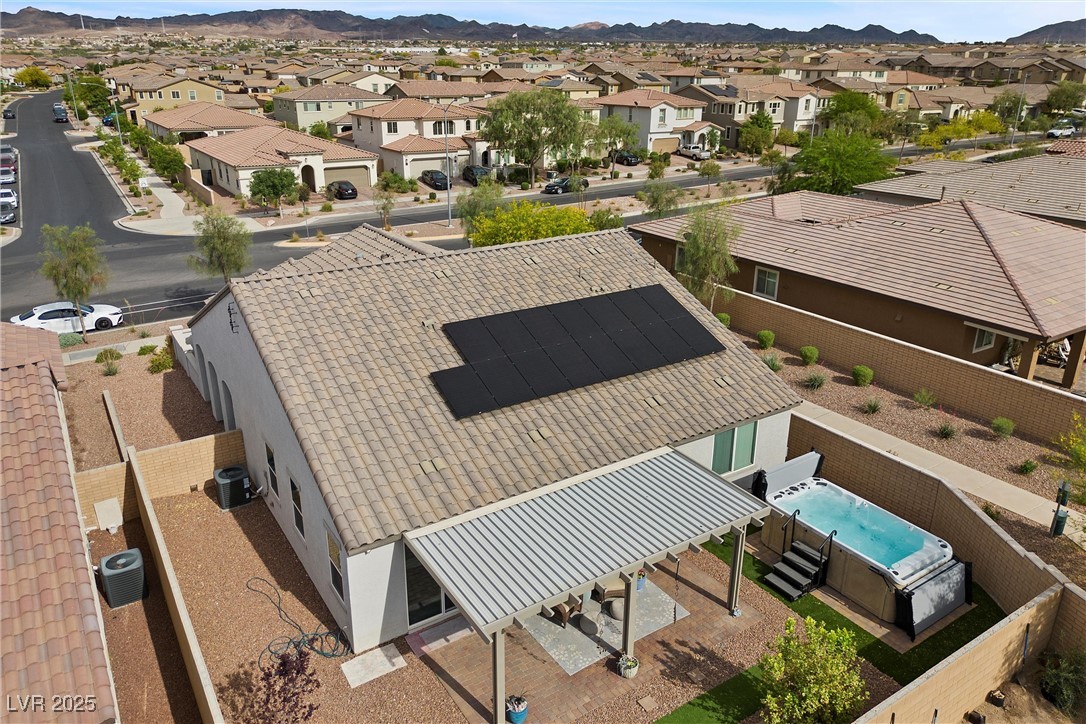
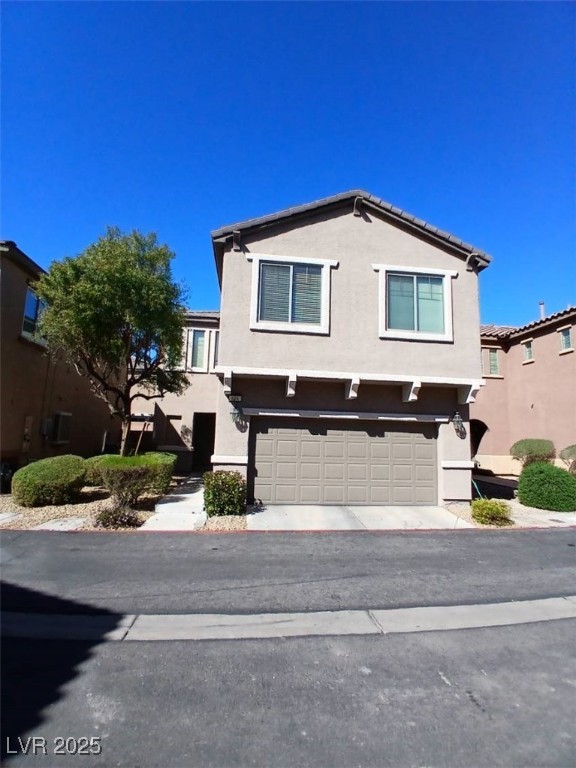
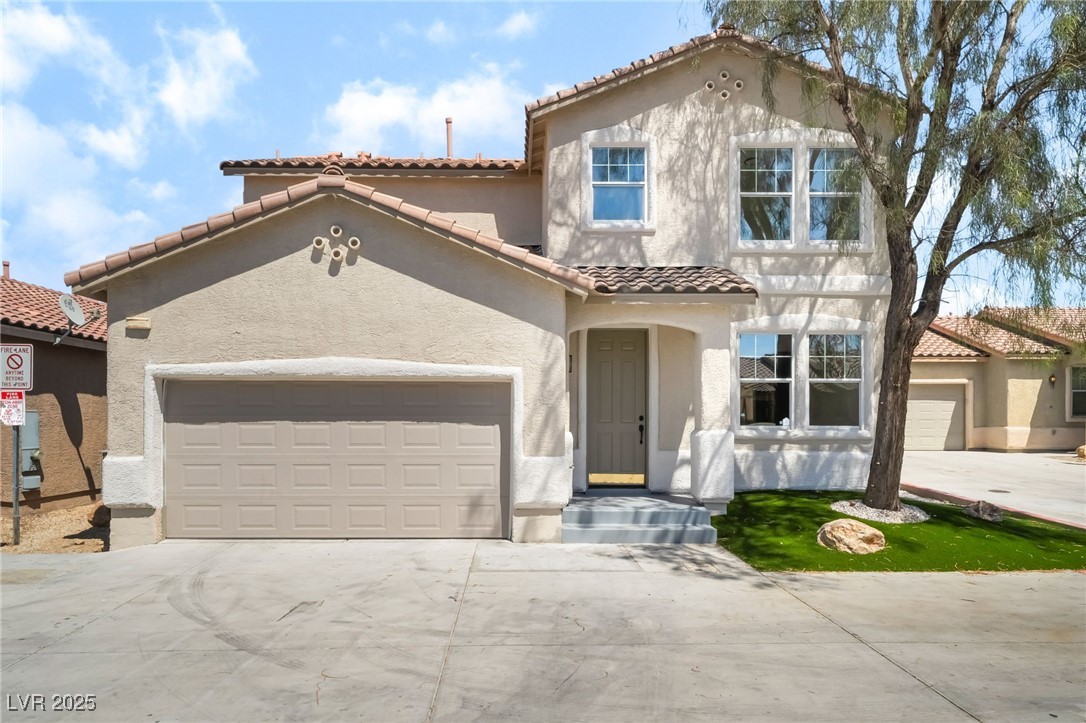
$550,000
4
bds
|
3
ba
|
2,267
sqft
|
built
1987
390 Rushing Creek Ct, Henderson, NV 89014
$215
Cash flow
2.0%
Cash-on-Cash Return
6.1%
Cap rate
0.8%
Rent to Value Ratio
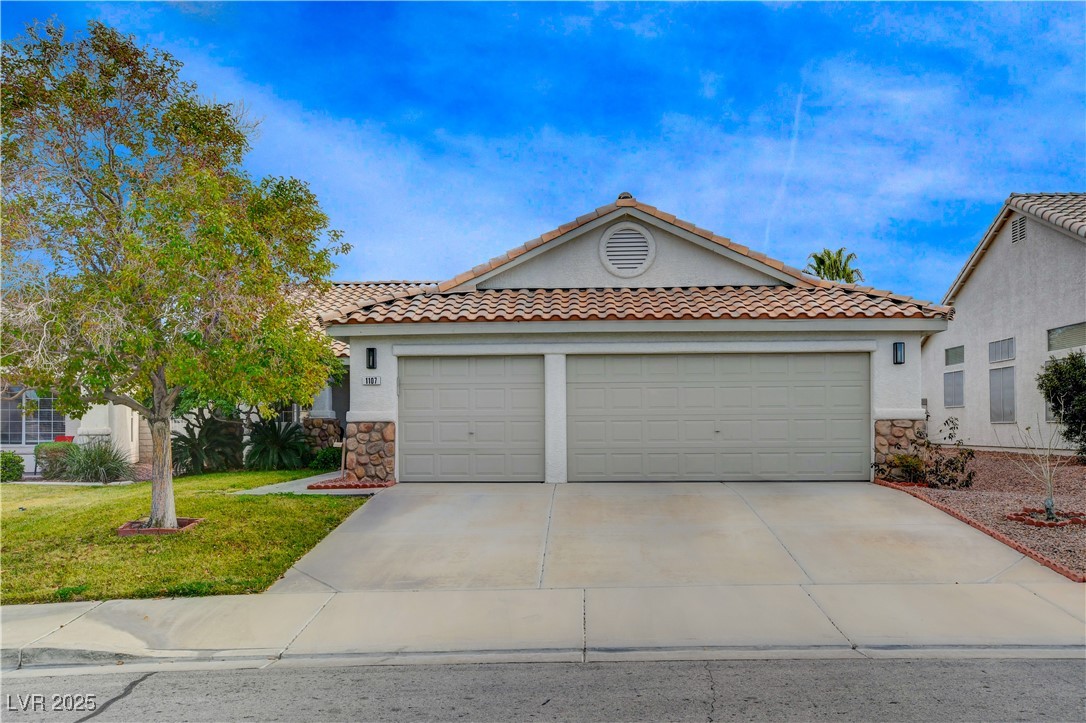
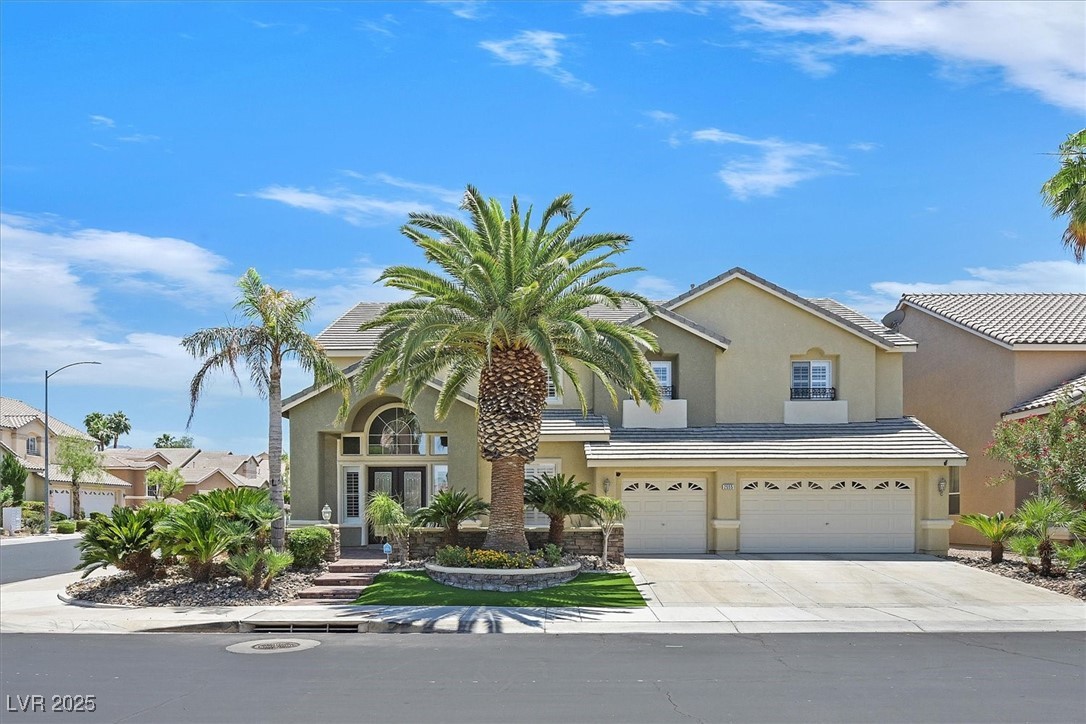
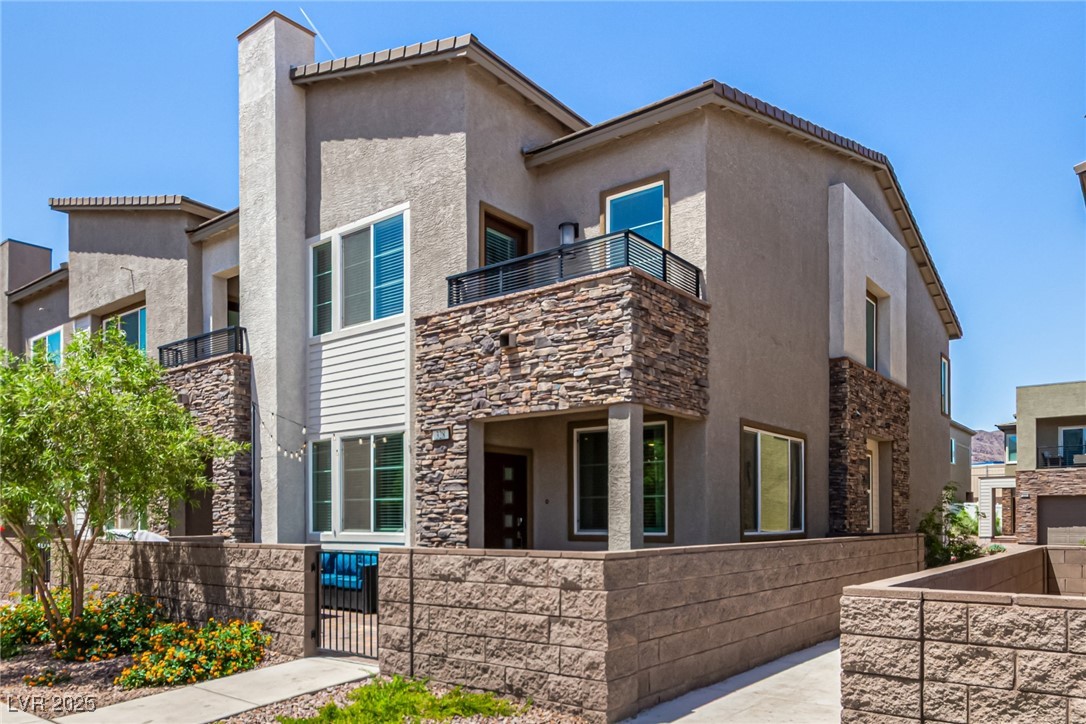
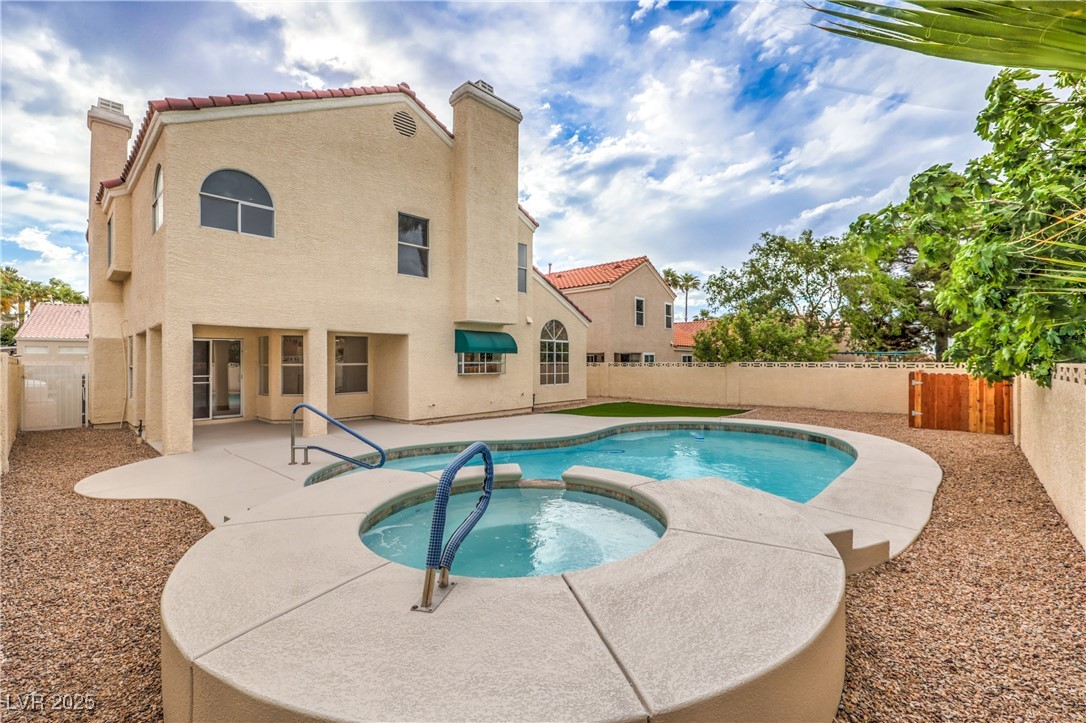
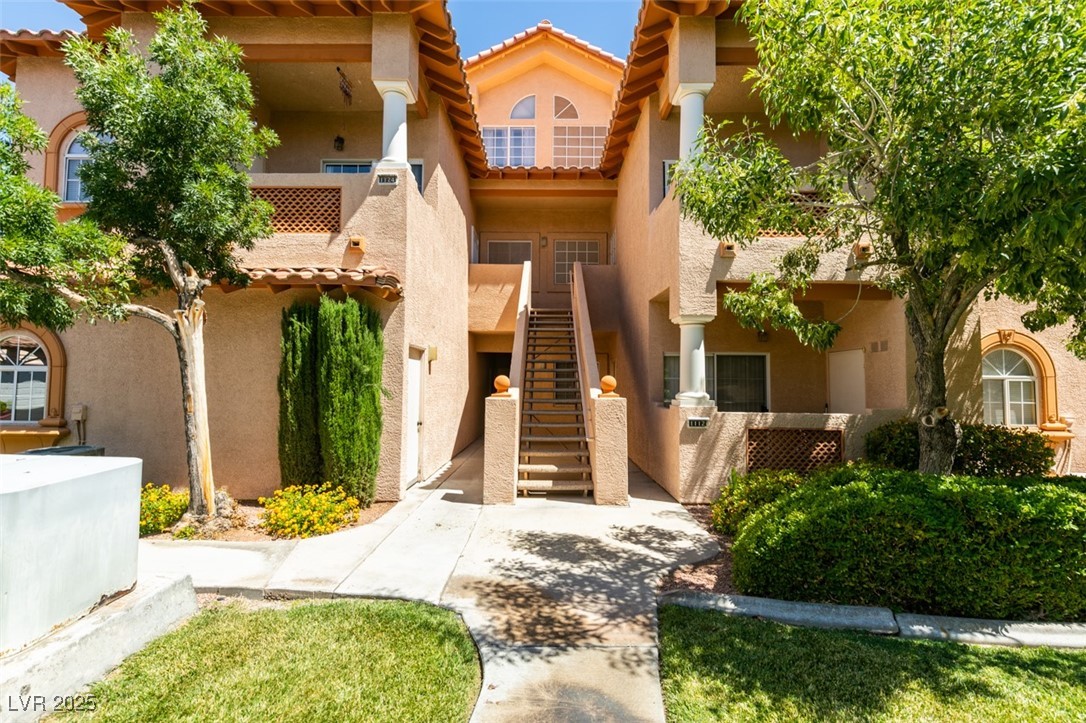
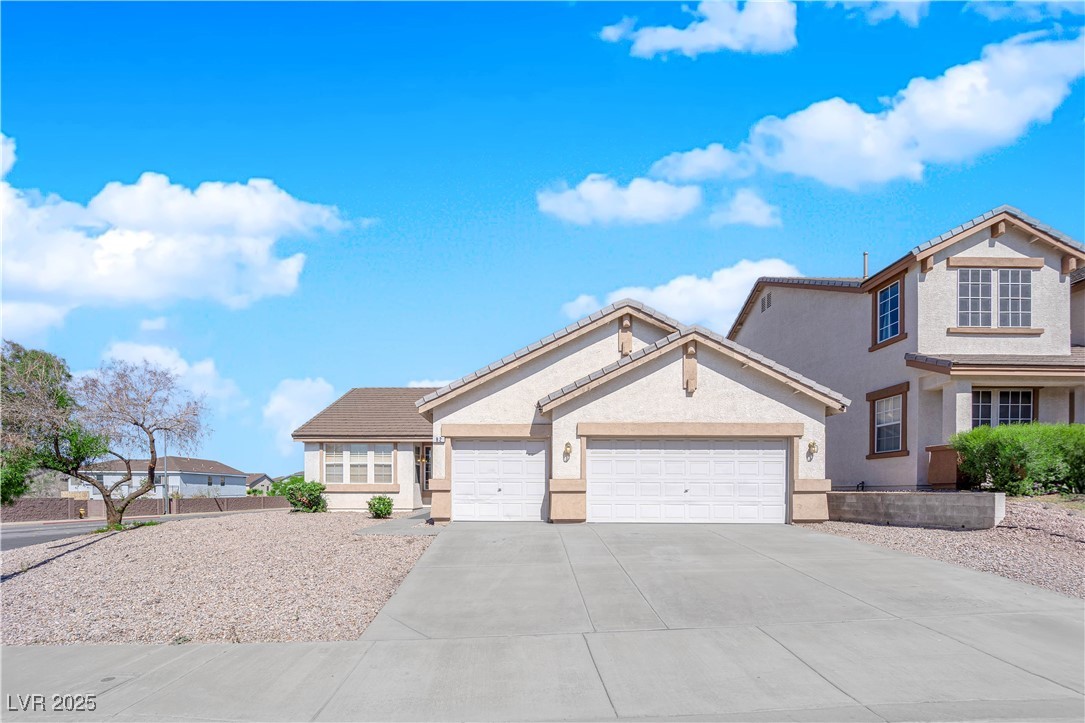
Active
$499,900
3
bds
|
2
ba
|
1,422
sqft
|
built
2000
1107 Cloudy Day Dr, Henderson, NV 89074
$119
Cash flow
1.2%
Cash-on-Cash Return
6.0%
Cap rate
0.8%
Rent to Value Ratio
1,292 out of 1,367 properties for sale in Henderson, NV
Limited Results Shown
Create a free account, or log in to reveal all property listings and enjoy the complete experience.
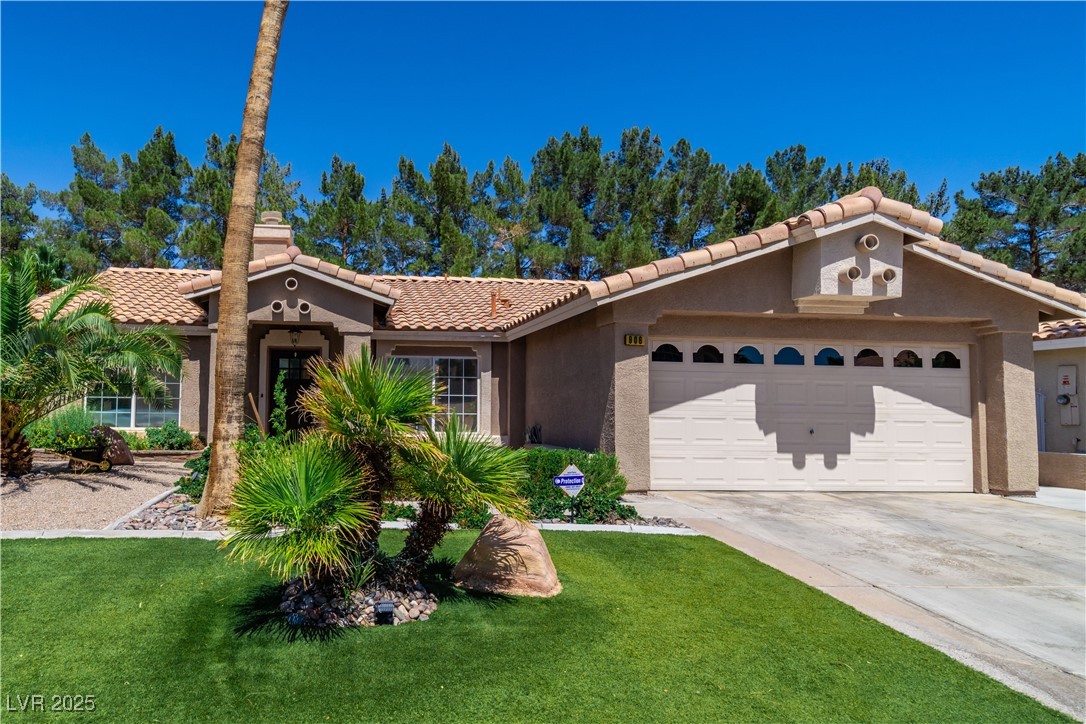
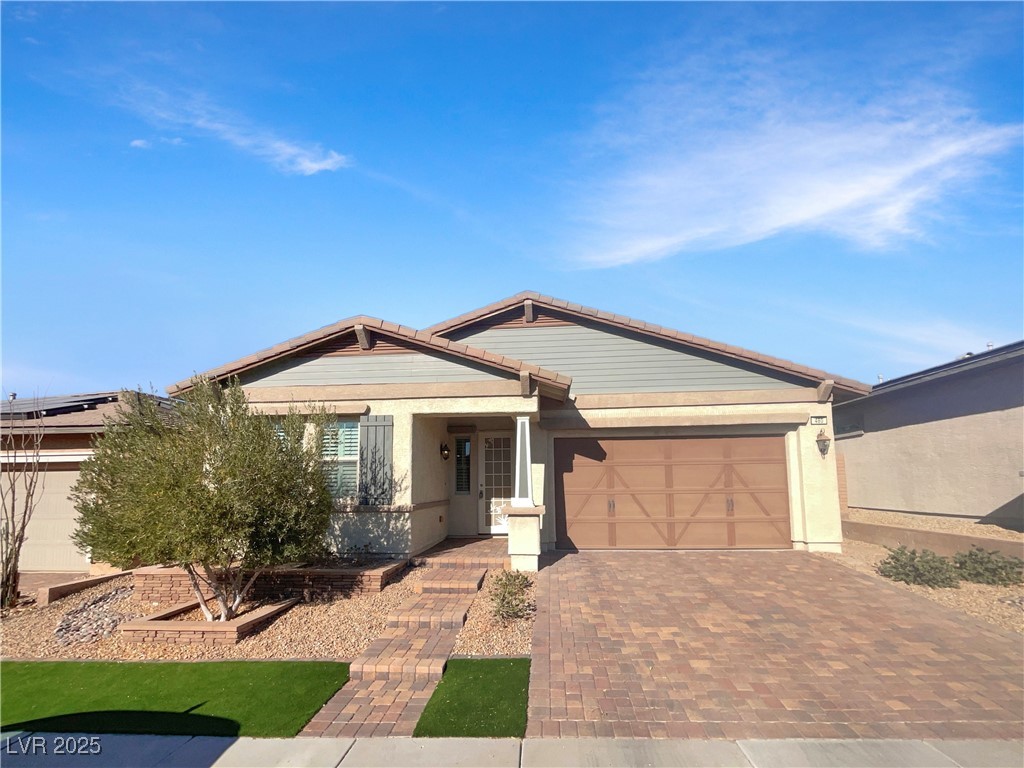
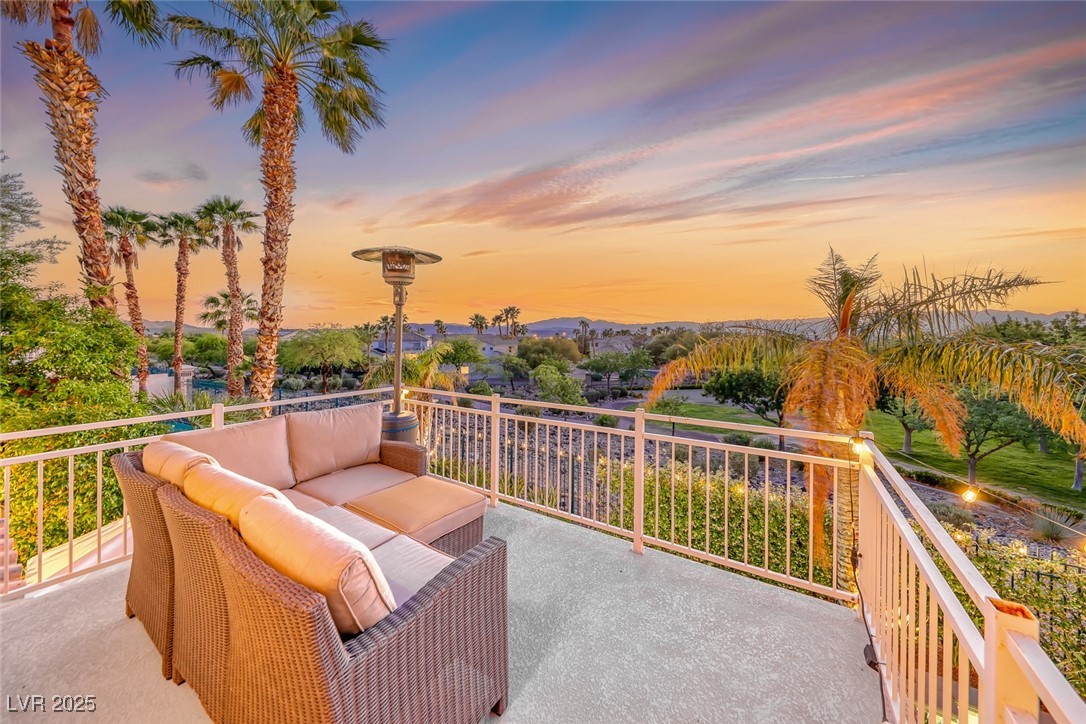
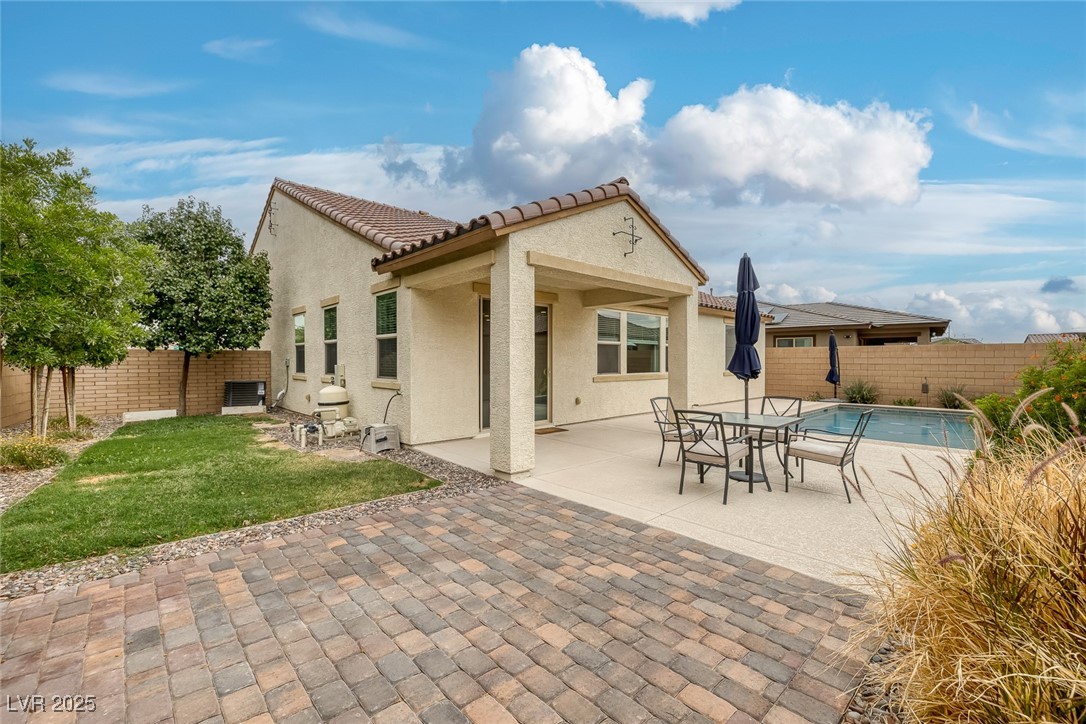
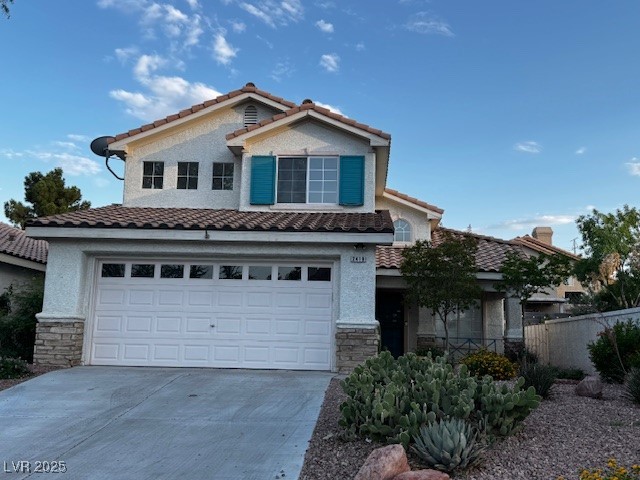
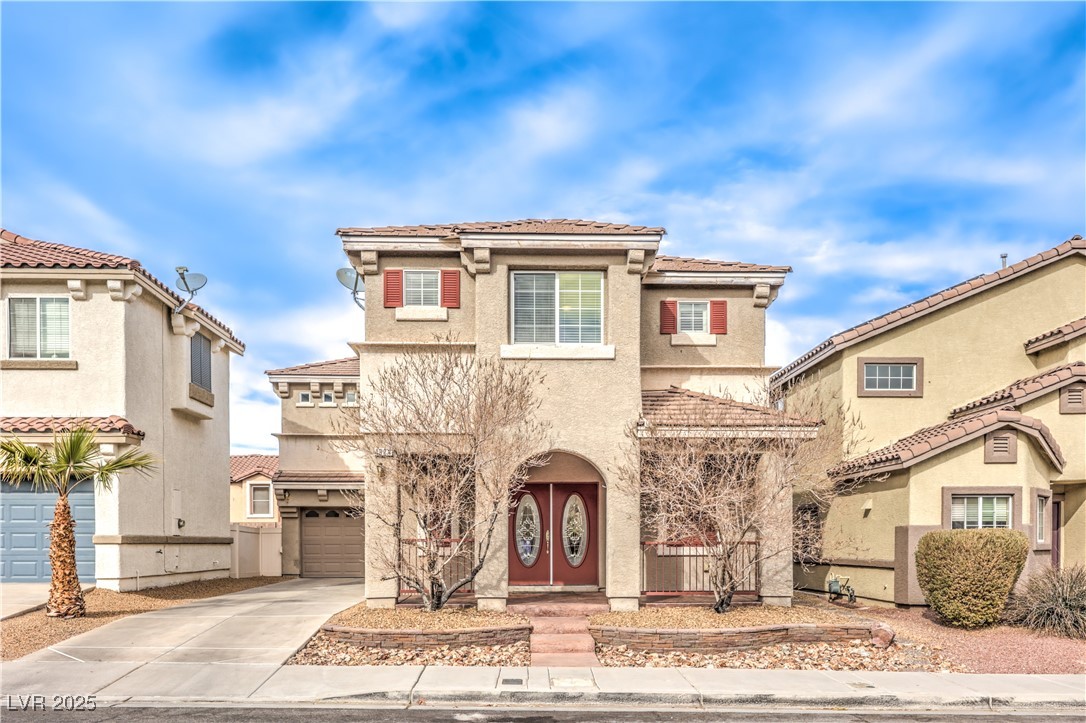
Active
$589,000
3
bds
|
2
ba
|
1,693
sqft
|
built
1994
906 Sitting Bull Dr, Henderson, NV 89014
$-1,457
Cash flow
-12.9%
Cash-on-Cash Return
2.7%
Cap rate
0.4%
Rent to Value Ratio
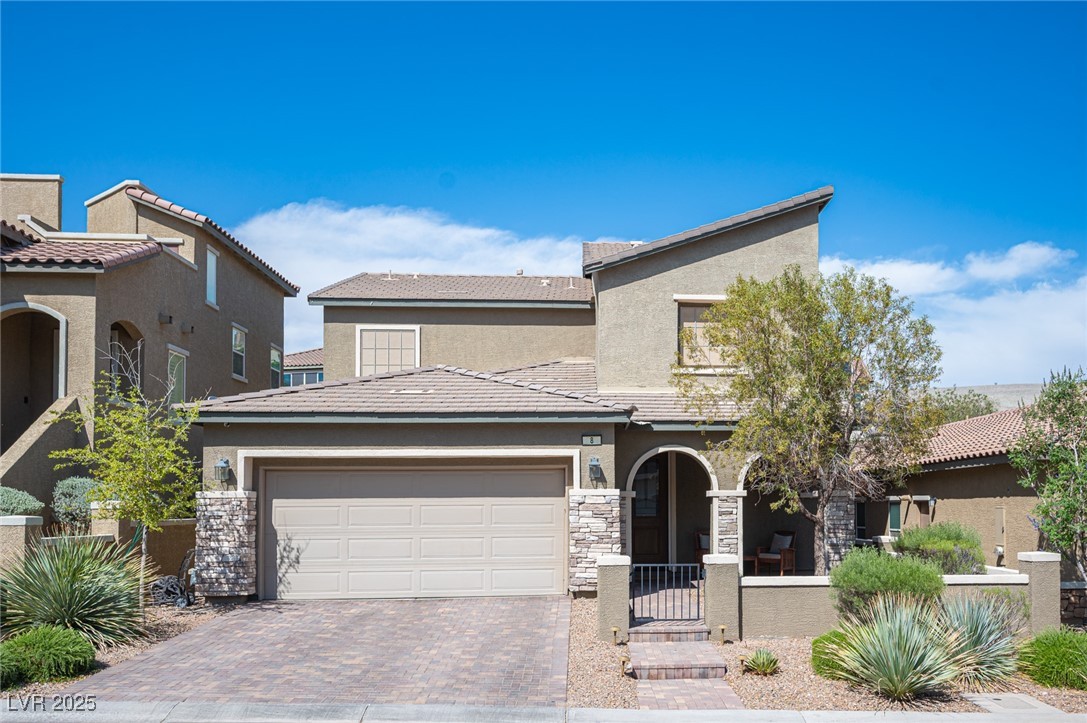
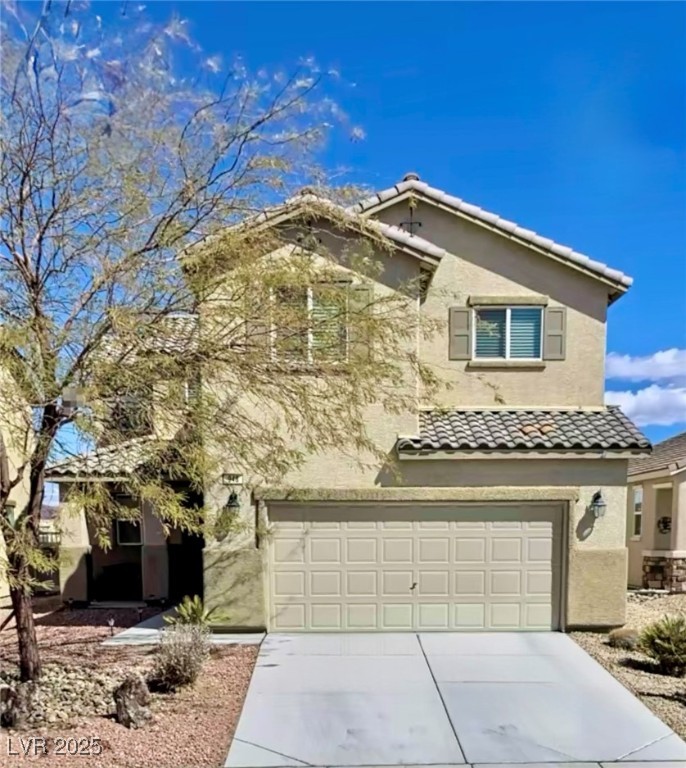
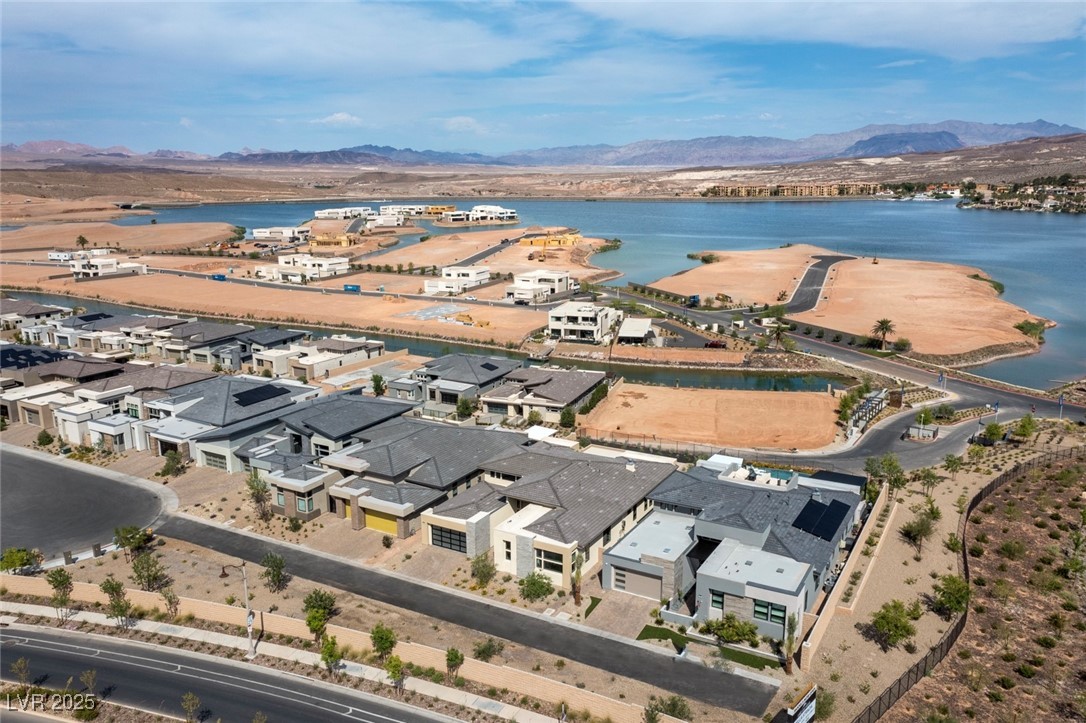
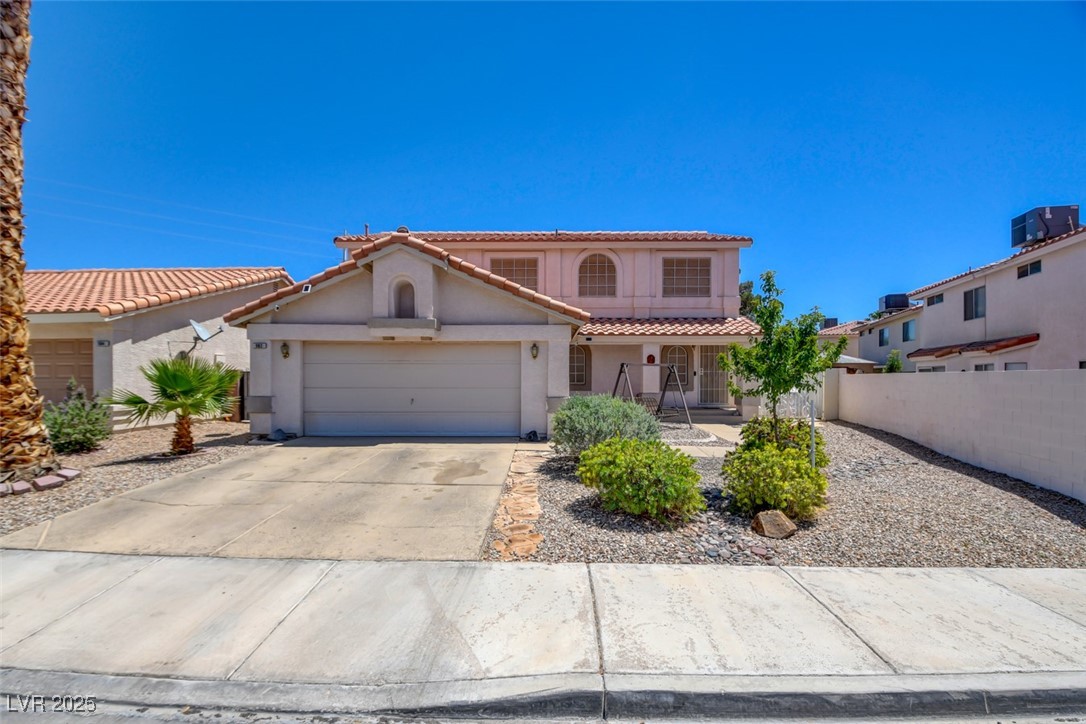
Pending
$650,000
4
bds
|
4
ba
|
2,520
sqft
|
built
2017
8 Via Dolcetto, Henderson, NV 89011
$-1,297
Cash flow
-10.4%
Cash-on-Cash Return
3.3%
Cap rate
0.5%
Rent to Value Ratio
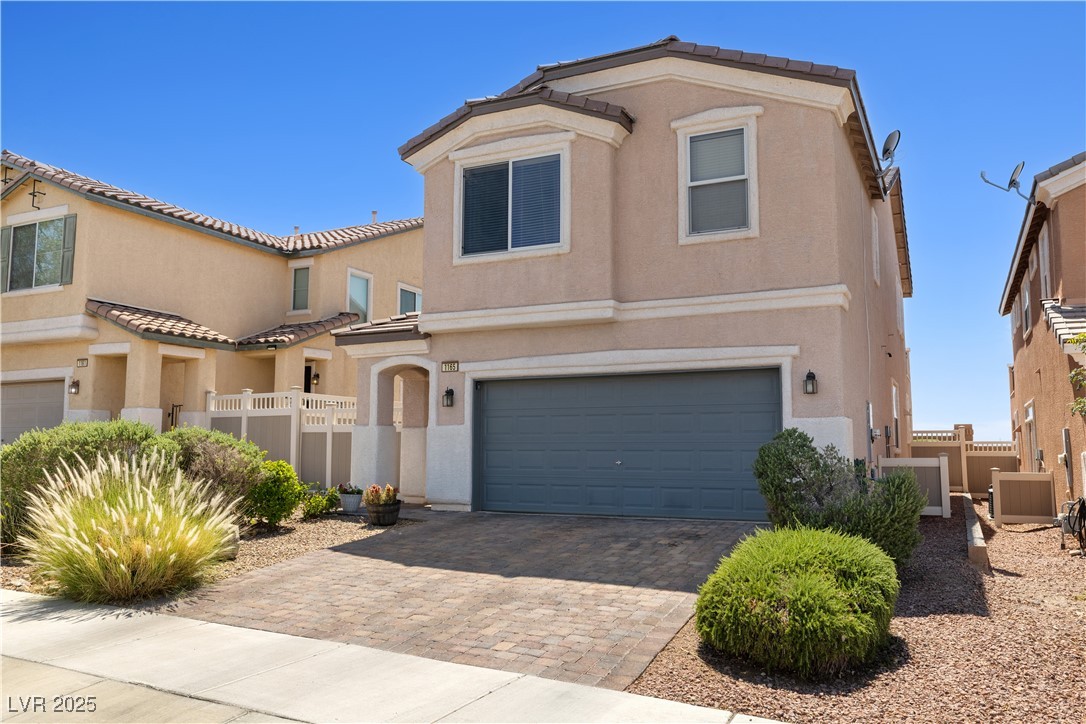
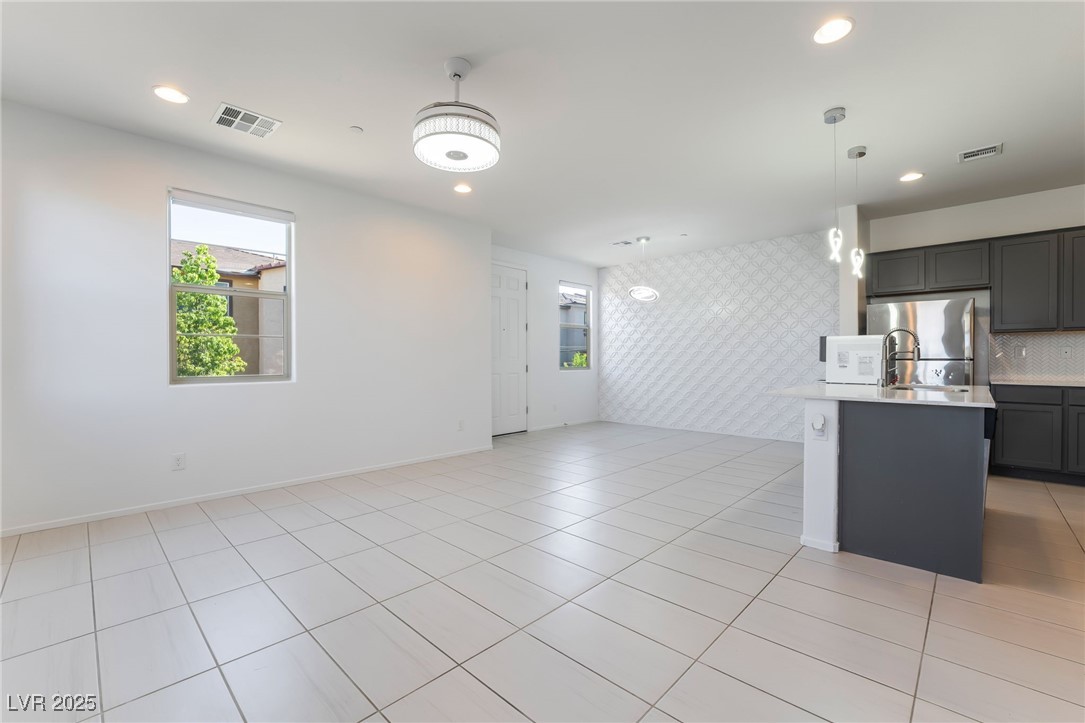
Active under contract
$499,999
4
bds
|
2
ba
|
1,864
sqft
|
built
2000
1079 Oak Shade Ln, Henderson, NV 89015
$-819
Cash flow
-8.5%
Cash-on-Cash Return
3.7%
Cap rate
0.5%
Rent to Value Ratio
Active
$1,199,999
5
bds
|
3
ba
|
4,368
sqft
|
built
2002
2555 Antique Blossom Ave, Henderson, NV 89052
$-3,711
Cash flow
-16.1%
Cash-on-Cash Return
2.0%
Cap rate
0.3%
Rent to Value Ratio
Active
$550,000
2
bds
|
2
ba
|
2,249
sqft
|
built
2016
480 Sterling Falls Ave, Henderson, NV 89011
$-1,233
Cash flow
-11.7%
Cash-on-Cash Return
3.0%
Cap rate
0.5%
Rent to Value Ratio
Active
$490,000
3
bds
|
3
ba
|
1,926
sqft
|
built
2012
948 Crescent Falls St, Henderson, NV 89011
$-1,051
Cash flow
-11.2%
Cash-on-Cash Return
3.1%
Cap rate
0.4%
Rent to Value Ratio
Active
$580,000
3
bds
|
2
ba
|
1,963
sqft
|
built
2000
967 Cardelina Ln, Henderson, NV 89052
$-1,249
Cash flow
-11.2%
Cash-on-Cash Return
3.1%
Cap rate
0.4%
Rent to Value Ratio
Active
$430,000
4
bds
|
3
ba
|
1,936
sqft
|
built
2023
328 Owens Peak Dr, Henderson, NV 89015
$-974
Cash flow
-11.8%
Cash-on-Cash Return
3.0%
Cap rate
0.5%
Rent to Value Ratio
Active under contract
$799,000
4
bds
|
3
ba
|
2,777
sqft
|
built
1997
3050 Whispering Crest Dr, Henderson, NV 89052
$-2,030
Cash flow
-13.3%
Cash-on-Cash Return
2.6%
Cap rate
0.4%
Rent to Value Ratio
Active
$2,149,900
4
bds
|
5
ba
|
3,459
sqft
|
built
2024
104 Tre Pietre St, Henderson, NV 89011
$-8,809
Cash flow
-21.4%
Cash-on-Cash Return
0.8%
Cap rate
0.2%
Rent to Value Ratio
Active under contract
$899,999
4
bds
|
3
ba
|
2,866
sqft
|
built
2021
1038 Delbrook Ave, Henderson, NV 89012
$-2,448
Cash flow
-14.2%
Cash-on-Cash Return
2.4%
Cap rate
0.4%
Rent to Value Ratio
Active
$225,000
2
bds
|
2
ba
|
992
sqft
|
built
1983
573 Sellers Pl, Henderson, NV 89011
$-487
Cash flow
-11.3%
Cash-on-Cash Return
3.1%
Cap rate
0.6%
Rent to Value Ratio
Active
$899,000
4
bds
|
4
ba
|
4,562
sqft
|
built
2003
404 Via Sonador, Henderson, NV 89012
$-2,059
Cash flow
-11.9%
Cash-on-Cash Return
2.9%
Cap rate
0.4%
Rent to Value Ratio
Active
$500,000
3
bds
|
2
ba
|
1,704
sqft
|
built
1996
307 Oak Canyon Dr, Henderson, NV 89015
$-917
Cash flow
-9.6%
Cash-on-Cash Return
3.5%
Cap rate
0.5%
Rent to Value Ratio
Active
$525,000
4
bds
|
3
ba
|
1,812
sqft
|
built
2001
981 Leadville Meadows Dr, Henderson, NV 89052
$-1,137
Cash flow
-11.3%
Cash-on-Cash Return
3.1%
Cap rate
0.4%
Rent to Value Ratio
Active
$4,450,000
3
bds
|
5
ba
|
4,327
sqft
|
built
2020
507 Serenity Point Dr, Henderson, NV 89012
$-16,865
Cash flow
-19.8%
Cash-on-Cash Return
1.1%
Cap rate
0.2%
Rent to Value Ratio
Active
$599,995
3
bds
|
3
ba
|
1,925
sqft
|
built
1991
2107 Fountain Springs Dr, Henderson, NV 89074
$-1,359
Cash flow
-11.8%
Cash-on-Cash Return
3.0%
Cap rate
0.4%
Rent to Value Ratio
Active
$649,999
3
bds
|
3
ba
|
2,048
sqft
|
built
2017
489 Intonation St, Henderson, NV 89011
$-1,609
Cash flow
-12.9%
Cash-on-Cash Return
2.7%
Cap rate
0.4%
Rent to Value Ratio
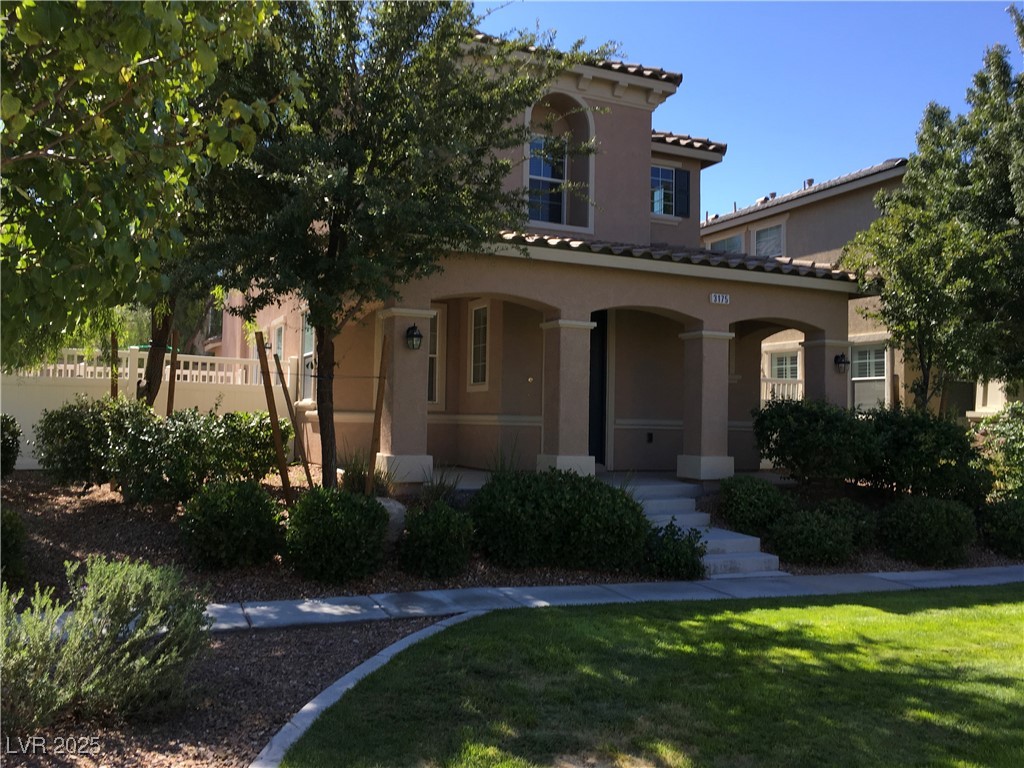
Active
$425,000
3
bds
|
3
ba
|
1,513
sqft
|
built
2009
3175 Obscured Light Walk, Henderson, NV 89044
$-1,103
Cash flow
-13.5%
Cash-on-Cash Return
2.6%
Cap rate
0.5%
Rent to Value Ratio
Pending
$450,000
3
bds
|
2
ba
|
1,615
sqft
|
built
1984
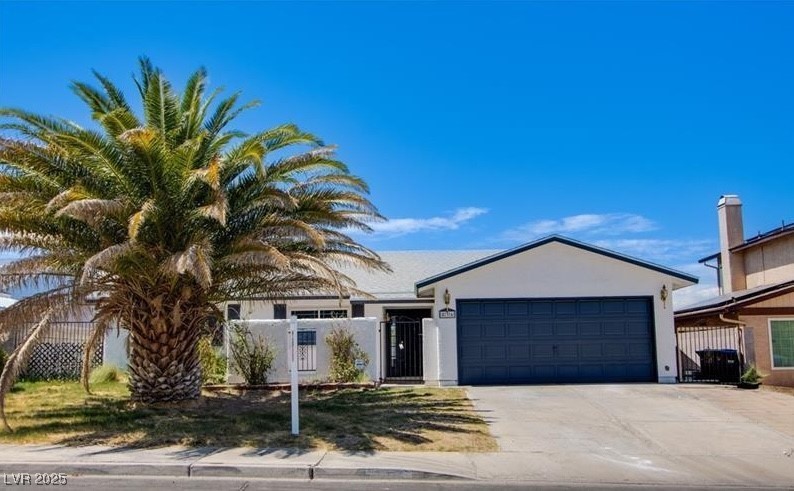
836 Cherry Dr, Henderson, NV 89002
$-325
Cash flow
-3.8%
Cash-on-Cash Return
4.8%
Cap rate
0.6%
Rent to Value Ratio
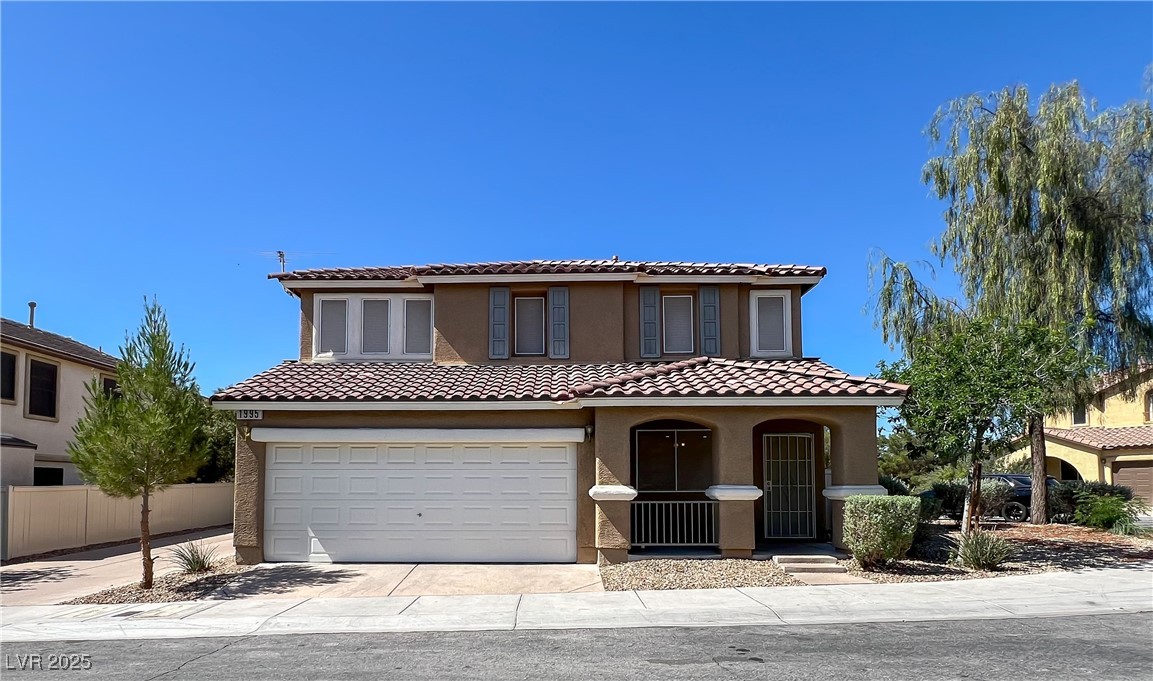
Active
$435,000
3
bds
|
3
ba
|
1,483
sqft
|
built
2005
1995 Sundown Canyon Dr, Henderson, NV 89014
$-931
Cash flow
-11.2%
Cash-on-Cash Return
3.1%
Cap rate
0.5%
Rent to Value Ratio
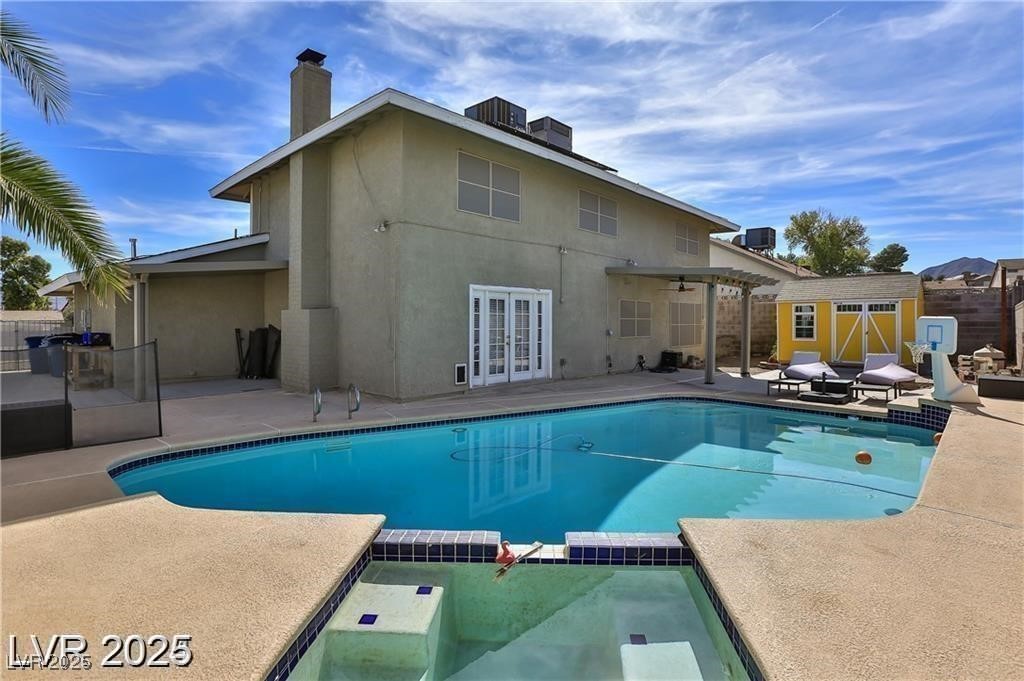
Active
$579,000
4
bds
|
3
ba
|
2,198
sqft
|
built
1982
722 Barrie Ct, Henderson, NV 89002
$-982
Cash flow
-8.8%
Cash-on-Cash Return
3.6%
Cap rate
0.5%
Rent to Value Ratio
Active
$555,000
3
bds
|
3
ba
|
2,048
sqft
|
built
2019
605 Cadence Vista Dr, Henderson, NV 89011
$-1,409
Cash flow
-13.2%
Cash-on-Cash Return
2.6%
Cap rate
0.5%
Rent to Value Ratio
Active
$305,000
3
bds
|
2
ba
|
1,507
sqft
|
built
1996
2925 Wigwam Pkwy, Henderson, NV 89074
$-798
Cash flow
-13.7%
Cash-on-Cash Return
2.5%
Cap rate
0.6%
Rent to Value Ratio
Active
$439,500
3
bds
|
3
ba
|
1,517
sqft
|
built
1994
2419 Pebble Springs Ct, Henderson, NV 89074
$-760
Cash flow
-9.0%
Cash-on-Cash Return
3.6%
Cap rate
0.5%
Rent to Value Ratio
Active
$470,000
3
bds
|
3
ba
|
1,976
sqft
|
built
2009
1165 Cactus Rock St, Henderson, NV 89011
$-510
Cash flow
-5.7%
Cash-on-Cash Return
4.4%
Cap rate
0.6%
Rent to Value Ratio

Active
$11,650,000
5
bds
|
6
ba
|
8,438
sqft
|
built
2021
6 Vista Crescent Ct, Henderson, NV 89012
$-59,079
Cash flow
-26.5%
Cash-on-Cash Return
-0.4%
Cap rate
0.0%
Rent to Value Ratio
Active
$499,900
3
bds
|
2
ba
|
1,422
sqft
|
built
2000
1107 Cloudy Day Dr, Henderson, NV 89074
$119
Cash flow
1.2%
Cash-on-Cash Return
6.0%
Cap rate
0.8%
Rent to Value Ratio
Active
$439,999
3
bds
|
2
ba
|
2,104
sqft
|
built
1954
107 Elm St, Henderson, NV 89015
$-359
Cash flow
-4.3%
Cash-on-Cash Return
4.7%
Cap rate
0.6%
Rent to Value Ratio
Active
$550,000
4
bds
|
3
ba
|
2,267
sqft
|
built
1987
390 Rushing Creek Ct, Henderson, NV 89014
$215
Cash flow
2.0%
Cash-on-Cash Return
6.1%
Cap rate
0.8%
Rent to Value Ratio

Active
$273,000
2
bds
|
2
ba
|
1,249
sqft
|
built
2007
833 Aspen Peak Loop, Henderson, NV 89011
$-390
Cash flow
-7.5%
Cash-on-Cash Return
4.0%
Cap rate
0.7%
Rent to Value Ratio
Pending
$499,900
3
bds
|
2
ba
|
1,970
sqft
|
built
2001
82 Autumn Day St, Henderson, NV 89012
$-1,010
Cash flow
-10.5%
Cash-on-Cash Return
3.3%
Cap rate
0.5%
Rent to Value Ratio
Active
$479,900
3
bds
|
3
ba
|
1,596
sqft
|
built
2006
21 Via Visione, Henderson, NV 89011
$-858
Cash flow
-9.3%
Cash-on-Cash Return
3.5%
Cap rate
0.6%
Rent to Value Ratio
Active
$975,000
4
bds
|
4
ba
|
3,222
sqft
|
built
2016
800 Loch Katrine Ave, Henderson, NV 89012
$-483
Cash flow
-2.6%
Cash-on-Cash Return
5.1%
Cap rate
0.7%
Rent to Value Ratio
Active
$430,000
3
bds
|
3
ba
|
1,901
sqft
|
built
2010
684 Calamus Palm Pl, Henderson, NV 89011
$-885
Cash flow
-10.7%
Cash-on-Cash Return
3.2%
Cap rate
0.5%
Rent to Value Ratio
Active
$509,900
3
bds
|
3
ba
|
2,252
sqft
|
built
2007
1324 Spice Ridge Ct, Henderson, NV 89012
$-928
Cash flow
-9.5%
Cash-on-Cash Return
3.5%
Cap rate
0.5%
Rent to Value Ratio

Active
$485,000
3
bds
|
2
ba
|
1,780
sqft
|
built
2003
114 Whistler St, Henderson, NV 89012
$-887
Cash flow
-9.5%
Cash-on-Cash Return
3.5%
Cap rate
0.5%
Rent to Value Ratio
Active
$499,000
4
bds
|
3
ba
|
1,829
sqft
|
built
1990
982 Flapjack Dr, Henderson, NV 89014
$-801
Cash flow
-8.4%
Cash-on-Cash Return
3.8%
Cap rate
0.5%
Rent to Value Ratio
Active
$385,000
3
bds
|
3
ba
|
1,712
sqft
|
built
2021
756 Sleeping City Ave, Henderson, NV 89015
$-850
Cash flow
-11.5%
Cash-on-Cash Return
3.0%
Cap rate
0.5%
Rent to Value Ratio
Active
$429,999
5
bds
|
3
ba
|
1,836
sqft
|
built
2006
529 Fork Mesa Ct, Henderson, NV 89015
$-882
Cash flow
-10.7%
Cash-on-Cash Return
3.2%
Cap rate
0.5%
Rent to Value Ratio