Henderson, NV Investment Properties for Sale
Browse homes for sale and investment properties in Henderson, NV. Refine your search by price, property type, or more.
Best cash flowing properties in Henderson, NV

Active
$249,900
2
bds
|
2
ba
|
1,160
sqft
|
built
2006
833 Aspen Peak Loop, Henderson, NV 89011
$-627
Cash flow
-13.1%
Cash-on-Cash Return
3.3%
Cap rate
0.6%
Rent to Value Ratio

Active
$325,000
2
bds
|
2
ba
|
1,253
sqft
|
built
2003
830 Carnegie St, Henderson, NV 89052
$-929
Cash flow
-14.9%
Cash-on-Cash Return
2.8%
Cap rate
0.5%
Rent to Value Ratio
1,157 out of 1,460 properties for sale in Henderson, NV
Limited Results Shown
Create a free account, or log in to reveal all property listings and enjoy the complete experience.

Active
$850,000
4
bds
|
3
ba
|
3,604
sqft
|
built
1983
2416 Greens Ave, Henderson, NV 89014
$-1,990
Cash flow
-12.2%
Cash-on-Cash Return
3.5%
Cap rate
0.5%
Rent to Value Ratio
Active
$899,990
4
bds
|
3
ba
|
2,622
sqft
|
built
1992
1921 Spyglass Dr, Henderson, NV 89074
$-1,838
Cash flow
-10.7%
Cash-on-Cash Return
3.8%
Cap rate
0.6%
Rent to Value Ratio
Active
$735,000
4
bds
|
4
ba
|
3,605
sqft
|
built
1998
722 Descartes Ave, Henderson, NV 89002
$-2,411
Cash flow
-17.1%
Cash-on-Cash Return
2.3%
Cap rate
0.4%
Rent to Value Ratio

Active
$6,800,000
5
bds
|
6
ba
|
6,017
sqft
|
built
2022
1 Costa Del Sol Ct, Henderson, NV 89011
$-32,650
Cash flow
-25.1%
Cash-on-Cash Return
0.5%
Cap rate
0.1%
Rent to Value Ratio
Active
$3,900,000
4
bds
|
6
ba
|
4,469
sqft
|
built
2022
2827 Richmar Ave, Henderson, NV 89074
$-18,211
Cash flow
-24.4%
Cash-on-Cash Return
0.7%
Cap rate
0.1%
Rent to Value Ratio

Active
$1,774,777
5
bds
|
5
ba
|
4,280
sqft
|
built
2023
302 Watteau Ct, Henderson, NV 89012
$-7,502
Cash flow
-22.1%
Cash-on-Cash Return
1.2%
Cap rate
0.2%
Rent to Value Ratio

Active
$1,850,000
5
bds
|
5
ba
|
4,280
sqft
|
built
2022
286 Shaded Canyon Dr, Henderson, NV 89012
$-7,616
Cash flow
-21.5%
Cash-on-Cash Return
1.3%
Cap rate
0.2%
Rent to Value Ratio
Active
$469,900
3
bds
|
3
ba
|
2,167
sqft
|
built
2023
712 Monroe Hill Pl, Henderson, NV 89011
$-1,145
Cash flow
-12.7%
Cash-on-Cash Return
3.3%
Cap rate
0.5%
Rent to Value Ratio

Active
$379,900
3
bds
|
3
ba
|
1,640
sqft
|
built
2022
207 Callen Falls Ave, Henderson, NV 89011
$-1,065
Cash flow
-14.6%
Cash-on-Cash Return
2.9%
Cap rate
0.5%
Rent to Value Ratio
Active
$1,700,000
3
bds
|
4
ba
|
3,459
sqft
|
built
2024
148 Tre Pietre St, Henderson, NV 89011
$-7,778
Cash flow
-23.9%
Cash-on-Cash Return
0.8%
Cap rate
0.2%
Rent to Value Ratio
Active
$2,149,900
4
bds
|
5
ba
|
3,459
sqft
|
built
2024
104 Tre Pietre St, Henderson, NV 89011
$-9,859
Cash flow
-23.9%
Cash-on-Cash Return
0.8%
Cap rate
0.2%
Rent to Value Ratio

Active
$1,450,000
5
bds
|
5
ba
|
3,709
sqft
|
built
2000
2940 Cimini Ct, Henderson, NV 89052
$-4,473
Cash flow
-16.1%
Cash-on-Cash Return
2.6%
Cap rate
0.4%
Rent to Value Ratio
Active
$669,999
4
bds
|
3
ba
|
2,632
sqft
|
built
2013
1617 Meadow Bluffs Ave, Henderson, NV 89014
$-1,763
Cash flow
-13.7%
Cash-on-Cash Return
3.1%
Cap rate
0.5%
Rent to Value Ratio

Active
$3,250,000
5
bds
|
7
ba
|
6,918
sqft
|
built
2002
2660 Mirabella St, Henderson, NV 89052
$-10,670
Cash flow
-17.1%
Cash-on-Cash Return
2.3%
Cap rate
0.4%
Rent to Value Ratio

Active
$615,000
5
bds
|
3
ba
|
2,544
sqft
|
built
1998
2367 Tilden Way, Henderson, NV 89074
$-1,677
Cash flow
-14.2%
Cash-on-Cash Return
3.0%
Cap rate
0.4%
Rent to Value Ratio
Active
$325,000
2
bds
|
2
ba
|
1,253
sqft
|
built
2003
830 Carnegie St, Henderson, NV 89052
$-929
Cash flow
-14.9%
Cash-on-Cash Return
2.8%
Cap rate
0.5%
Rent to Value Ratio

Active
$1,450,000
5
bds
|
4
ba
|
3,608
sqft
|
built
2017
795 Glistening Light Ct, Henderson, NV 89052
$-2,363
Cash flow
-8.5%
Cash-on-Cash Return
4.3%
Cap rate
0.6%
Rent to Value Ratio

Active
$550,000
2
bds
|
2
ba
|
2,249
sqft
|
built
2016
480 Sterling Falls Ave, Henderson, NV 89011
$-1,501
Cash flow
-14.2%
Cash-on-Cash Return
3.0%
Cap rate
0.5%
Rent to Value Ratio
Active
$529,999
3
bds
|
3
ba
|
2,034
sqft
|
built
2019
961 Cutter St, Henderson, NV 89011
$-1,475
Cash flow
-14.5%
Cash-on-Cash Return
2.9%
Cap rate
0.5%
Rent to Value Ratio

Active
$1,175,000
4
bds
|
4
ba
|
3,436
sqft
|
built
2005
2764 Kilwinning Dr, Henderson, NV 89044
$-3,901
Cash flow
-17.3%
Cash-on-Cash Return
2.3%
Cap rate
0.3%
Rent to Value Ratio
Active
$2,300,000
4
bds
|
5
ba
|
3,942
sqft
|
built
2003
33 Hassayampa Trl, Henderson, NV 89052
$-7,616
Cash flow
-17.3%
Cash-on-Cash Return
2.3%
Cap rate
0.3%
Rent to Value Ratio

Active
$998,000
4
bds
|
3
ba
|
3,000
sqft
|
built
2006
2197 Big Bar Dr, Henderson, NV 89052
$-3,025
Cash flow
-15.8%
Cash-on-Cash Return
2.6%
Cap rate
0.4%
Rent to Value Ratio

Active
$439,500
3
bds
|
3
ba
|
1,517
sqft
|
built
1994
2419 Pebble Springs Ct, Henderson, NV 89074
$-975
Cash flow
-11.6%
Cash-on-Cash Return
3.6%
Cap rate
0.5%
Rent to Value Ratio
Active
$1,199,900
5
bds
|
6
ba
|
4,708
sqft
|
built
2007
2717 Mona Lisa St, Henderson, NV 89044
$-2,847
Cash flow
-12.4%
Cash-on-Cash Return
3.4%
Cap rate
0.5%
Rent to Value Ratio
Active
$249,900
2
bds
|
2
ba
|
1,160
sqft
|
built
2006
833 Aspen Peak Loop, Henderson, NV 89011
$-627
Cash flow
-13.1%
Cash-on-Cash Return
3.3%
Cap rate
0.6%
Rent to Value Ratio
Active
$674,000
5
bds
|
3
ba
|
2,978
sqft
|
built
2015
780 Flowing Meadow Dr, Henderson, NV 89014
$-1,582
Cash flow
-12.2%
Cash-on-Cash Return
3.4%
Cap rate
0.5%
Rent to Value Ratio

Active
$425,000
3
bds
|
3
ba
|
1,513
sqft
|
built
2009
3175 Obscured Light Walk, Henderson, NV 89044
$-1,311
Cash flow
-16.1%
Cash-on-Cash Return
2.6%
Cap rate
0.5%
Rent to Value Ratio

Active
$460,000
4
bds
|
3
ba
|
1,862
sqft
|
built
1993
8788 Elise Ct, Henderson, NV 89074
$-1,019
Cash flow
-11.6%
Cash-on-Cash Return
3.6%
Cap rate
0.5%
Rent to Value Ratio

Active
$305,000
3
bds
|
2
ba
|
1,507
sqft
|
built
1996
2925 Wigwam Pkwy, Henderson, NV 89074
$-947
Cash flow
-16.2%
Cash-on-Cash Return
2.5%
Cap rate
0.6%
Rent to Value Ratio
Active
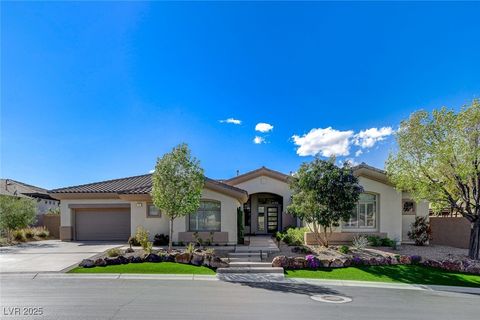
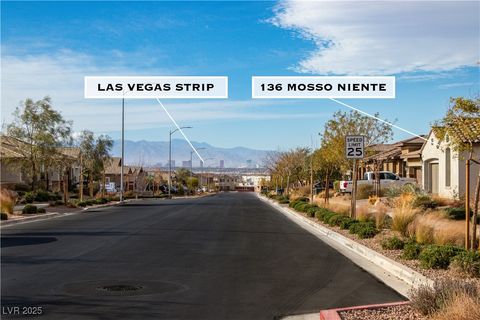
$624,500
3
bds
|
2
ba
|
2,195
sqft
|
built
2021
136 Mosso Niente Pl, Henderson, NV 89011
$-1,862
Cash flow
-15.6%
Cash-on-Cash Return
2.7%
Cap rate
0.4%
Rent to Value Ratio

Active
$699,900
3
bds
|
3
ba
|
2,100
sqft
|
built
2016
3084 Porte La Paz Ave, Henderson, NV 89044
$-2,233
Cash flow
-16.6%
Cash-on-Cash Return
2.4%
Cap rate
0.4%
Rent to Value Ratio

Active
$1,250,000
6
bds
|
6
ba
|
4,708
sqft
|
built
2010
2908 Ferrand Ct, Henderson, NV 89044
$-3,767
Cash flow
-15.7%
Cash-on-Cash Return
2.6%
Cap rate
0.4%
Rent to Value Ratio
Active
$525,000
4
bds
|
3
ba
|
1,812
sqft
|
built
2001
981 Leadville Meadows Dr, Henderson, NV 89052
$-1,394
Cash flow
-13.9%
Cash-on-Cash Return
3.1%
Cap rate
0.4%
Rent to Value Ratio
Active
$2,150,000
6
bds
|
6
ba
|
7,259
sqft
|
built
1998
2086 Troon Dr, Henderson, NV 89074
$-7,200
Cash flow
-17.5%
Cash-on-Cash Return
2.2%
Cap rate
0.4%
Rent to Value Ratio
Active
$1,585,000
7
bds
|
6
ba
|
4,077
sqft
|
built
2008
2900 Valvent Ct, Henderson, NV 89044
$-4,819
Cash flow
-15.9%
Cash-on-Cash Return
2.6%
Cap rate
0.4%
Rent to Value Ratio

Active
$6,999,000
4
bds
|
8
ba
|
7,460
sqft
|
built
2015
1269 Imperia Dr, Henderson, NV 89052
$-32,728
Cash flow
-24.4%
Cash-on-Cash Return
0.7%
Cap rate
0.1%
Rent to Value Ratio

Active
$1,125,000
4
bds
|
5
ba
|
3,369
sqft
|
built
2009
2800 Proust Ct, Henderson, NV 89044
$-3,996
Cash flow
-18.5%
Cash-on-Cash Return
2.0%
Cap rate
0.3%
Rent to Value Ratio
Active
$419,900
3
bds
|
2
ba
|
1,518
sqft
|
built
1999
1013 Adobe Flat Dr, Henderson, NV 89011
$-1,166
Cash flow
-14.5%
Cash-on-Cash Return
2.9%
Cap rate
0.4%
Rent to Value Ratio
Active
$499,999
3
bds
|
3
ba
|
2,090
sqft
|
built
2004
2482 Denholme St, Henderson, NV 89044
$-1,382
Cash flow
-14.4%
Cash-on-Cash Return
2.9%
Cap rate
0.5%
Rent to Value Ratio
Active
$490,000
3
bds
|
3
ba
|
1,926
sqft
|
built
2012
948 Crescent Falls St, Henderson, NV 89011
$-1,290
Cash flow
-13.7%
Cash-on-Cash Return
3.1%
Cap rate
0.4%
Rent to Value Ratio