Henderson, NV Investment Properties for Sale
Browse homes for sale and investment properties in Henderson, NV. Refine your search by price, property type, or more.
Best cash flowing properties in Henderson, NV
Active
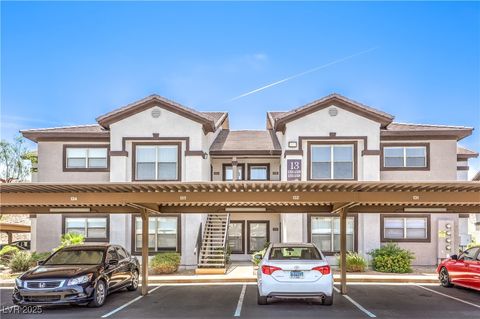
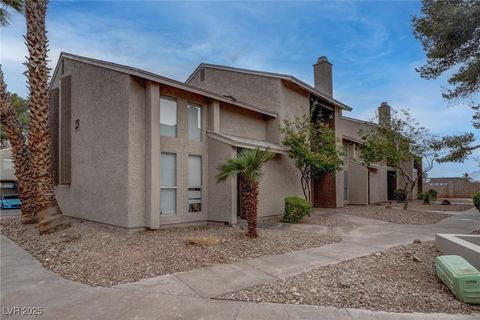
$270,000
2
bds
|
2
ba
|
1,029
sqft
|
built
2003
45 Maleena Mesa St, Henderson, NV 89074
$-532
Cash flow
-10.3%
Cash-on-Cash Return
3.9%
Cap rate
0.5%
Rent to Value Ratio
Active
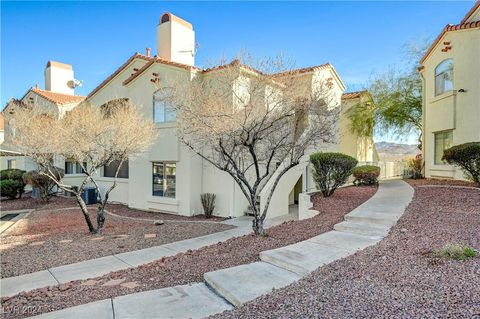
$260,900
2
bds
|
2
ba
|
1,151
sqft
|
built
1995
698 S Racetrack Rd, Henderson, NV 89015
$-540
Cash flow
-10.8%
Cash-on-Cash Return
3.8%
Cap rate
0.6%
Rent to Value Ratio
1,157 out of 1,460 properties for sale in Henderson, NV
Limited Results Shown
Create a free account, or log in to reveal all property listings and enjoy the complete experience.

Active
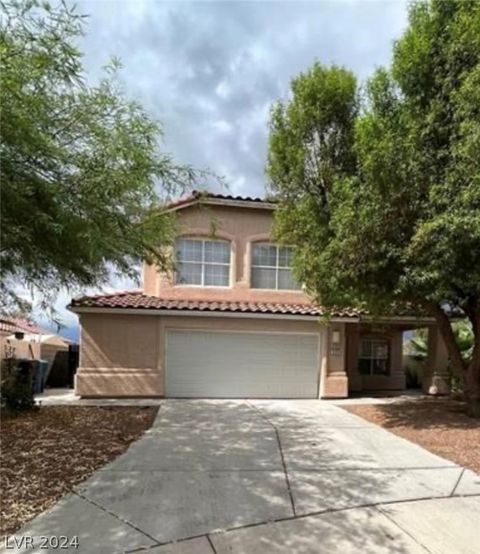
$579,000
4
bds
|
3
ba
|
2,198
sqft
|
built
1982
722 Barrie Ct, Henderson, NV 89002
$-1,265
Cash flow
-11.4%
Cash-on-Cash Return
3.6%
Cap rate
0.5%
Rent to Value Ratio

Active
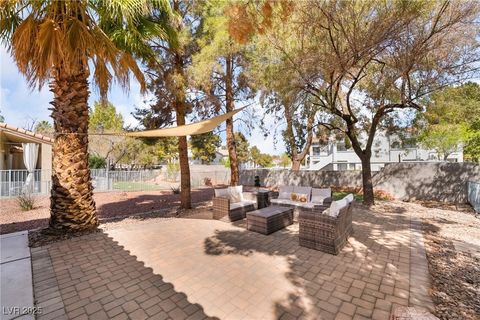
$625,000
5
bds
|
3
ba
|
2,940
sqft
|
built
2021
480 Silverweed Ave, Henderson, NV 89044
$-1,658
Cash flow
-13.8%
Cash-on-Cash Return
3.1%
Cap rate
0.5%
Rent to Value Ratio

Active
$625,000
3
bds
|
3
ba
|
2,056
sqft
|
built
1999
283 New River Cir, Henderson, NV 89052
$-1,422
Cash flow
-11.9%
Cash-on-Cash Return
3.5%
Cap rate
0.5%
Rent to Value Ratio
Active
$549,900
4
bds
|
3
ba
|
2,246
sqft
|
built
1997
994 River Walk Ct, Henderson, NV 89015
$-1,670
Cash flow
-15.8%
Cash-on-Cash Return
2.6%
Cap rate
0.4%
Rent to Value Ratio
Active
$419,000
2
bds
|
3
ba
|
1,811
sqft
|
built
1997
2246 Cassatt Dr, Henderson, NV 89074
$-1,472
Cash flow
-18.3%
Cash-on-Cash Return
2.0%
Cap rate
0.5%
Rent to Value Ratio

Active
$530,000
4
bds
|
2
ba
|
1,933
sqft
|
built
1997
1552 Livingston Dr, Henderson, NV 89012
$-1,397
Cash flow
-13.8%
Cash-on-Cash Return
3.1%
Cap rate
0.4%
Rent to Value Ratio
Active
$799,900
3
bds
|
3
ba
|
2,639
sqft
|
built
2014
2 Lago Turchino Ct, Henderson, NV 89011
$-2,404
Cash flow
-15.7%
Cash-on-Cash Return
2.7%
Cap rate
0.4%
Rent to Value Ratio

Active
$639,999
3
bds
|
2
ba
|
2,279
sqft
|
built
1997
240 Jumping Springs Pl, Henderson, NV 89012
$-1,778
Cash flow
-14.5%
Cash-on-Cash Return
2.9%
Cap rate
0.4%
Rent to Value Ratio

Active
$449,900
3
bds
|
3
ba
|
1,576
sqft
|
built
1989
2501 Muirfield Ave, Henderson, NV 89074
$-1,154
Cash flow
-13.4%
Cash-on-Cash Return
3.2%
Cap rate
0.4%
Rent to Value Ratio

Active
$690,000
4
bds
|
2
ba
|
2,119
sqft
|
built
2005
1044 Spanish Needle St, Henderson, NV 89002
$-1,937
Cash flow
-14.6%
Cash-on-Cash Return
2.9%
Cap rate
0.4%
Rent to Value Ratio

Active
$349,000
3
bds
|
2
ba
|
1,084
sqft
|
built
1982
528 Close Ave, Henderson, NV 89011
$-643
Cash flow
-9.6%
Cash-on-Cash Return
4.1%
Cap rate
0.5%
Rent to Value Ratio

Active
$799,900
4
bds
|
3
ba
|
2,973
sqft
|
built
1974
200 E Desert Rose Dr, Henderson, NV 89015
$-1,867
Cash flow
-12.2%
Cash-on-Cash Return
3.5%
Cap rate
0.5%
Rent to Value Ratio

Active
$639,999
3
bds
|
3
ba
|
2,526
sqft
|
built
2019
172 Lunga Ave, Henderson, NV 89011
$-1,768
Cash flow
-14.4%
Cash-on-Cash Return
2.9%
Cap rate
0.5%
Rent to Value Ratio
Active
$359,900
2
bds
|
2
ba
|
1,116
sqft
|
built
1983
403 Woodridge Dr, Henderson, NV 89015
$-717
Cash flow
-10.4%
Cash-on-Cash Return
3.9%
Cap rate
0.5%
Rent to Value Ratio

Active
$1,300,000
5
bds
|
3
ba
|
3,240
sqft
|
built
2020
2567 Speyburn Ave, Henderson, NV 89044
$-1,961
Cash flow
-7.9%
Cash-on-Cash Return
4.5%
Cap rate
0.6%
Rent to Value Ratio

Active
$789,000
3
bds
|
3
ba
|
2,276
sqft
|
built
2021
3395 Stone View Ave, Henderson, NV 89044
$-2,576
Cash flow
-17.0%
Cash-on-Cash Return
2.3%
Cap rate
0.4%
Rent to Value Ratio

Active
$715,000
3
bds
|
3
ba
|
2,290
sqft
|
built
2000
2986 Matese Dr, Henderson, NV 89052
$-2,146
Cash flow
-15.7%
Cash-on-Cash Return
2.7%
Cap rate
0.4%
Rent to Value Ratio

Active
$450,000
4
bds
|
3
ba
|
1,596
sqft
|
built
2006
26 Via Vasari, Henderson, NV 89011
$-1,160
Cash flow
-13.4%
Cash-on-Cash Return
3.2%
Cap rate
0.6%
Rent to Value Ratio

Active
$554,999
2
bds
|
2
ba
|
2,012
sqft
|
built
2003
65 Luce Del Sole, Henderson, NV 89011
$-1,765
Cash flow
-16.6%
Cash-on-Cash Return
2.4%
Cap rate
0.6%
Rent to Value Ratio
Active
$11,500,000
6
bds
|
10
ba
|
15,873
sqft
|
built
2002
3 Anthem Pointe Ct, Henderson, NV 89052
$-62,098
Cash flow
-28.2%
Cash-on-Cash Return
-0.2%
Cap rate
0.1%
Rent to Value Ratio
Active
$270,000
2
bds
|
2
ba
|
1,029
sqft
|
built
2003
45 Maleena Mesa St, Henderson, NV 89074
$-532
Cash flow
-10.3%
Cash-on-Cash Return
3.9%
Cap rate
0.5%
Rent to Value Ratio

Active
$315,000
2
bds
|
2
ba
|
1,291
sqft
|
built
1999
2325 Windmill Pkwy, Henderson, NV 89074
$-953
Cash flow
-15.8%
Cash-on-Cash Return
2.6%
Cap rate
0.5%
Rent to Value Ratio
Active
$485,000
3
bds
|
3
ba
|
2,191
sqft
|
built
2023
617 Sylvan St, Henderson, NV 89002
$-1,241
Cash flow
-13.4%
Cash-on-Cash Return
3.2%
Cap rate
0.5%
Rent to Value Ratio
Active
$225,000
2
bds
|
2
ba
|
992
sqft
|
built
1983
573 Sellers Pl, Henderson, NV 89011
$-597
Cash flow
-13.8%
Cash-on-Cash Return
3.1%
Cap rate
0.6%
Rent to Value Ratio

Active
$470,000
3
bds
|
3
ba
|
1,976
sqft
|
built
2009
1165 Cactus Rock St, Henderson, NV 89011
$-740
Cash flow
-8.2%
Cash-on-Cash Return
4.4%
Cap rate
0.6%
Rent to Value Ratio
Active
$495,000
3
bds
|
3
ba
|
1,687
sqft
|
built
2001
2333 Silver Crew Pass, Henderson, NV 89052
$-1,319
Cash flow
-13.9%
Cash-on-Cash Return
3.1%
Cap rate
0.4%
Rent to Value Ratio

Active
$409,900
4
bds
|
2
ba
|
1,584
sqft
|
built
1981
3115 Blossom Glen Dr, Henderson, NV 89014
$-913
Cash flow
-11.6%
Cash-on-Cash Return
3.6%
Cap rate
0.5%
Rent to Value Ratio

Active
$3,375,000
5
bds
|
8
ba
|
6,401
sqft
|
built
2006
2 Yorkridge Ct, Henderson, NV 89052
$-11,947
Cash flow
-18.5%
Cash-on-Cash Return
2.0%
Cap rate
0.3%
Rent to Value Ratio
Active
$462,000
3
bds
|
3
ba
|
1,920
sqft
|
built
2023
3732 Via Gennaro, Henderson, NV 89044
$-1,373
Cash flow
-15.5%
Cash-on-Cash Return
2.7%
Cap rate
0.5%
Rent to Value Ratio
Active
$260,900
2
bds
|
2
ba
|
1,151
sqft
|
built
1995
698 S Racetrack Rd, Henderson, NV 89015
$-540
Cash flow
-10.8%
Cash-on-Cash Return
3.8%
Cap rate
0.6%
Rent to Value Ratio

Active
$880,000
5
bds
|
5
ba
|
3,332
sqft
|
built
2016
3062 Echoed Rondel Ln, Henderson, NV 89044
$-2,377
Cash flow
-14.1%
Cash-on-Cash Return
3.0%
Cap rate
0.5%
Rent to Value Ratio

Active
$374,900
2
bds
|
3
ba
|
1,366
sqft
|
built
2018
2871 Cabrillo Terrace St, Henderson, NV 89044
$-842
Cash flow
-11.7%
Cash-on-Cash Return
3.6%
Cap rate
0.6%
Rent to Value Ratio

Active
$649,999
3
bds
|
3
ba
|
2,048
sqft
|
built
2017
489 Intonation St, Henderson, NV 89011
$-1,926
Cash flow
-15.5%
Cash-on-Cash Return
2.7%
Cap rate
0.4%
Rent to Value Ratio
Active
$4,450,000
3
bds
|
5
ba
|
4,327
sqft
|
built
2020
507 Serenity Point Dr, Henderson, NV 89012
$-19,038
Cash flow
-22.3%
Cash-on-Cash Return
1.1%
Cap rate
0.2%
Rent to Value Ratio

Active
$2,350,000
3
bds
|
4
ba
|
3,024
sqft
|
built
2020
658 Falcon Summit Ct, Henderson, NV 89012
$-10,848
Cash flow
-24.1%
Cash-on-Cash Return
0.7%
Cap rate
0.2%
Rent to Value Ratio

Active
$7,995,000
5
bds
|
7
ba
|
7,690
sqft
|
built
2020
811 Magnum Cliff Ct, Henderson, NV 89012
$-40,689
Cash flow
-26.6%
Cash-on-Cash Return
0.2%
Cap rate
0.1%
Rent to Value Ratio
Active
$684,999
5
bds
|
3
ba
|
2,467
sqft
|
built
2021
2417 Fasano St, Henderson, NV 89044
$-1,295
Cash flow
-9.9%
Cash-on-Cash Return
4.0%
Cap rate
0.6%
Rent to Value Ratio

Active
$444,900
4
bds
|
4
ba
|
2,038
sqft
|
built
2023
538 Ylang Pl, Henderson, NV 89015
$-1,185
Cash flow
-13.9%
Cash-on-Cash Return
3.1%
Cap rate
0.5%
Rent to Value Ratio
Active
$430,000
4
bds
|
3
ba
|
1,936
sqft
|
built
2023
328 Owens Peak Dr, Henderson, NV 89015
$-1,184
Cash flow
-14.4%
Cash-on-Cash Return
3.0%
Cap rate
0.5%
Rent to Value Ratio
Active
$349,900
2
bds
|
1
ba
|
1,071
sqft
|
built
1989
734 Rusty Spur Dr, Henderson, NV 89014
$-703
Cash flow
-10.5%
Cash-on-Cash Return
3.9%
Cap rate
0.5%
Rent to Value Ratio