Henderson, NV Investment Properties for Sale
Browse homes for sale and investment properties in Henderson, NV. Refine your search by price, property type, or more.
Best cash flowing properties in Henderson, NV
Active
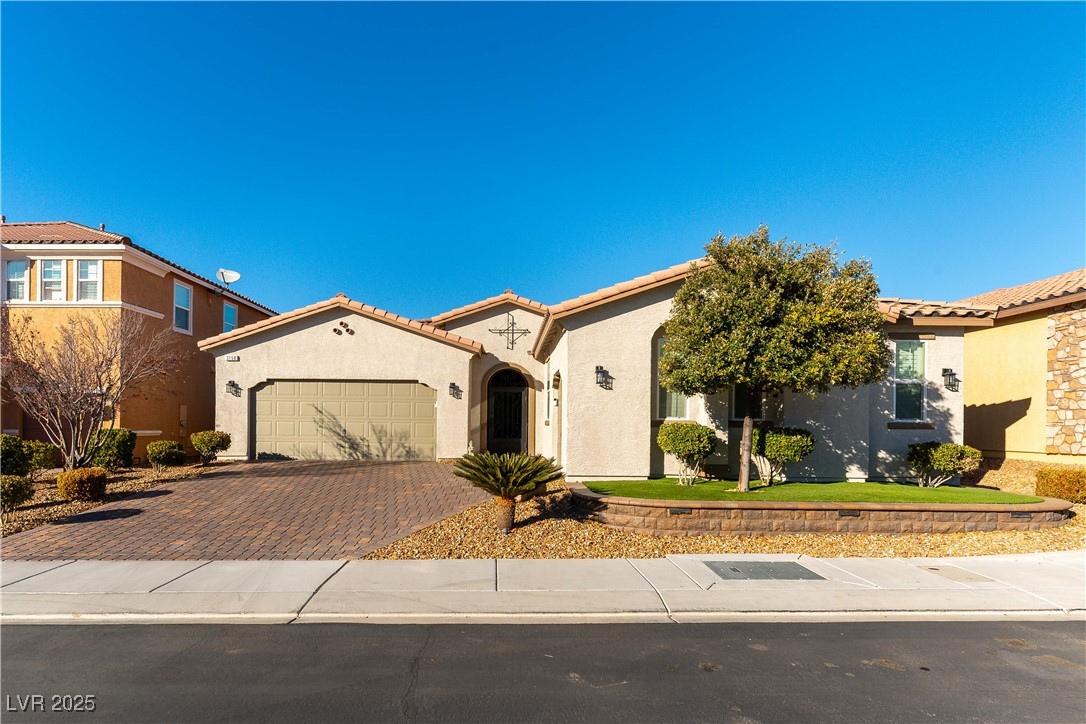
$430,000
3
bds
|
2
ba
|
1,153
sqft
|
built
1996
394 Lombardy Cir, Henderson, NV 89015
$-442
Cash flow
-5.4%
Cash-on-Cash Return
4.4%
Cap rate
0.6%
Rent to Value Ratio
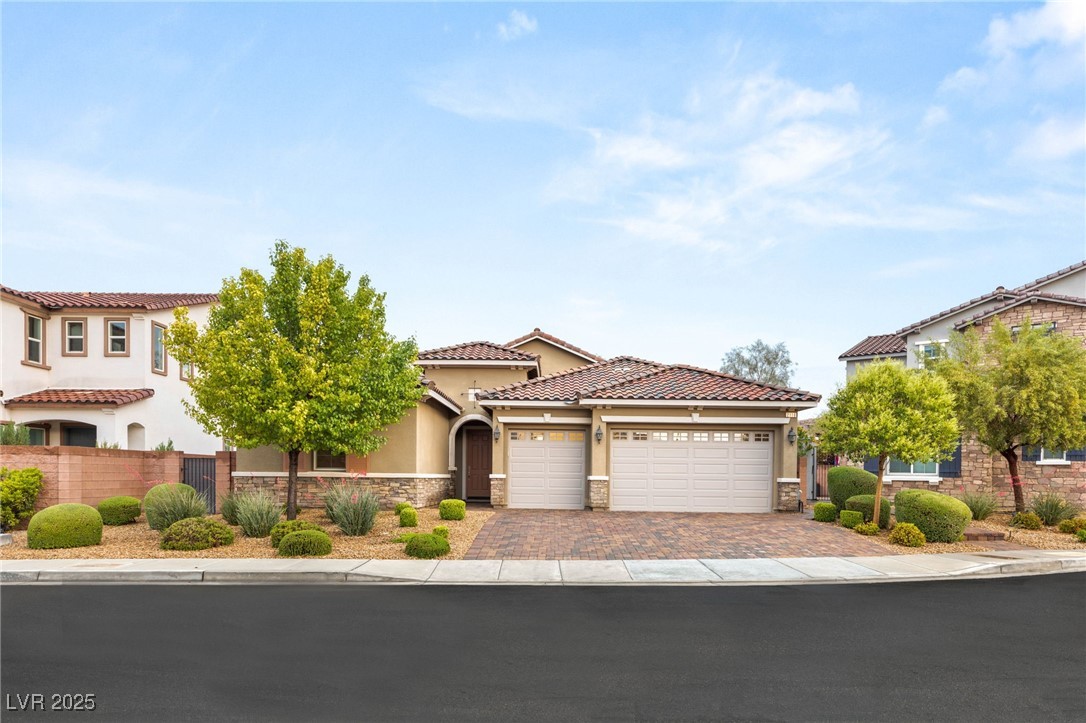
Active
$334,900
3
bds
|
2
ba
|
1,507
sqft
|
built
1996
2925 Wigwam Pkwy, Henderson, NV 89074
$-548
Cash flow
-8.5%
Cash-on-Cash Return
3.7%
Cap rate
0.7%
Rent to Value Ratio
1,305 out of 1,381 properties for sale in Henderson, NV
Limited Results Shown
Create a free account, or log in to reveal all property listings and enjoy the complete experience.
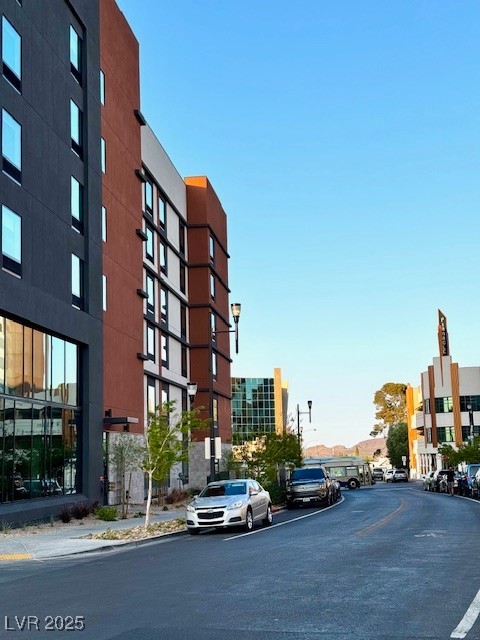
Active
$450,000
3
bds
|
3
ba
|
1,596
sqft
|
built
2006
21 Via Visione, Henderson, NV 89011
$-947
Cash flow
-11.0%
Cash-on-Cash Return
3.2%
Cap rate
0.6%
Rent to Value Ratio
Active
$650,000
4
bds
|
3
ba
|
3,079
sqft
|
built
1986
1021 Calico Ridge Dr, Henderson, NV 89011
$-1,202
Cash flow
-9.6%
Cash-on-Cash Return
3.5%
Cap rate
0.5%
Rent to Value Ratio

Active
$799,999
6
bds
|
5
ba
|
3,597
sqft
|
built
2000
277 Grand Olympia Dr, Henderson, NV 89012
$-1,356
Cash flow
-8.8%
Cash-on-Cash Return
3.6%
Cap rate
0.5%
Rent to Value Ratio
Active
$929,000
4
bds
|
5
ba
|
3,365
sqft
|
built
1993
56 Grossinger Ct, Henderson, NV 89074
$-1,426
Cash flow
-8.0%
Cash-on-Cash Return
3.8%
Cap rate
0.5%
Rent to Value Ratio
Active
$1,375,000
5
bds
|
3
ba
|
3,775
sqft
|
built
1987
3010 La Mesa Dr, Henderson, NV 89014
$-2,569
Cash flow
-9.7%
Cash-on-Cash Return
3.4%
Cap rate
0.5%
Rent to Value Ratio
Active
$479,900
2
bds
|
2
ba
|
1,264
sqft
|
built
1987
372 Rushing Creek Ct, Henderson, NV 89014
$-1,233
Cash flow
-13.4%
Cash-on-Cash Return
2.6%
Cap rate
0.4%
Rent to Value Ratio
Active
$550,000
3
bds
|
3
ba
|
2,252
sqft
|
built
2006
1332 Cedar Berry Ct, Henderson, NV 89012
$-1,234
Cash flow
-11.7%
Cash-on-Cash Return
3.0%
Cap rate
0.5%
Rent to Value Ratio
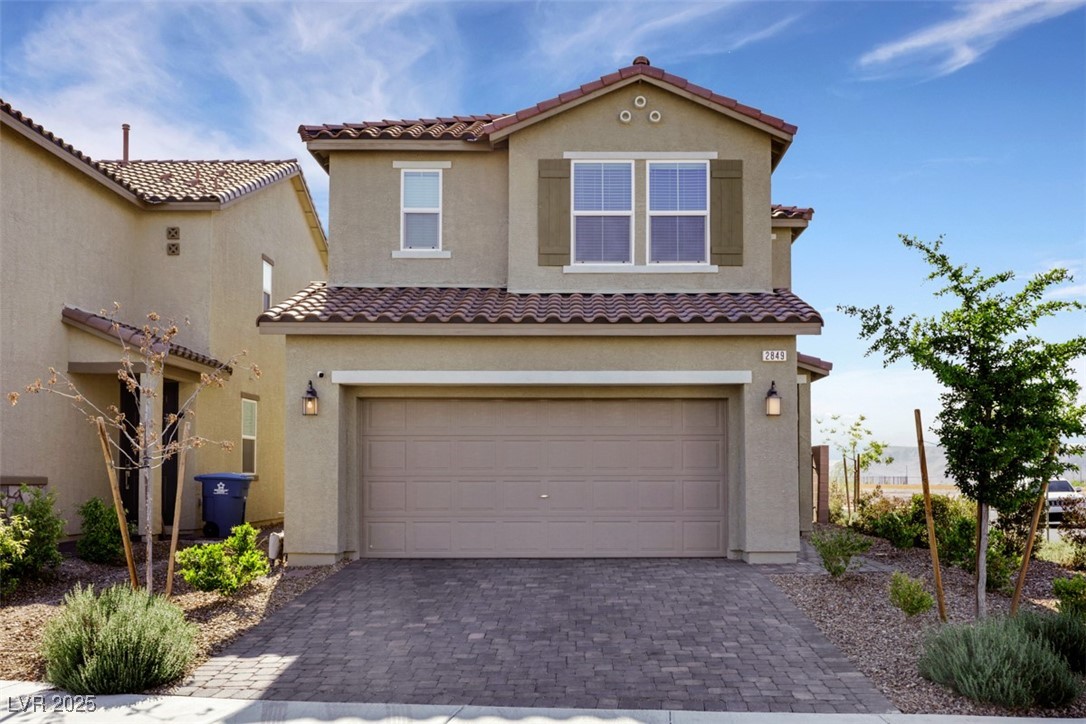
Active
$545,000
4
bds
|
3
ba
|
2,128
sqft
|
built
2021
2849 Mincio St, Henderson, NV 89044
$-1,283
Cash flow
-12.3%
Cash-on-Cash Return
2.9%
Cap rate
0.5%
Rent to Value Ratio
Active
$585,000
3
bds
|
3
ba
|
2,181
sqft
|
built
2007
1 Corte Belleza, Henderson, NV 89011
$-1,739
Cash flow
-15.5%
Cash-on-Cash Return
2.1%
Cap rate
0.4%
Rent to Value Ratio
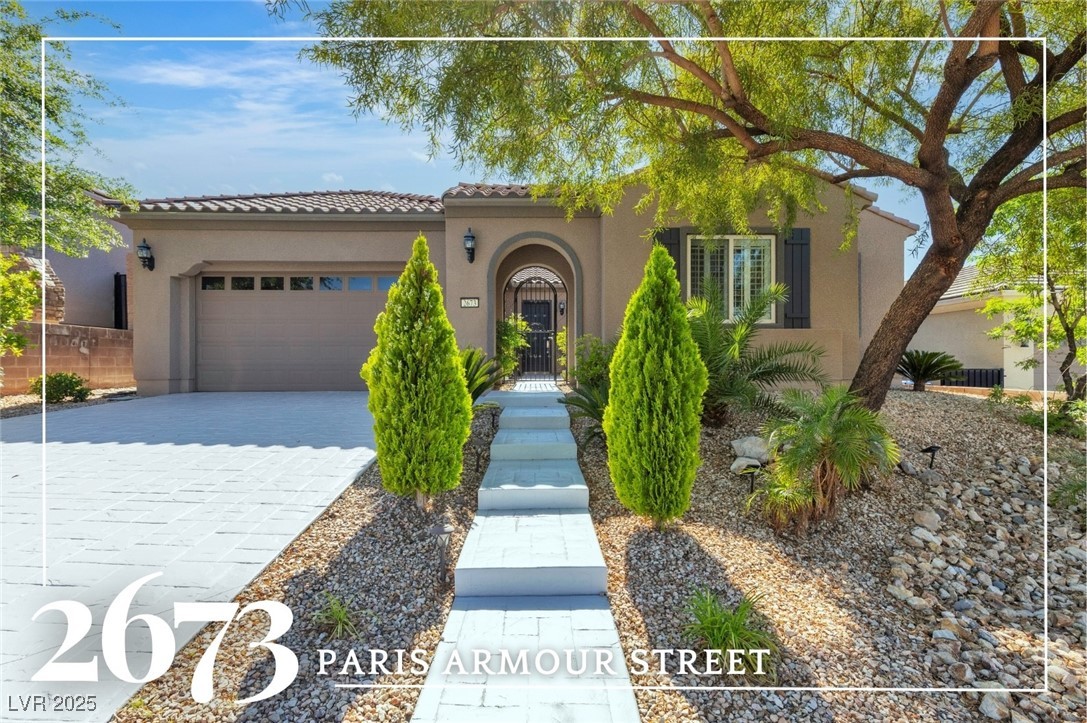
Active
$749,995
4
bds
|
3
ba
|
2,661
sqft
|
built
2008
2673 Paris Amour St, Henderson, NV 89044
$-1,699
Cash flow
-11.8%
Cash-on-Cash Return
3.0%
Cap rate
0.4%
Rent to Value Ratio
Active
$3,750,000
5
bds
|
7
ba
|
7,186
sqft
|
built
2002
15 Rue Du Rivoli Pl, Henderson, NV 89011
$-14,413
Cash flow
-20.1%
Cash-on-Cash Return
1.1%
Cap rate
0.2%
Rent to Value Ratio
Active
$675,000
3
bds
|
2
ba
|
1,968
sqft
|
built
2001
2309 Tedesca Dr, Henderson, NV 89052
$-1,752
Cash flow
-13.5%
Cash-on-Cash Return
2.6%
Cap rate
0.4%
Rent to Value Ratio

Active
$714,900
2
bds
|
2
ba
|
1,720
sqft
|
built
2002
12 Kennesaw Rd, Henderson, NV 89052
$-2,020
Cash flow
-14.7%
Cash-on-Cash Return
2.3%
Cap rate
0.4%
Rent to Value Ratio
Active
$594,990
3
bds
|
2
ba
|
2,170
sqft
|
built
2018
2910 Ventana Ridge Ave, Henderson, NV 89044
$-1,523
Cash flow
-13.4%
Cash-on-Cash Return
2.6%
Cap rate
0.4%
Rent to Value Ratio
Active
$529,000
3
bds
|
3
ba
|
1,814
sqft
|
built
2021
39 Castleton Tower Ct, Henderson, NV 89011
$-1,196
Cash flow
-11.8%
Cash-on-Cash Return
3.0%
Cap rate
0.5%
Rent to Value Ratio
Active
$2,220,000
4
bds
|
5
ba
|
4,474
sqft
|
built
2015
917 Vegas View Dr, Henderson, NV 89052
$-4,698
Cash flow
-11.0%
Cash-on-Cash Return
3.1%
Cap rate
0.5%
Rent to Value Ratio
Active
$775,000
3
bds
|
3
ba
|
2,826
sqft
|
built
2014
3158 Biancavilla Ave, Henderson, NV 89044
$-1,803
Cash flow
-12.1%
Cash-on-Cash Return
2.9%
Cap rate
0.5%
Rent to Value Ratio
Active
$799,900
3
bds
|
3
ba
|
2,523
sqft
|
built
2017
2116 Canvas Edge Dr, Henderson, NV 89044
$-1,600
Cash flow
-10.4%
Cash-on-Cash Return
3.3%
Cap rate
0.5%
Rent to Value Ratio

Active
$764,900
4
bds
|
3
ba
|
3,568
sqft
|
built
1999
1017 Fairbury St, Henderson, NV 89052
$-1,486
Cash flow
-10.1%
Cash-on-Cash Return
3.3%
Cap rate
0.5%
Rent to Value Ratio
Active
$550,000
3
bds
|
1
ba
|
1,023
sqft
|
built
1942
203 W Pacific Ave, Henderson, NV 89015
$-1,262
Cash flow
-12.0%
Cash-on-Cash Return
2.9%
Cap rate
0.4%
Rent to Value Ratio
Active
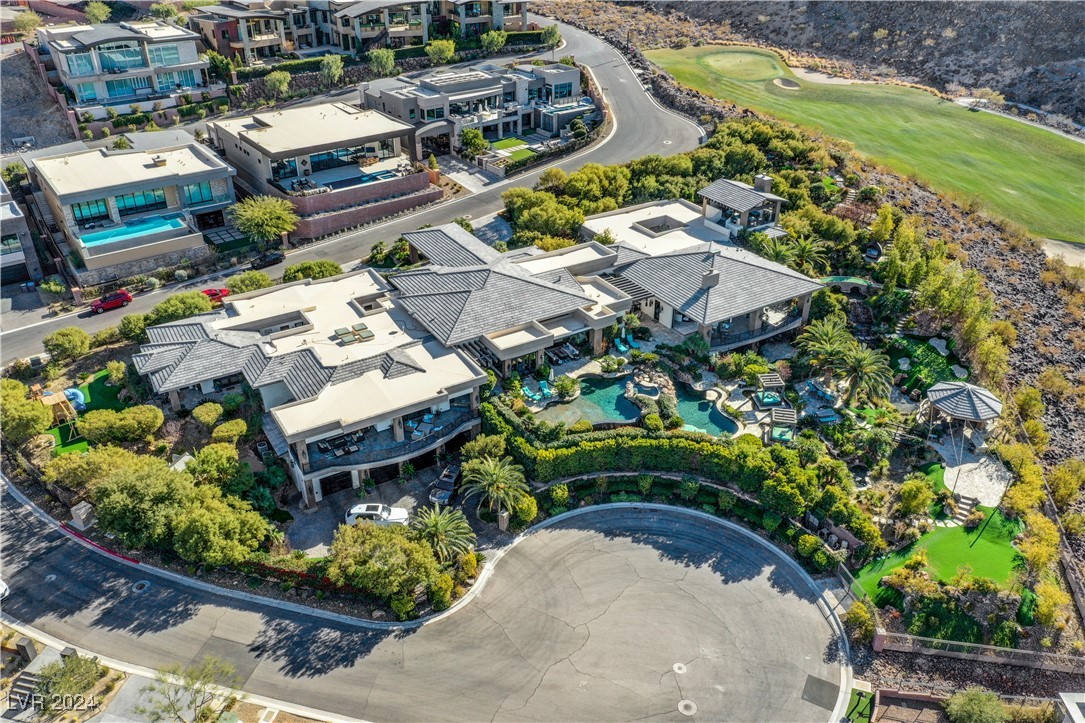
$20,500,000
6
bds
|
10
ba
|
14,005
sqft
|
built
2014
677 Boulder Summit Dr, Henderson, NV 89012
$-96,691
Cash flow
-24.6%
Cash-on-Cash Return
0.0%
Cap rate
0.0%
Rent to Value Ratio
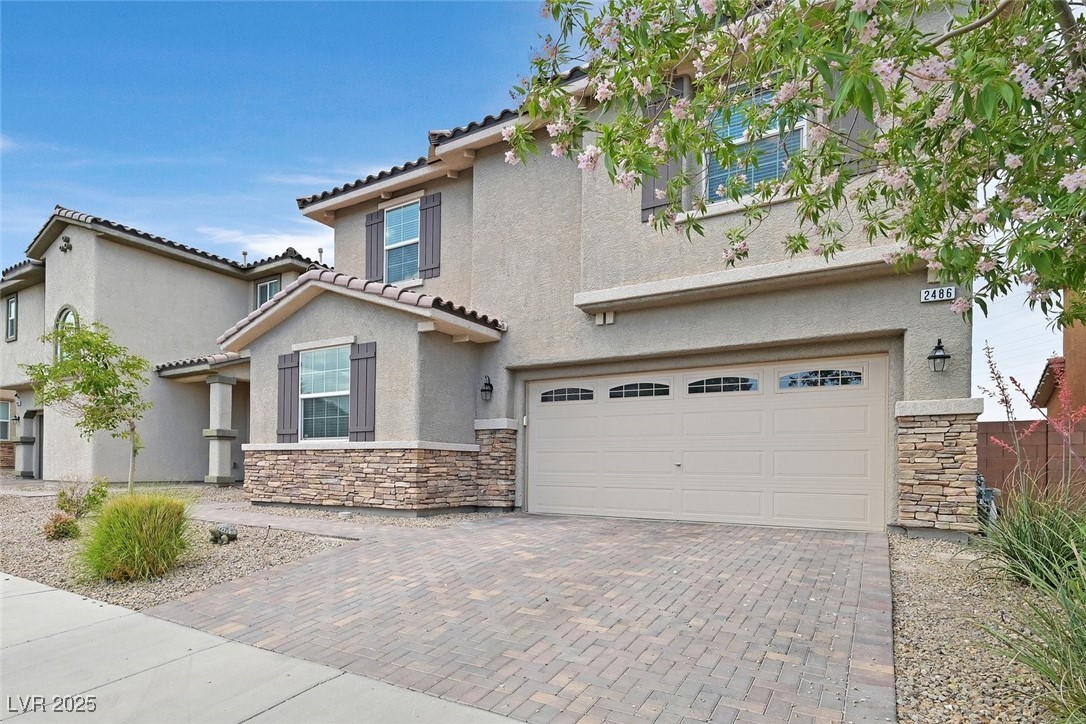
Active
$699,900
4
bds
|
3
ba
|
2,518
sqft
|
built
2017
2486 Dragon Fire Ln, Henderson, NV 89052
$-1,651
Cash flow
-12.3%
Cash-on-Cash Return
2.8%
Cap rate
0.4%
Rent to Value Ratio
Active
$700,000
3
bds
|
3
ba
|
2,661
sqft
|
built
2006
2345 Gondi Castle Ave, Henderson, NV 89044
$-1,778
Cash flow
-13.3%
Cash-on-Cash Return
2.6%
Cap rate
0.4%
Rent to Value Ratio
Active
$699,000
4
bds
|
3
ba
|
2,526
sqft
|
built
2022
701 Monroe Hill Pl, Henderson, NV 89011
$-1,757
Cash flow
-13.1%
Cash-on-Cash Return
2.7%
Cap rate
0.5%
Rent to Value Ratio
Active
$1,800,000
4
bds
|
4
ba
|
3,330
sqft
|
built
1990
2268 Buckingham Ct, Henderson, NV 89074
$-6,570
Cash flow
-19.0%
Cash-on-Cash Return
1.3%
Cap rate
0.2%
Rent to Value Ratio

Active
$1,789,000
3
bds
|
4
ba
|
3,229
sqft
|
built
2022
394 Solitude Peak Ln, Henderson, NV 89012
$-3,697
Cash flow
-10.8%
Cash-on-Cash Return
3.2%
Cap rate
0.5%
Rent to Value Ratio
Active
$810,000
4
bds
|
3
ba
|
3,245
sqft
|
built
2015
1113 Via Della Costrella, Henderson, NV 89011
$-2,439
Cash flow
-15.7%
Cash-on-Cash Return
2.1%
Cap rate
0.4%
Rent to Value Ratio
Active
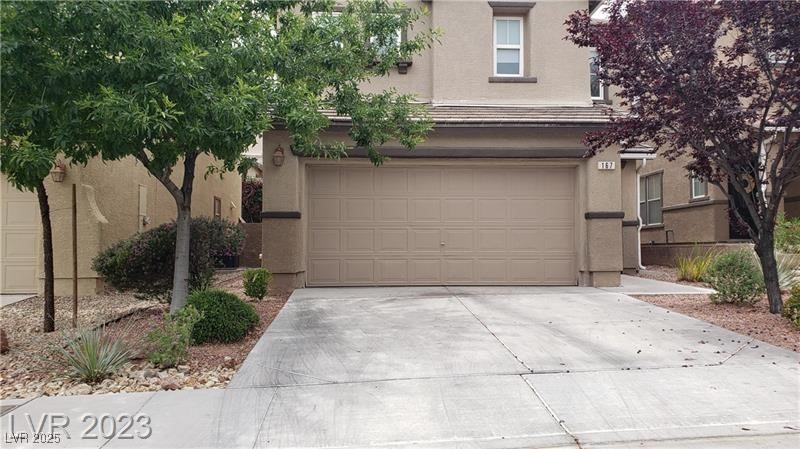
$529,900
3
bds
|
3
ba
|
1,577
sqft
|
built
2005
167 Desert Pond Ave, Henderson, NV 89002
$-1,599
Cash flow
-15.7%
Cash-on-Cash Return
2.1%
Cap rate
0.3%
Rent to Value Ratio
Active
$430,000
3
bds
|
2
ba
|
1,153
sqft
|
built
1996
394 Lombardy Cir, Henderson, NV 89015
$-442
Cash flow
-5.4%
Cash-on-Cash Return
4.4%
Cap rate
0.6%
Rent to Value Ratio
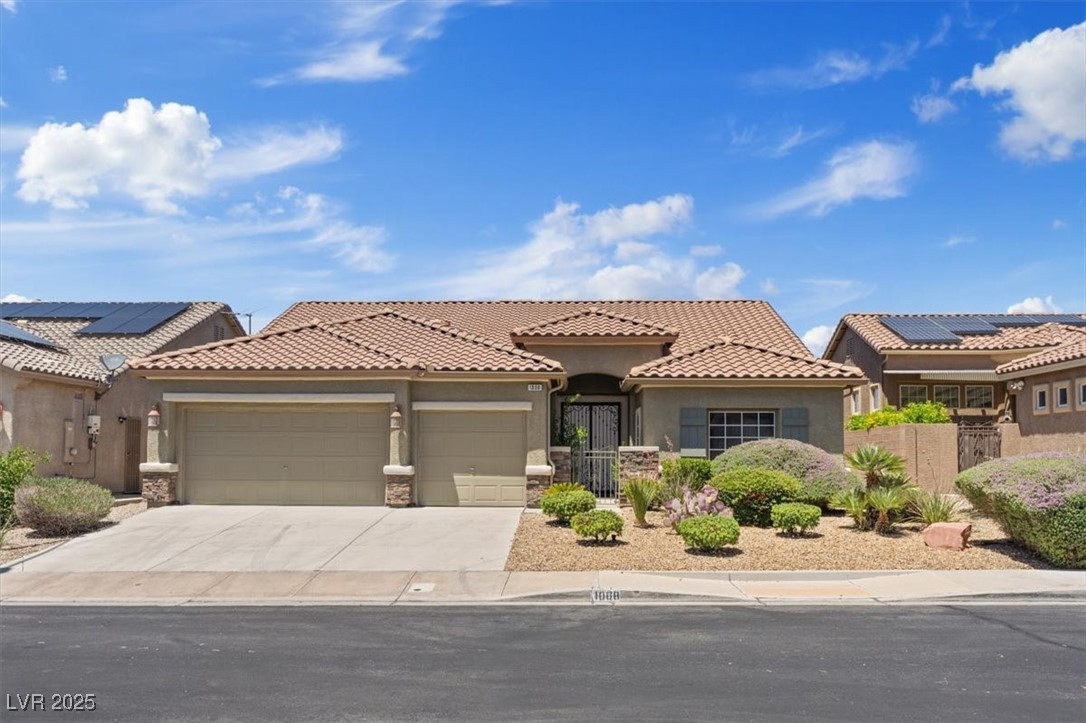
Active
$600,000
3
bds
|
2
ba
|
2,161
sqft
|
built
2004
1008 New Creek Ave, Henderson, NV 89015
$-1,153
Cash flow
-10.0%
Cash-on-Cash Return
3.4%
Cap rate
0.5%
Rent to Value Ratio
Active
$430,000
3
bds
|
3
ba
|
1,842
sqft
|
built
2018
2887 Starling Summit St, Henderson, NV 89044
$-955
Cash flow
-11.6%
Cash-on-Cash Return
3.0%
Cap rate
0.5%
Rent to Value Ratio
Pending
$399,000
3
bds
|
3
ba
|
1,774
sqft
|
built
1999
502 Cosmic Star Pl, Henderson, NV 89052
$-827
Cash flow
-10.8%
Cash-on-Cash Return
3.2%
Cap rate
0.5%
Rent to Value Ratio
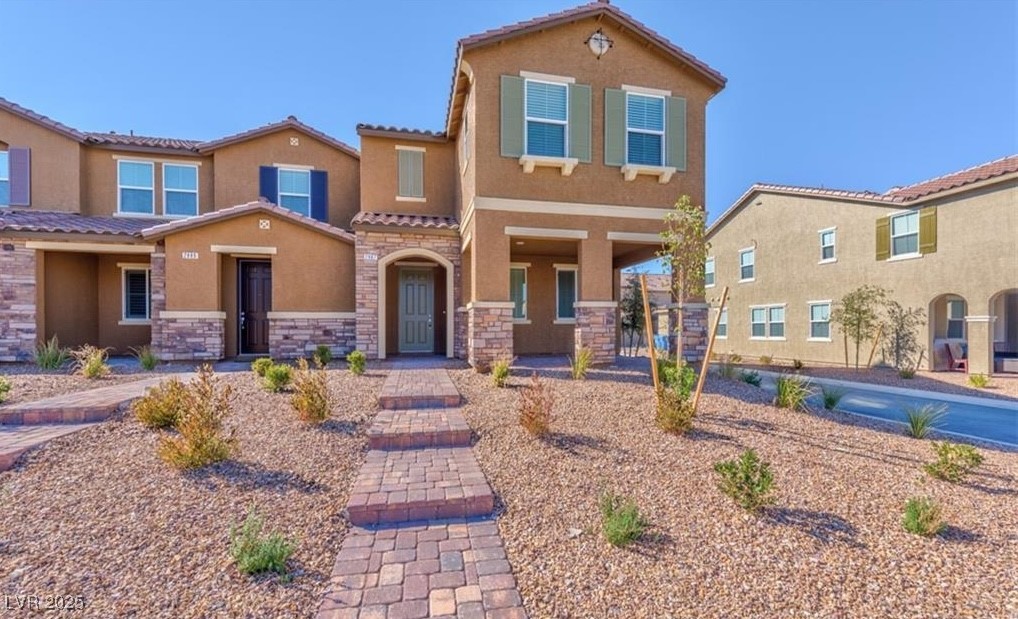
Active
$469,900
3
bds
|
3
ba
|
1,785
sqft
|
built
2019
169 Volti Subito Way, Henderson, NV 89011
$-769
Cash flow
-8.5%
Cash-on-Cash Return
3.7%
Cap rate
0.6%
Rent to Value Ratio
Pending
$435,000
3
bds
|
3
ba
|
1,596
sqft
|
built
2019
361 Andy Wheeler Dr, Henderson, NV 89011
$-662
Cash flow
-7.9%
Cash-on-Cash Return
3.9%
Cap rate
0.6%
Rent to Value Ratio

Active
$535,000
3
bds
|
3
ba
|
2,294
sqft
|
built
2012
3232 Romanesque Art Ave, Henderson, NV 89044
$-896
Cash flow
-8.7%
Cash-on-Cash Return
3.7%
Cap rate
0.5%
Rent to Value Ratio
Active
$334,900
3
bds
|
2
ba
|
1,507
sqft
|
built
1996
2925 Wigwam Pkwy, Henderson, NV 89074
$-548
Cash flow
-8.5%
Cash-on-Cash Return
3.7%
Cap rate
0.7%
Rent to Value Ratio

Active under contract
$269,999
2
bds
|
2
ba
|
1,249
sqft
|
built
2006
833 Aspen Peak Loop, Henderson, NV 89011
$-571
Cash flow
-11.0%
Cash-on-Cash Return
3.1%
Cap rate
0.6%
Rent to Value Ratio

Active
$320,000
3
bds
|
2
ba
|
1,330
sqft
|
built
2004
2291 W Horizon Ridge Pkwy, Henderson, NV 89052
$-635
Cash flow
-10.4%
Cash-on-Cash Return
3.3%
Cap rate
0.6%
Rent to Value Ratio
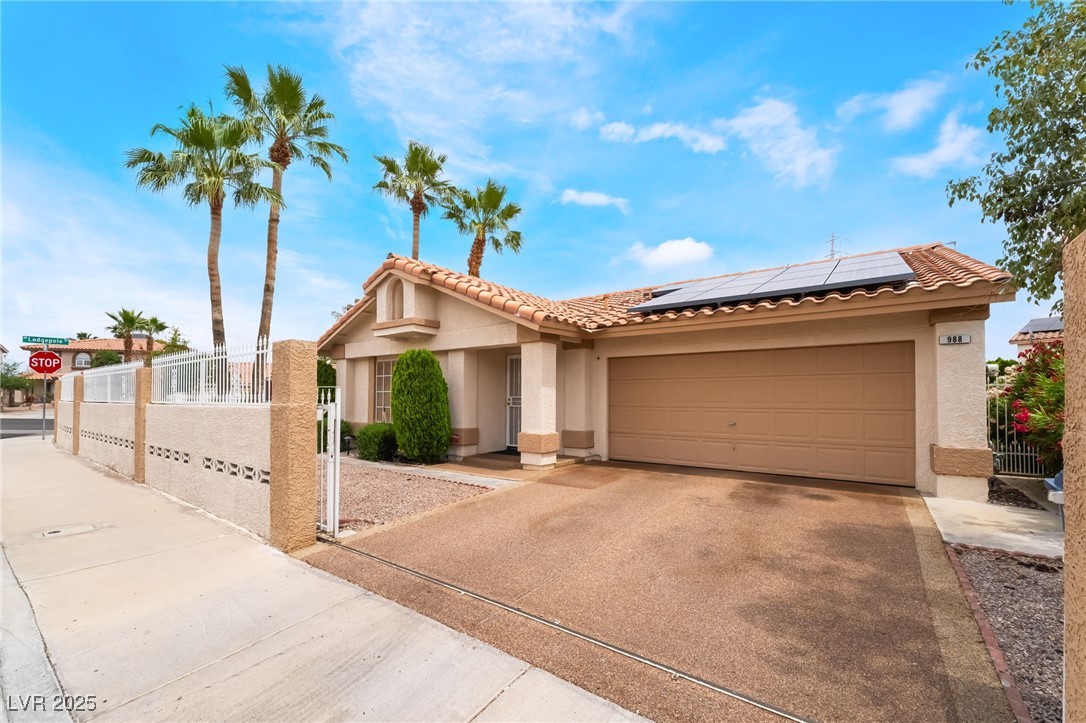
Active
$370,000
2
bds
|
2
ba
|
1,175
sqft
|
built
1990
988 Flapjack Dr, Henderson, NV 89014
$-667
Cash flow
-9.4%
Cash-on-Cash Return
3.5%
Cap rate
0.5%
Rent to Value Ratio
Active
$505,000
3
bds
|
3
ba
|
1,805
sqft
|
built
2018
343 Cadence Vista Dr, Henderson, NV 89011
$-989
Cash flow
-10.2%
Cash-on-Cash Return
3.3%
Cap rate
0.5%
Rent to Value Ratio