Henderson, NV Investment Properties for Sale
Browse homes for sale and investment properties in Henderson, NV. Refine your search by price, property type, or more.
Best cash flowing properties in Henderson, NV
Active
$180,000
1
bds
|
1
ba
|
410
sqft
|
built
2004
30 Strada Di Villaggio, Henderson, NV 89011
$-140
Cash flow
-4.1%
Cash-on-Cash Return
4.7%
Cap rate
0.8%
Rent to Value Ratio
Active
$240,000
1
bds
|
1
ba
|
777
sqft
|
built
1995
2201 Ramsgate Dr, Henderson, NV 89074
$-323
Cash flow
-7.0%
Cash-on-Cash Return
4.1%
Cap rate
0.7%
Rent to Value Ratio
1,305 out of 1,380 properties for sale in Henderson, NV
Limited Results Shown
Create a free account, or log in to reveal all property listings and enjoy the complete experience.
Active
$409,900
3
bds
|
2
ba
|
1,046
sqft
|
built
1942
2 Utah Way, Henderson, NV 89015
$-752
Cash flow
-9.6%
Cash-on-Cash Return
3.5%
Cap rate
0.4%
Rent to Value Ratio
Pending
$330,000
3
bds
|
1
ba
|
1,546
sqft
|
built
1954
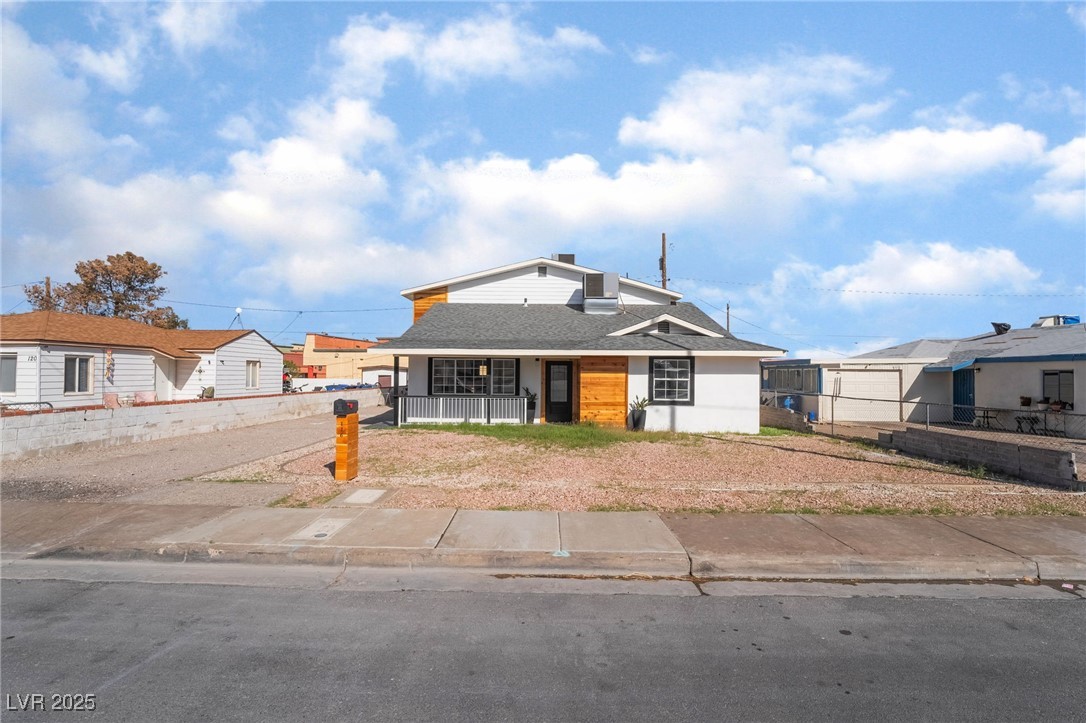
120 Dogwood St, Henderson, NV 89015
$-502
Cash flow
-7.9%
Cash-on-Cash Return
3.9%
Cap rate
0.5%
Rent to Value Ratio
Active
$460,000
4
bds
|
3
ba
|
1,803
sqft
|
built
1993
2874 Avanti Ln, Henderson, NV 89074
$-774
Cash flow
-8.8%
Cash-on-Cash Return
3.7%
Cap rate
0.5%
Rent to Value Ratio
Active
$319,888
2
bds
|
2
ba
|
1,200
sqft
|
built
2004
2305 W Horizon Ridge Pkwy, Henderson, NV 89052
$-632
Cash flow
-10.3%
Cash-on-Cash Return
3.3%
Cap rate
0.6%
Rent to Value Ratio
Active
$1,350,000
5
bds
|
5
ba
|
3,422
sqft
|
built
2022
2004 Peaceful Mesa Ct, Henderson, NV 89052
$-4,608
Cash flow
-17.8%
Cash-on-Cash Return
1.6%
Cap rate
0.3%
Rent to Value Ratio
Active
$357,000
2
bds
|
3
ba
|
1,200
sqft
|
built
1992
1663 Cloister Ave, Henderson, NV 89014
$-739
Cash flow
-10.8%
Cash-on-Cash Return
3.2%
Cap rate
0.5%
Rent to Value Ratio
Active
$180,000
1
bds
|
1
ba
|
410
sqft
|
built
2004
30 Strada Di Villaggio, Henderson, NV 89011
$-140
Cash flow
-4.1%
Cash-on-Cash Return
4.7%
Cap rate
0.8%
Rent to Value Ratio
Active
$459,999
5
bds
|
3
ba
|
3,528
sqft
|
built
1952
116 W Victory Rd, Henderson, NV 89015
$-409
Cash flow
-4.6%
Cash-on-Cash Return
4.6%
Cap rate
0.6%
Rent to Value Ratio
Active
$260,000
1
bds
|
1
ba
|
820
sqft
|
built
1992
2251 Wigwam Pkwy, Henderson, NV 89074
$-421
Cash flow
-8.4%
Cash-on-Cash Return
3.7%
Cap rate
0.6%
Rent to Value Ratio
Active
$199,000
1
bds
|
1
ba
|
701
sqft
|
built
1998
231 W Horizon Ridge Pkwy, Henderson, NV 89012
$-369
Cash flow
-9.7%
Cash-on-Cash Return
3.5%
Cap rate
0.7%
Rent to Value Ratio
Active
$379,000
3
bds
|
3
ba
|
1,782
sqft
|
built
2016
1055 Admiral Emblem St, Henderson, NV 89015
$-711
Cash flow
-9.8%
Cash-on-Cash Return
3.4%
Cap rate
0.5%
Rent to Value Ratio
Active
$519,000
4
bds
|
3
ba
|
2,088
sqft
|
built
1988
1834 Escondido Ter, Henderson, NV 89074
$-890
Cash flow
-8.9%
Cash-on-Cash Return
3.6%
Cap rate
0.5%
Rent to Value Ratio

Active
$349,000
3
bds
|
3
ba
|
1,447
sqft
|
built
2021
1201 Seaboard Ct, Henderson, NV 89002
$-871
Cash flow
-13.0%
Cash-on-Cash Return
2.7%
Cap rate
0.5%
Rent to Value Ratio
Active
$485,000
3
bds
|
4
ba
|
2,344
sqft
|
built
2019
148 Campbelltown Ave, Henderson, NV 89015
$-956
Cash flow
-10.3%
Cash-on-Cash Return
3.3%
Cap rate
0.5%
Rent to Value Ratio
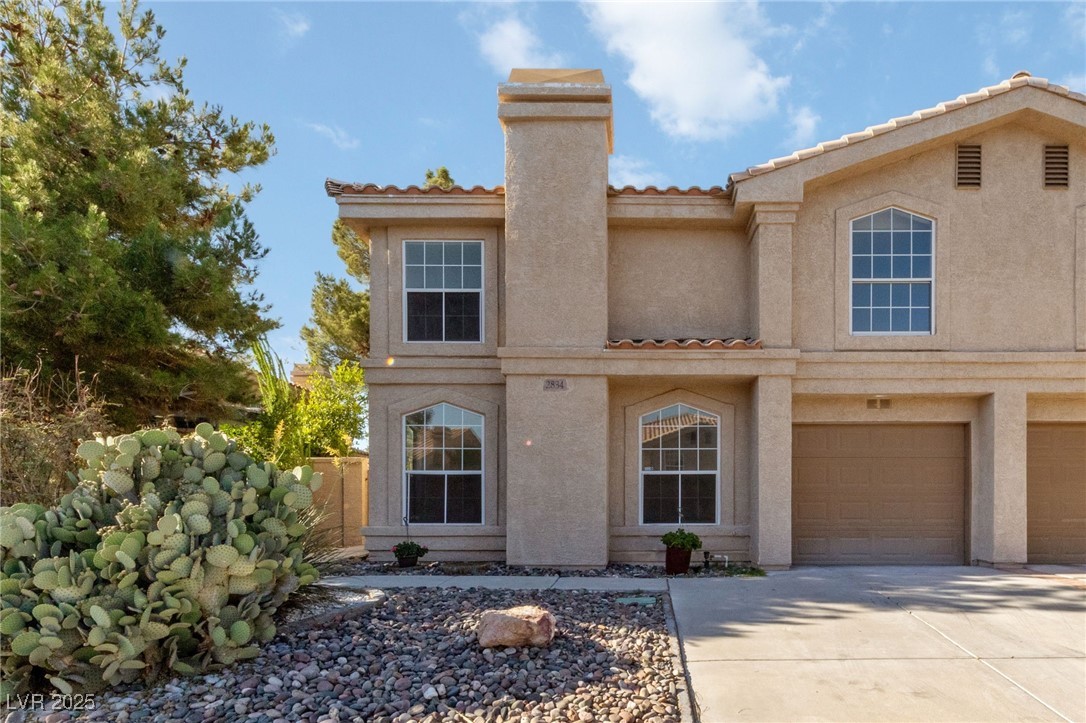
Active
$384,900
3
bds
|
3
ba
|
1,541
sqft
|
built
1992
2834 Crystal Lantern Dr, Henderson, NV 89074
$-682
Cash flow
-9.2%
Cash-on-Cash Return
3.6%
Cap rate
0.5%
Rent to Value Ratio
Active
$345,000
2
bds
|
2
ba
|
1,042
sqft
|
built
2002
700 Carnegie St, Henderson, NV 89052
$-848
Cash flow
-12.8%
Cash-on-Cash Return
2.7%
Cap rate
0.5%
Rent to Value Ratio
Active
$1,125,000
3
bds
|
4
ba
|
3,231
sqft
|
built
2006
2 Cerchio Centrale, Henderson, NV 89011
$-455
Cash flow
-2.1%
Cash-on-Cash Return
5.2%
Cap rate
0.7%
Rent to Value Ratio
Active
$430,000
3
bds
|
2
ba
|
1,334
sqft
|
built
1995
146 Skytop Dr, Henderson, NV 89015
$-767
Cash flow
-9.3%
Cash-on-Cash Return
3.5%
Cap rate
0.5%
Rent to Value Ratio
Active
$450,000
3
bds
|
3
ba
|
1,614
sqft
|
built
1997
2180 Polynesia Cir, Henderson, NV 89074
$-988
Cash flow
-11.5%
Cash-on-Cash Return
3.0%
Cap rate
0.4%
Rent to Value Ratio
Active under contract
$590,000
3
bds
|
2
ba
|
1,940
sqft
|
built
1999
822 Fairview Dr, Henderson, NV 89015
$-1,115
Cash flow
-9.9%
Cash-on-Cash Return
3.4%
Cap rate
0.5%
Rent to Value Ratio
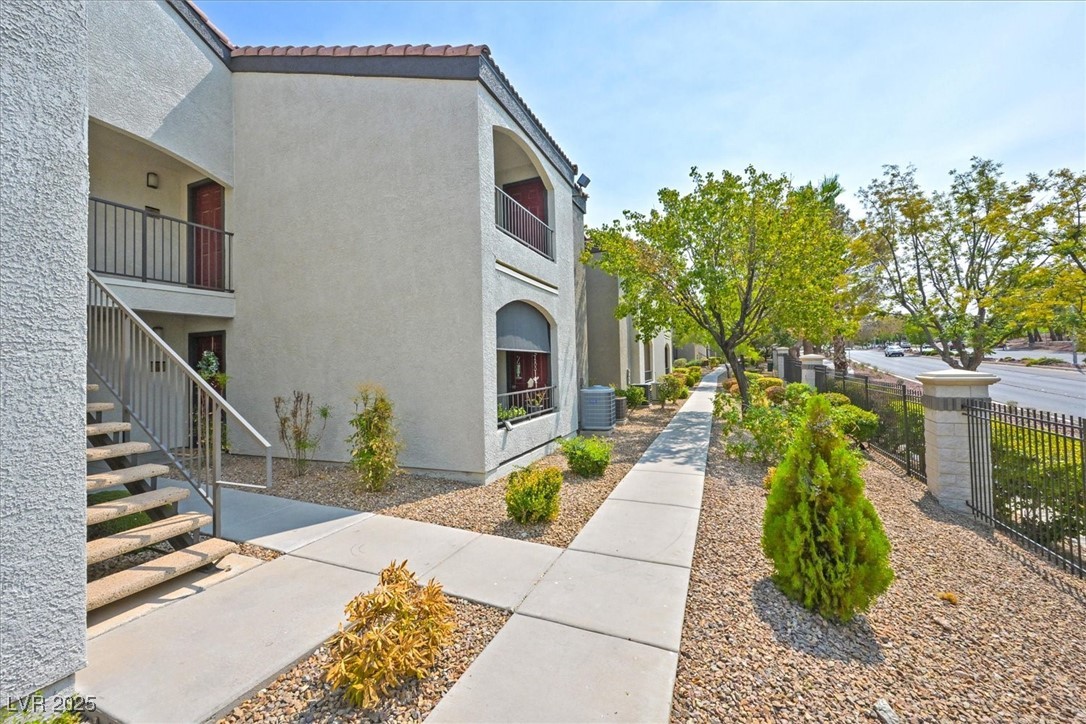
Active
$259,999
1
bds
|
1
ba
|
660
sqft
|
built
2001
950 Seven Hills Dr, Henderson, NV 89052
$-572
Cash flow
-11.5%
Cash-on-Cash Return
3.0%
Cap rate
0.6%
Rent to Value Ratio
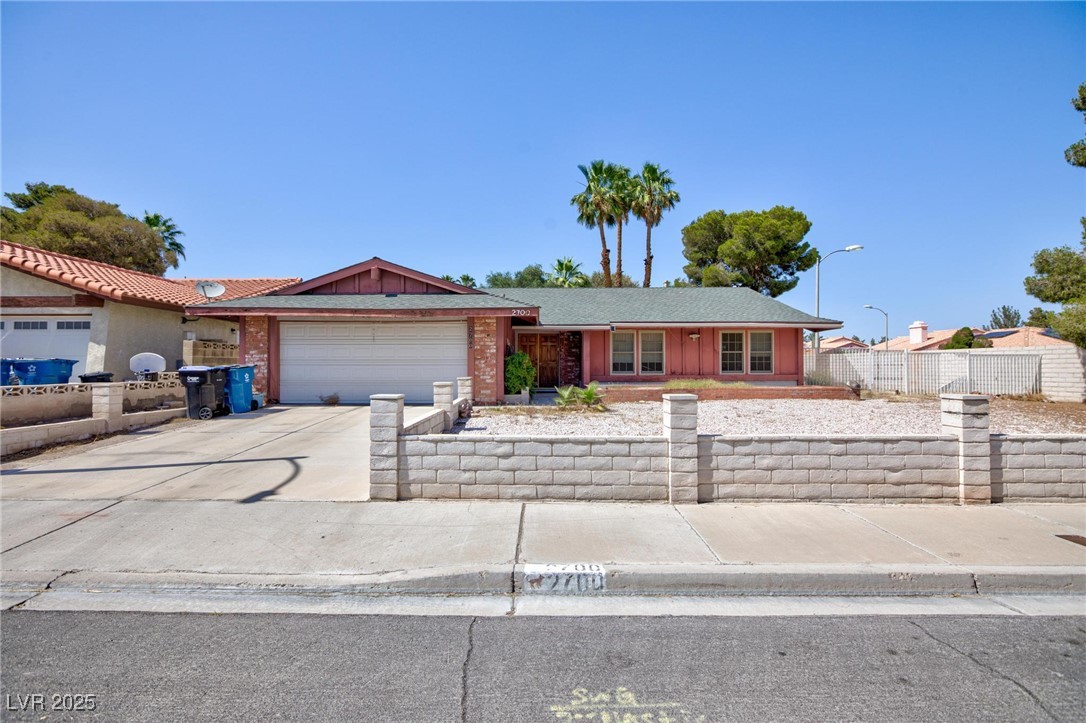
Active
$399,999
2
bds
|
2
ba
|
1,407
sqft
|
built
1979
2700 Osborne Ln, Henderson, NV 89014
$-532
Cash flow
-6.9%
Cash-on-Cash Return
4.1%
Cap rate
0.6%
Rent to Value Ratio
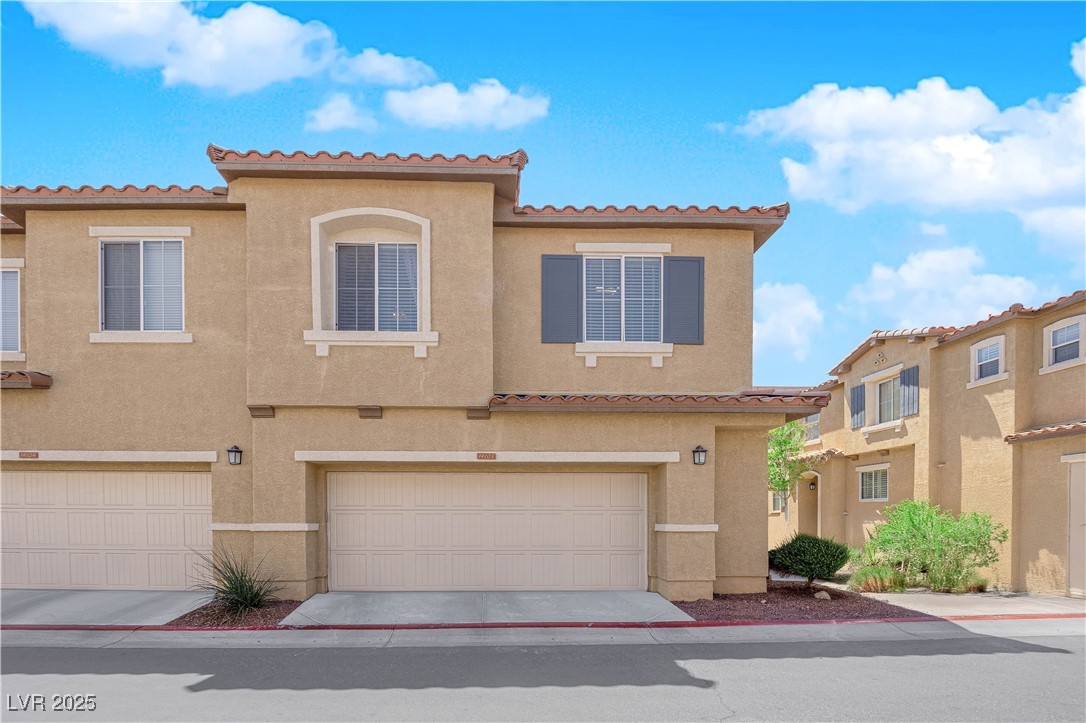
Active
$405,000
3
bds
|
3
ba
|
1,856
sqft
|
built
2008
1525 Spiced Wine Ave, Henderson, NV 89074
$-959
Cash flow
-12.4%
Cash-on-Cash Return
2.8%
Cap rate
0.5%
Rent to Value Ratio
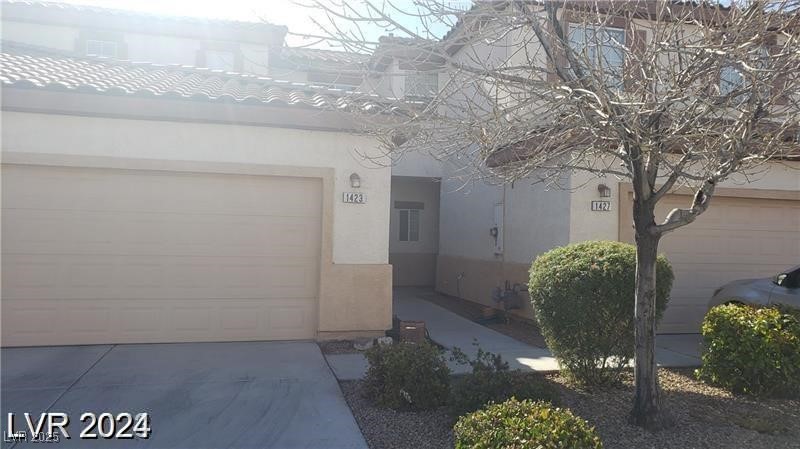
Active
$464,900
3
bds
|
3
ba
|
1,972
sqft
|
built
2006
1423 Orange Jubilee Rd, Henderson, NV 89014
$-1,105
Cash flow
-12.4%
Cash-on-Cash Return
2.8%
Cap rate
0.4%
Rent to Value Ratio
Active
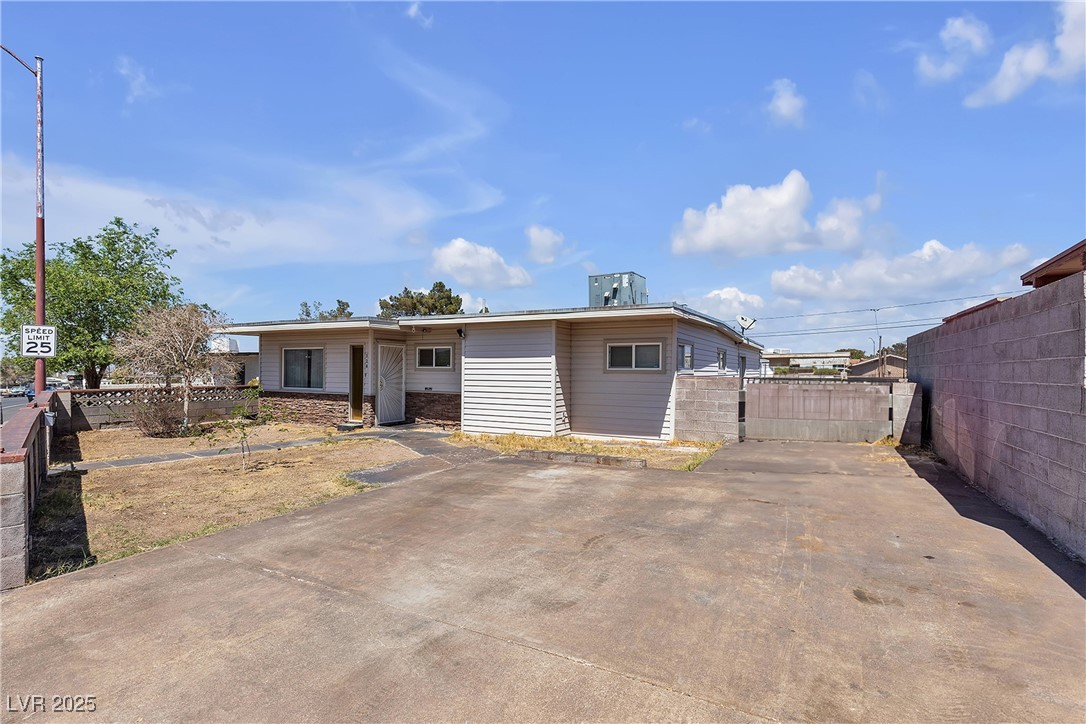
$369,900
3
bds
|
2
ba
|
1,786
sqft
|
built
1942
326 W Basic Rd, Henderson, NV 89015
$-416
Cash flow
-5.9%
Cash-on-Cash Return
4.3%
Cap rate
0.5%
Rent to Value Ratio
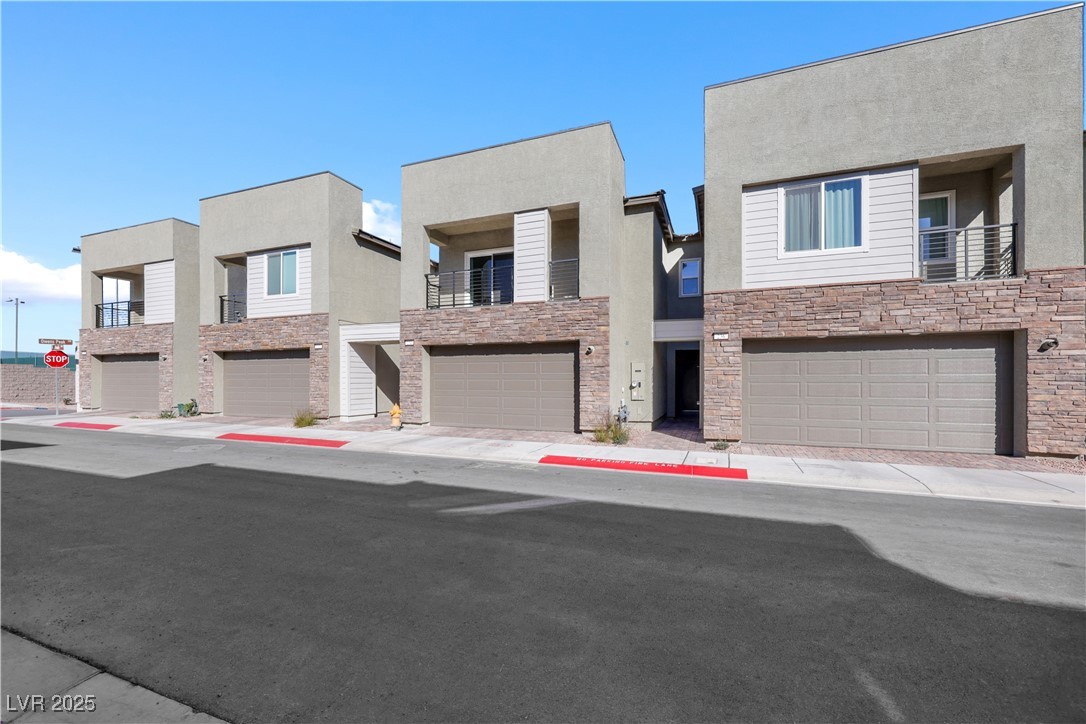
Active
$399,990
2
bds
|
3
ba
|
1,700
sqft
|
built
2024
234 Walsh Peak Ave, Henderson, NV 89015
$-604
Cash flow
-7.9%
Cash-on-Cash Return
3.9%
Cap rate
0.6%
Rent to Value Ratio

Active
$390,000
3
bds
|
3
ba
|
1,761
sqft
|
built
2007
963 Sable Chase Pl, Henderson, NV 89011
$-560
Cash flow
-7.5%
Cash-on-Cash Return
4.0%
Cap rate
0.6%
Rent to Value Ratio
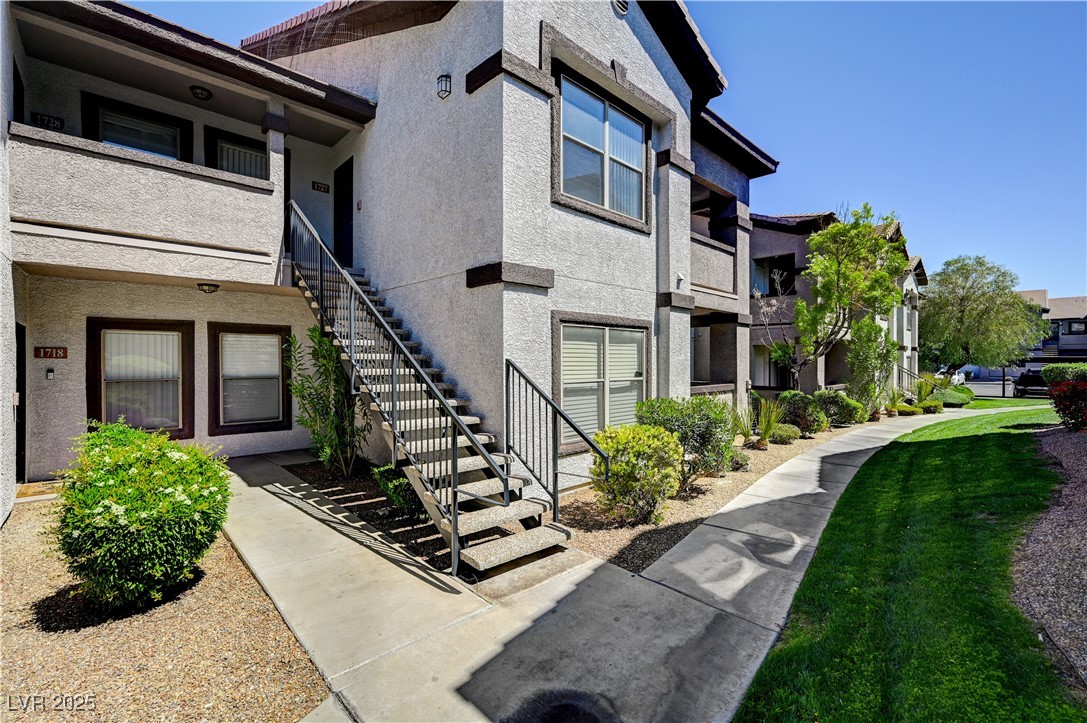
Active
$265,500
2
bds
|
2
ba
|
938
sqft
|
built
2003
45 Maleena Mesa St, Henderson, NV 89074
$-551
Cash flow
-10.8%
Cash-on-Cash Return
3.2%
Cap rate
0.5%
Rent to Value Ratio
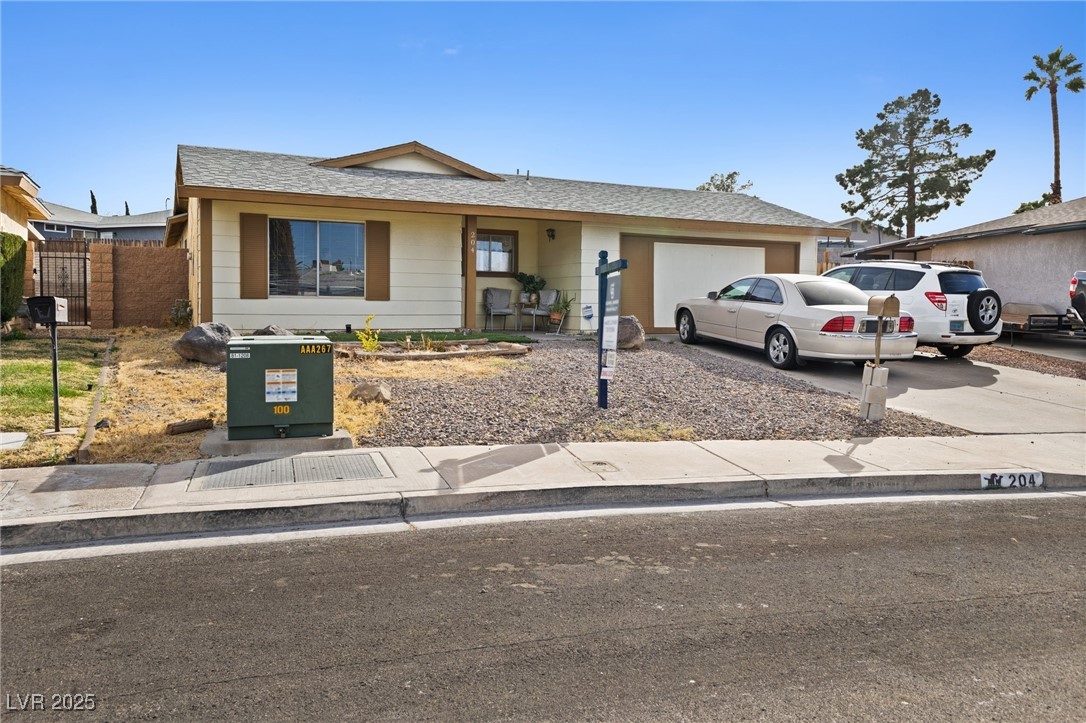
Active
$360,000
4
bds
|
2
ba
|
1,284
sqft
|
built
1977
204 Cimarron Ct, Henderson, NV 89002
$-507
Cash flow
-7.3%
Cash-on-Cash Return
4.0%
Cap rate
0.5%
Rent to Value Ratio
Active
$240,000
1
bds
|
1
ba
|
777
sqft
|
built
1995
2201 Ramsgate Dr, Henderson, NV 89074
$-323
Cash flow
-7.0%
Cash-on-Cash Return
4.1%
Cap rate
0.7%
Rent to Value Ratio
Active
$559,621
4
bds
|
3
ba
|
2,643
sqft
|
built
2005
948 Mill Run Creek Ave, Henderson, NV 89002
$-1,141
Cash flow
-10.6%
Cash-on-Cash Return
3.2%
Cap rate
0.5%
Rent to Value Ratio
Active
$600,000
4
bds
|
3
ba
|
2,328
sqft
|
built
2016
162 Fulgora St, Henderson, NV 89074
$-1,364
Cash flow
-11.9%
Cash-on-Cash Return
2.9%
Cap rate
0.4%
Rent to Value Ratio

Active
$729,900
5
bds
|
3
ba
|
2,855
sqft
|
built
2001
1700 Ravanusa Dr, Henderson, NV 89052
$-2,083
Cash flow
-14.9%
Cash-on-Cash Return
2.3%
Cap rate
0.4%
Rent to Value Ratio
Active
$459,500
3
bds
|
3
ba
|
1,615
sqft
|
built
1989
2108 Running River Rd, Henderson, NV 89074
$-954
Cash flow
-10.8%
Cash-on-Cash Return
3.2%
Cap rate
0.4%
Rent to Value Ratio

Active
$674,999
5
bds
|
3
ba
|
2,733
sqft
|
built
2013
235 Desert Arroyo Ct, Henderson, NV 89012
$-1,654
Cash flow
-12.8%
Cash-on-Cash Return
2.7%
Cap rate
0.4%
Rent to Value Ratio
Active
$683,000
3
bds
|
3
ba
|
2,206
sqft
|
built
2023
80 Brixton Ave, Henderson, NV 89011
$-1,622
Cash flow
-12.4%
Cash-on-Cash Return
2.8%
Cap rate
0.5%
Rent to Value Ratio
Active
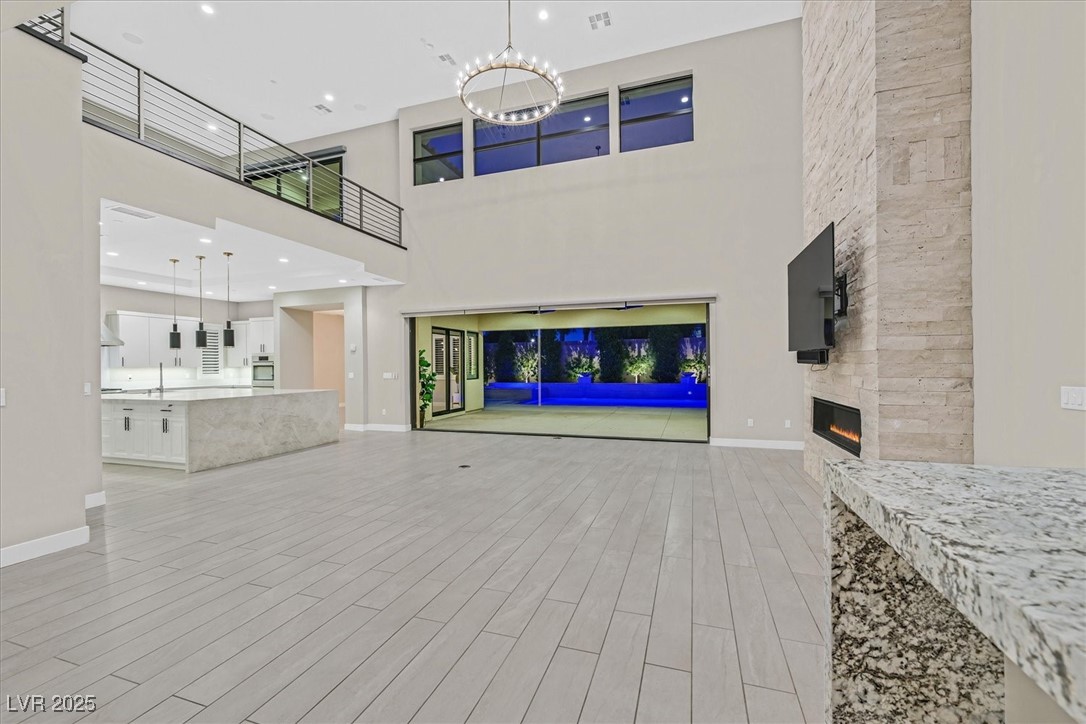
$2,699,900
3
bds
|
5
ba
|
5,033
sqft
|
built
2017
65 Garibaldi Way, Henderson, NV 89011
$-7,460
Cash flow
-14.4%
Cash-on-Cash Return
2.4%
Cap rate
0.4%
Rent to Value Ratio
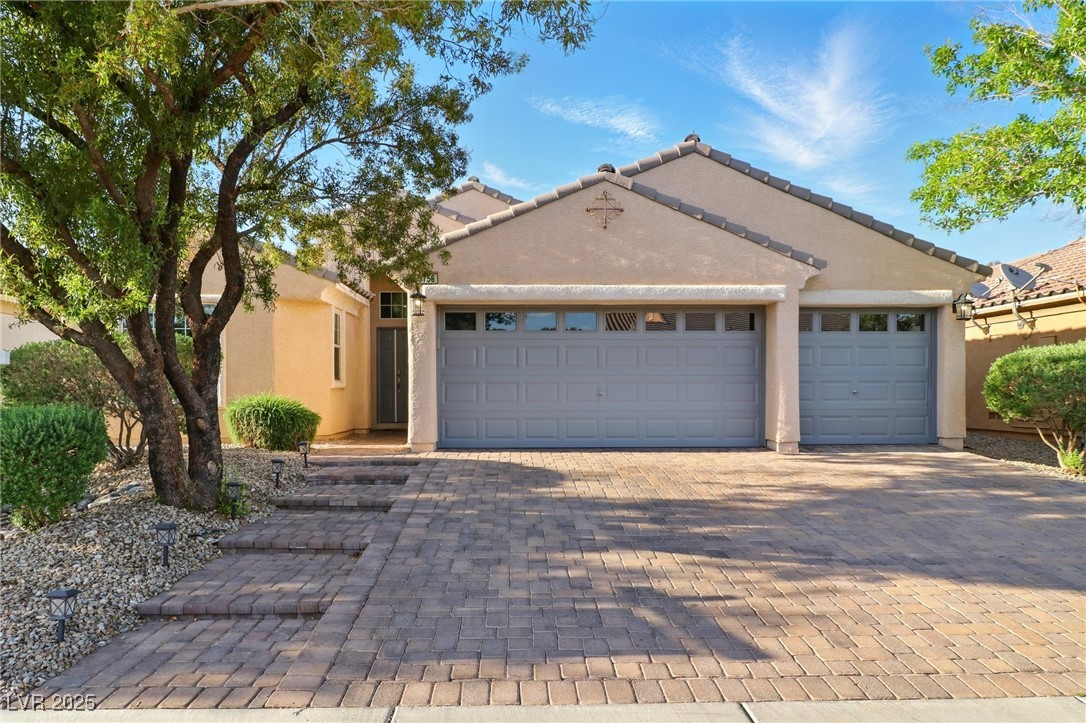
Active
$540,000
3
bds
|
2
ba
|
1,826
sqft
|
built
2009
3756 Toscanella Ave, Henderson, NV 89052
$-1,334
Cash flow
-12.9%
Cash-on-Cash Return
2.7%
Cap rate
0.4%
Rent to Value Ratio
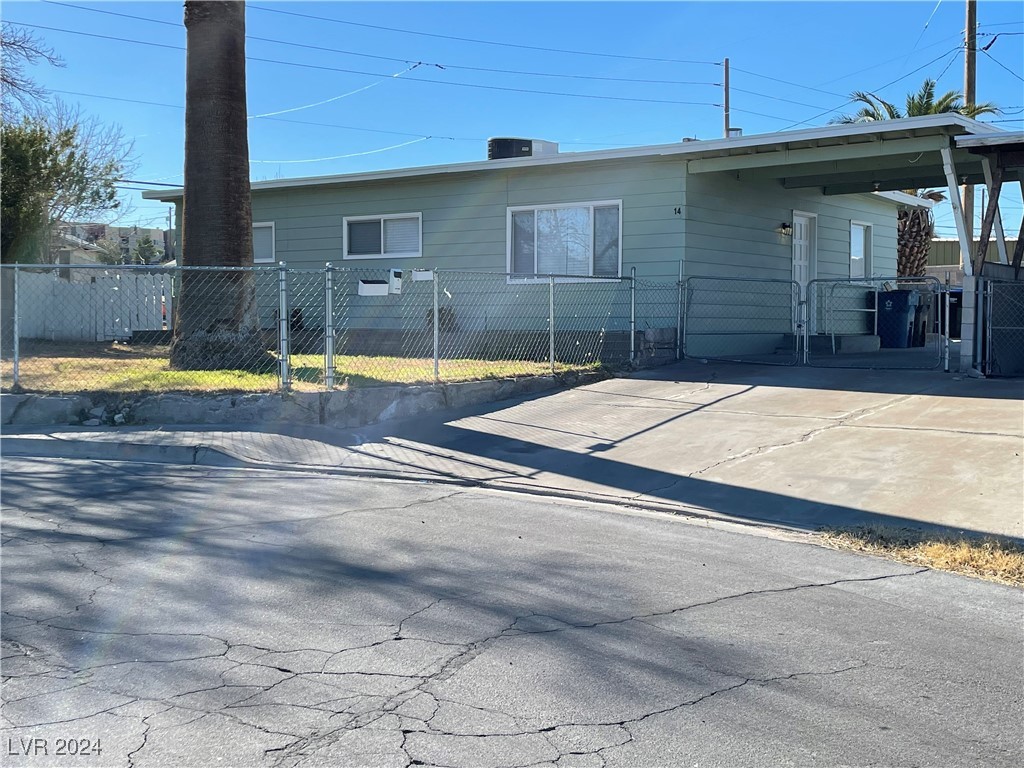
Active
$575,000
bds
|
0
ba
|
1,205
sqft
|
built
1942
14 California Way, Henderson, NV 89015
$-1,248
Cash flow
-11.3%
Cash-on-Cash Return
3.1%
Cap rate
0.4%
Rent to Value Ratio
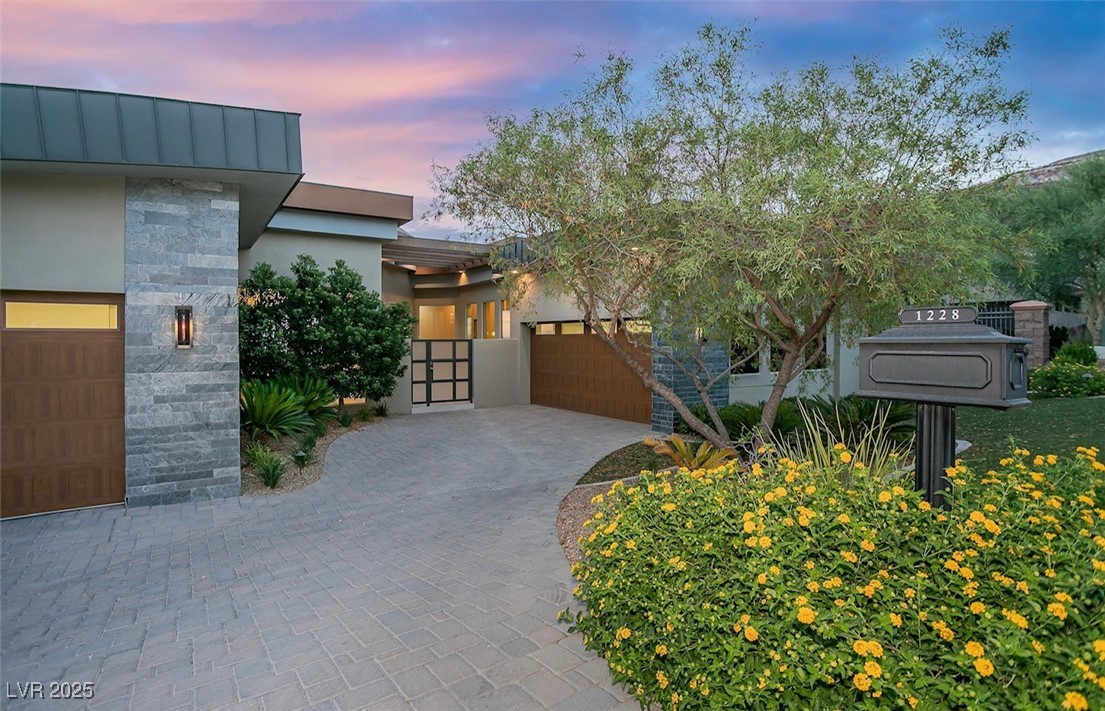
Active
$3,900,000
4
bds
|
4
ba
|
4,304
sqft
|
built
2014
1228 Stellar Rim Ct, Henderson, NV 89012
$-13,734
Cash flow
-18.4%
Cash-on-Cash Return
1.5%
Cap rate
0.2%
Rent to Value Ratio