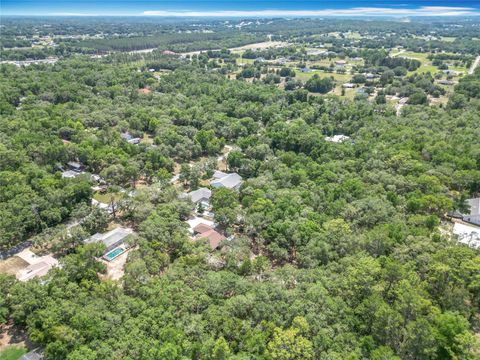
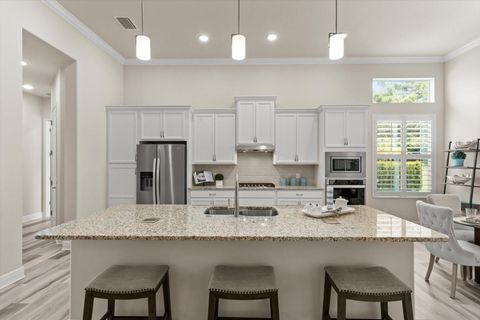
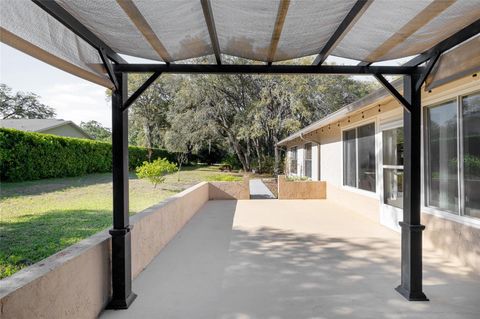
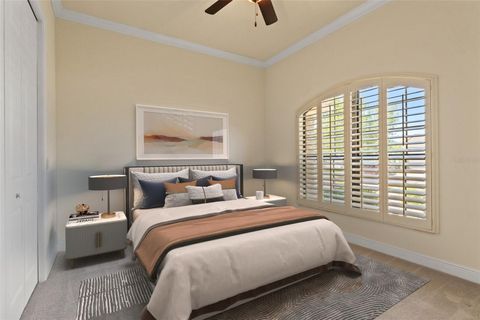
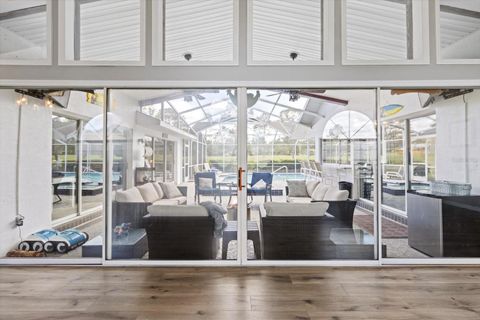
Hernando, FL Investment Properties for Sale
Browse homes for sale and investment properties in Hernando, FL. Refine your search by price, property type, or more.
Best cash flowing properties in Hernando, FL

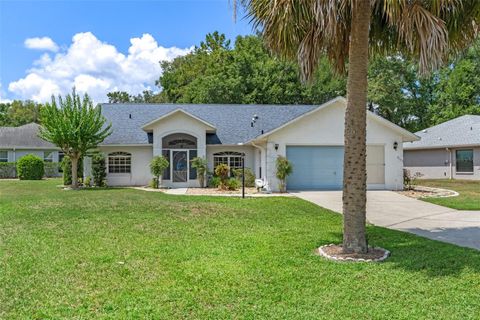
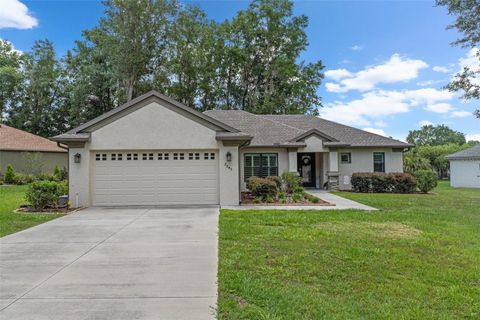
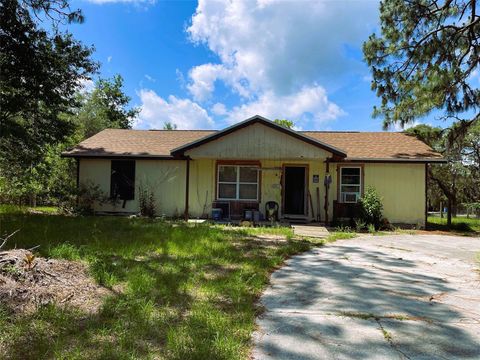
Active
$220,000
3
bds
|
2
ba
|
1,708
sqft
|
built
1974
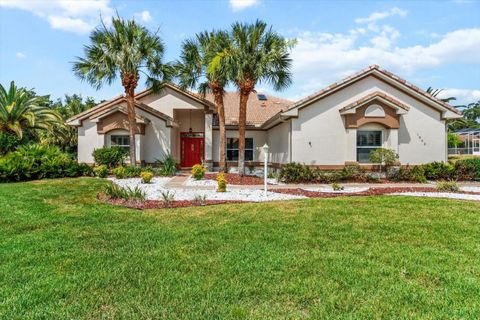
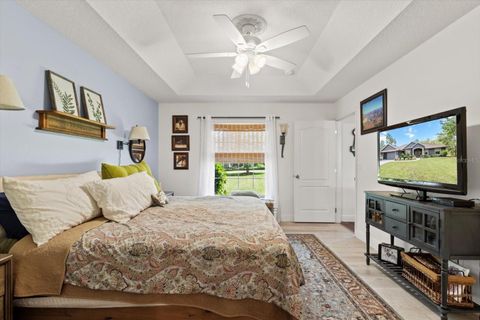
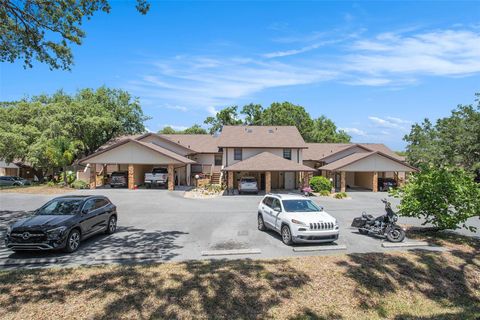
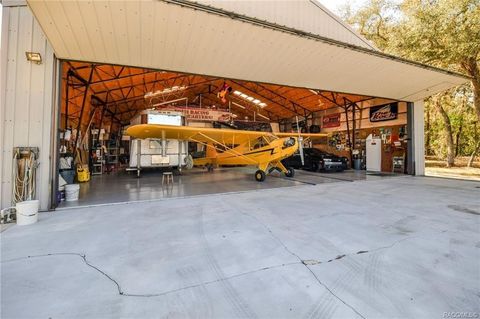
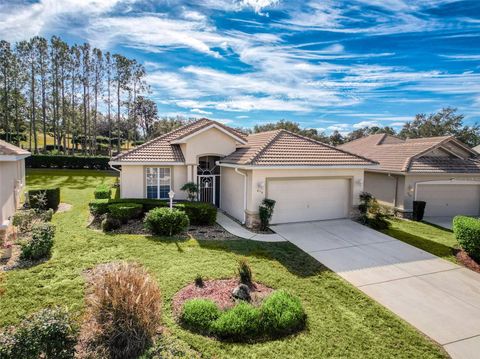
1560 E Fletcher St, Hernando, FL 34442
$473
Cash flow
11.2%
Cash-on-Cash Return
8.7%
Cap rate
1.3%
Rent to Value Ratio
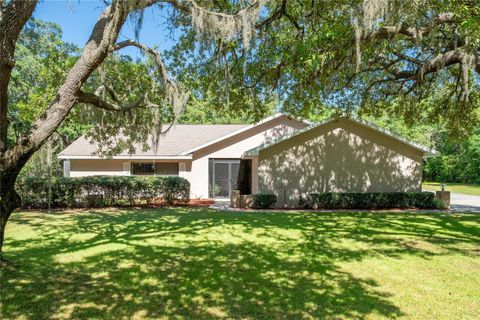
Active
$165,000
1
bds
|
1
ba
|
1,016
sqft
|
built
1958
2931 N Wheaton Pt, Hernando, FL 34442
$457
Cash flow
14.5%
Cash-on-Cash Return
9.5%
Cap rate
1.2%
Rent to Value Ratio
45 out of 50 properties for sale in Hernando, FL
Limited Results Shown
Create a free account, or log in to reveal all property listings and enjoy the complete experience.
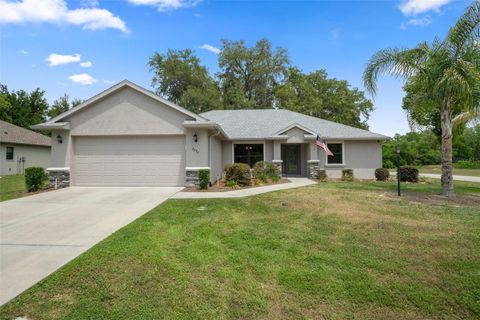
Active
$255,000
3
bds
|
2
ba
|
1,687
sqft
|
built
1997
3150 N Chandler Dr, Hernando, FL 34442
$-112
Cash flow
-2.3%
Cash-on-Cash Return
5.6%
Cap rate
0.7%
Rent to Value Ratio
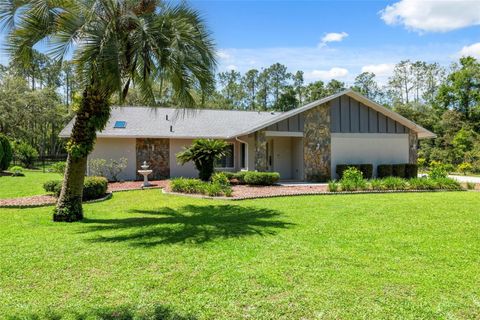
Active
$638,000
3
bds
|
3
ba
|
3,066
sqft
|
built
2004
3188 N Chandler Dr, Hernando, FL 34442
$-1,228
Cash flow
-10.0%
Cash-on-Cash Return
3.8%
Cap rate
0.6%
Rent to Value Ratio
Active
$599,900
4
bds
|
3
ba
|
2,918
sqft
|
built
1997
4322 N Mayan Dr, Hernando, FL 34442
$-1,438
Cash flow
-12.5%
Cash-on-Cash Return
3.4%
Cap rate
0.5%
Rent to Value Ratio
Active
$514,900
3
bds
|
2
ba
|
2,263
sqft
|
built
2000
1802 N Musial Pt, Hernando, FL 34442
$-1,090
Cash flow
-11.0%
Cash-on-Cash Return
3.6%
Cap rate
0.6%
Rent to Value Ratio
Active
$699,000
3
bds
|
2
ba
|
1,760
sqft
|
built
1997
7802 N Fairwind Loop, Hernando, FL 34442
$-2,254
Cash flow
-16.8%
Cash-on-Cash Return
2.3%
Cap rate
0.4%
Rent to Value Ratio
Active
$395,000
3
bds
|
2
ba
|
1,625
sqft
|
built
2023
7435 N Nature Trl, Hernando, FL 34442
$-842
Cash flow
-11.1%
Cash-on-Cash Return
3.6%
Cap rate
0.6%
Rent to Value Ratio
Active
$199,900
2
bds
|
2
ba
|
1,156
sqft
|
built
1988
7186 N Whippoorwill Ter, Hernando, FL 34442
$-174
Cash flow
-4.5%
Cash-on-Cash Return
5.1%
Cap rate
0.8%
Rent to Value Ratio
Active
$440,000
3
bds
|
2
ba
|
1,807
sqft
|
built
2015
1558 E Cleveland St, Hernando, FL 34442
$-693
Cash flow
-8.2%
Cash-on-Cash Return
4.3%
Cap rate
0.6%
Rent to Value Ratio
Active
$395,000
3
bds
|
3
ba
|
1,908
sqft
|
built
1988
381 E Joplin Ct, Hernando, FL 34442
$-642
Cash flow
-8.5%
Cash-on-Cash Return
4.2%
Cap rate
0.6%
Rent to Value Ratio
Active
$395,000
3
bds
|
2
ba
|
2,064
sqft
|
built
2002
234 E Eureka Ct, Hernando, FL 34442
$-502
Cash flow
-6.6%
Cash-on-Cash Return
4.6%
Cap rate
0.6%
Rent to Value Ratio
Active
$399,000
3
bds
|
2
ba
|
1,978
sqft
|
built
1986
375 E Liberty St, Hernando, FL 34442
$-441
Cash flow
-5.8%
Cash-on-Cash Return
4.8%
Cap rate
0.7%
Rent to Value Ratio
Active
$359,900
3
bds
|
2
ba
|
1,668
sqft
|
built
2020
2845 N Appledore Path, Hernando, FL 34442
$-702
Cash flow
-10.2%
Cash-on-Cash Return
3.8%
Cap rate
0.7%
Rent to Value Ratio
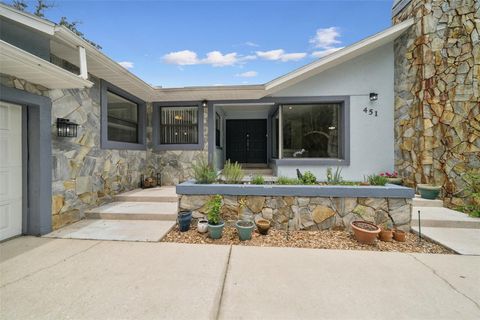
Active
$439,900
3
bds
|
2
ba
|
2,580
sqft
|
built
1986
451 E Ireland Ct, Hernando, FL 34442
$-309
Cash flow
-3.7%
Cash-on-Cash Return
5.3%
Cap rate
0.7%
Rent to Value Ratio
Active
$335,000
3
bds
|
2
ba
|
1,801
sqft
|
built
1985
99 E Dakota Ct, Hernando, FL 34442
$-470
Cash flow
-7.3%
Cash-on-Cash Return
4.5%
Cap rate
0.7%
Rent to Value Ratio
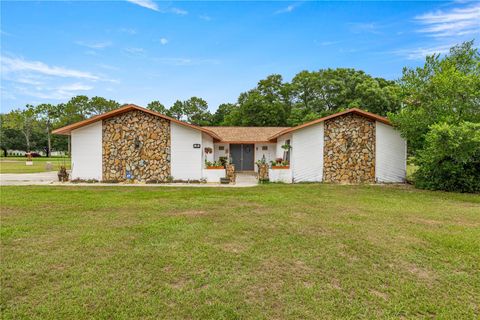
Active
$500,000
4
bds
|
2
ba
|
1,772
sqft
|
built
2004
1199 E Mc Kinley St, Hernando, FL 34442
$-976
Cash flow
-10.2%
Cash-on-Cash Return
3.8%
Cap rate
0.5%
Rent to Value Ratio
Active
$200,000
3
bds
|
2
ba
|
1,200
sqft
|
built
1991
1610 E Fletcher St, Hernando, FL 34442
$-70
Cash flow
-1.8%
Cash-on-Cash Return
5.7%
Cap rate
0.9%
Rent to Value Ratio
Active
$524,999
3
bds
|
2
ba
|
1,794
sqft
|
built
1988
307 N Kinglet Ave, Hernando, FL 34442
$-979
Cash flow
-9.7%
Cash-on-Cash Return
3.9%
Cap rate
0.5%
Rent to Value Ratio
Active
$349,900
3
bds
|
2
ba
|
1,757
sqft
|
built
2021
2797 N Hythe Pt, Hernando, FL 34442
$-622
Cash flow
-9.3%
Cash-on-Cash Return
4.0%
Cap rate
0.6%
Rent to Value Ratio

Active
$435,900
3
bds
|
2
ba
|
2,199
sqft
|
built
1995
1302 E Hartford St, Hernando, FL 34442
$-462
Cash flow
-5.5%
Cash-on-Cash Return
4.9%
Cap rate
0.6%
Rent to Value Ratio
Active
$485,000
3
bds
|
2
ba
|
1,972
sqft
|
built
1985
1212 W Redding St, Hernando, FL 34442
$-913
Cash flow
-9.8%
Cash-on-Cash Return
3.9%
Cap rate
0.5%
Rent to Value Ratio

Active
$339,000
3
bds
|
2
ba
|
2,243
sqft
|
built
2004
3798 N Chandler Dr, Hernando, FL 34442
$-498
Cash flow
-7.7%
Cash-on-Cash Return
4.4%
Cap rate
0.7%
Rent to Value Ratio
Active
$165,000
2
bds
|
2
ba
|
990
sqft
|
built
1984
219 E Hartford St, Hernando, FL 34442
$-139
Cash flow
-4.4%
Cash-on-Cash Return
5.1%
Cap rate
1.2%
Rent to Value Ratio
Active
$595,000
4
bds
|
4
ba
|
3,487
sqft
|
built
1999
4314 N Indianhead Rd, Hernando, FL 34442
$-1,380
Cash flow
-12.1%
Cash-on-Cash Return
3.4%
Cap rate
0.5%
Rent to Value Ratio
Active
$255,000
2
bds
|
2
ba
|
1,707
sqft
|
built
1992
7120 N Croton Pt, Hernando, FL 34442
$-311
Cash flow
-6.4%
Cash-on-Cash Return
4.7%
Cap rate
0.7%
Rent to Value Ratio
Active
$585,000
3
bds
|
3
ba
|
3,141
sqft
|
built
2005
599 E Charleston Ct, Hernando, FL 34442
$-983
Cash flow
-8.8%
Cash-on-Cash Return
4.1%
Cap rate
0.6%
Rent to Value Ratio

Active
$269,900
3
bds
|
2
ba
|
1,758
sqft
|
built
2005
2585 E Farewell Path, Hernando, FL 34442
$-358
Cash flow
-6.9%
Cash-on-Cash Return
4.6%
Cap rate
0.7%
Rent to Value Ratio
Active
$628,900
2
bds
|
2
ba
|
2,209
sqft
|
built
2023
915 N Hunt Club Dr, Hernando, FL 34442
$-2,147
Cash flow
-17.8%
Cash-on-Cash Return
2.1%
Cap rate
0.5%
Rent to Value Ratio
Active
$315,000
2
bds
|
2
ba
|
2,126
sqft
|
built
1984
790 N Fresno Ave, Hernando, FL 34442
$11
Cash flow
0.2%
Cash-on-Cash Return
6.2%
Cap rate
0.8%
Rent to Value Ratio
Active
$849,000
3
bds
|
3
ba
|
2,763
sqft
|
built
2015
1399 N Whisperwood Dr, Hernando, FL 34442
$-2,753
Cash flow
-16.9%
Cash-on-Cash Return
2.3%
Cap rate
0.4%
Rent to Value Ratio

Active
$477,000
2
bds
|
2
ba
|
2,193
sqft
|
built
1986
4101 E Gloria Dr, Hernando, FL 34442
$-662
Cash flow
-7.2%
Cash-on-Cash Return
4.5%
Cap rate
0.6%
Rent to Value Ratio
Active
$475,000
3
bds
|
3
ba
|
2,672
sqft
|
built
1989
390 E Falconry Ct, Hernando, FL 34442
$-614
Cash flow
-6.7%
Cash-on-Cash Return
4.6%
Cap rate
0.7%
Rent to Value Ratio
Active
$789,900
2
bds
|
3
ba
|
2,820
sqft
|
built
1980
7700 N Driggers Pt, Hernando, FL 34442
$-2,712
Cash flow
-17.9%
Cash-on-Cash Return
2.0%
Cap rate
0.4%
Rent to Value Ratio

Active
$269,000
2
bds
|
1
ba
|
1,188
sqft
|
built
1971
1321 E Amberjack Dr, Hernando, FL 34442
$-520
Cash flow
-10.1%
Cash-on-Cash Return
3.8%
Cap rate
0.5%
Rent to Value Ratio
Active
$245,000
3
bds
|
2
ba
|
2,348
sqft
|
built
1980
4100 E Woodduck Ln, Hernando, FL 34442
$72
Cash flow
1.5%
Cash-on-Cash Return
6.5%
Cap rate
0.9%
Rent to Value Ratio
Active
$599,000
4
bds
|
3
ba
|
2,510
sqft
|
built
1987
3175 N Wheaton Pt, Hernando, FL 34442
$-861
Cash flow
-7.5%
Cash-on-Cash Return
4.4%
Cap rate
0.6%
Rent to Value Ratio

Active
$365,000
3
bds
|
2
ba
|
1,729
sqft
|
built
2006
1203 W Diamond Shore Loop, Hernando, FL 34442
$-1,058
Cash flow
-15.1%
Cash-on-Cash Return
2.7%
Cap rate
0.6%
Rent to Value Ratio
Active
$175,000
2
bds
|
2
ba
|
1,146
sqft
|
built
1985
636 E Gilchrist Ct, Hernando, FL 34442
$139
Cash flow
4.1%
Cash-on-Cash Return
7.1%
Cap rate
1.0%
Rent to Value Ratio
Active
$300,000
2
bds
|
2
ba
|
1,666
sqft
|
built
2002
856 W Silver Meadow Loop, Hernando, FL 34442
$-907
Cash flow
-15.8%
Cash-on-Cash Return
2.5%
Cap rate
0.7%
Rent to Value Ratio