Hingham, MA Investment Properties for Sale
Browse homes for sale and investment properties in Hingham, MA. Refine your search by price, property type, or more.
Best cash flowing properties in Hingham, MA
Active
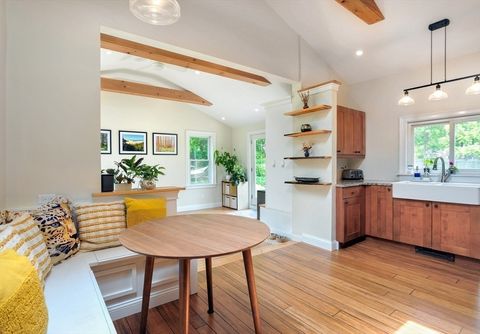
$799,000
3
bds
|
2
ba
|
1,576
sqft
|
built
1880
198 Hull St, Hingham, MA 02043
$-1,296
Cash flow
-8.5%
Cash-on-Cash Return
3.7%
Cap rate
0.6%
Rent to Value Ratio

Active
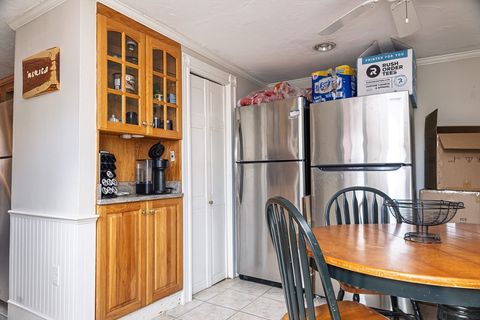
$749,000
3
bds
|
1
ba
|
1,734
sqft
|
built
1952
129 Chief Justice Cushing Hwy, Hingham, MA 02043
$-1,328
Cash flow
-9.3%
Cash-on-Cash Return
3.6%
Cap rate
0.5%
Rent to Value Ratio
23 out of 27 properties for sale in Hingham, MA
Limited Results Shown
Create a free account, or log in to reveal all property listings and enjoy the complete experience.

Active
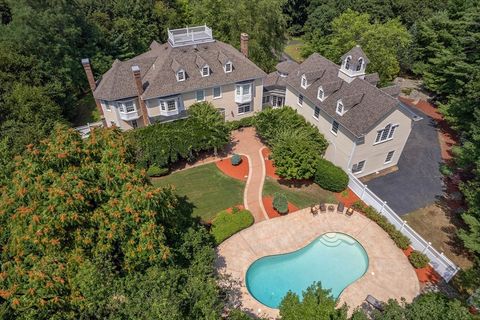
$1,499,000
3
bds
|
2
ba
|
2,271
sqft
|
built
1874
13 Ship St, Hingham, MA 02043
$-4,332
Cash flow
-15.1%
Cash-on-Cash Return
2.2%
Cap rate
0.4%
Rent to Value Ratio

Active
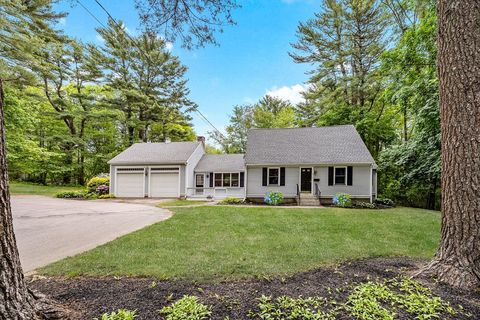
$1,229,000
4
bds
|
2
ba
|
2,207
sqft
|
built
1920
17 Free St, Hingham, MA 02043
$-3,215
Cash flow
-13.6%
Cash-on-Cash Return
2.5%
Cap rate
0.4%
Rent to Value Ratio
Active
$1,450,000
3
bds
|
2
ba
|
2,126
sqft
|
built
1850
166 Hull St, Hingham, MA 02043
$-3,751
Cash flow
-13.5%
Cash-on-Cash Return
2.6%
Cap rate
0.4%
Rent to Value Ratio

Active
$3,999,000
4
bds
|
5
ba
|
5,797
sqft
|
built
2003
2 Black Rock Dr, Hingham, MA 02043
$-15,577
Cash flow
-20.3%
Cash-on-Cash Return
1.0%
Cap rate
0.2%
Rent to Value Ratio

Active
$2,749,999
4
bds
|
5
ba
|
5,959
sqft
|
built
1986
105 East St, Hingham, MA 02043
$-8,992
Cash flow
-17.1%
Cash-on-Cash Return
1.8%
Cap rate
0.3%
Rent to Value Ratio

Active
$3,995,000
4
bds
|
5
ba
|
4,955
sqft
|
built
2025
154 Otis St, Hingham, MA 02043
$-15,270
Cash flow
-19.9%
Cash-on-Cash Return
1.1%
Cap rate
0.2%
Rent to Value Ratio

Active
$1,979,000
4
bds
|
4
ba
|
4,022
sqft
|
built
1910
15 Lewis Ct, Hingham, MA 02043
$-7,209
Cash flow
-19.0%
Cash-on-Cash Return
1.3%
Cap rate
0.3%
Rent to Value Ratio

Active
$2,199,000
4
bds
|
4
ba
|
4,179
sqft
|
built
2017
135 Free St, Hingham, MA 02043
$-5,221
Cash flow
-12.4%
Cash-on-Cash Return
2.8%
Cap rate
0.4%
Rent to Value Ratio

Active
$1,999,999
4
bds
|
3
ba
|
3,430
sqft
|
built
1911
626 Main St, Hingham, MA 02043
$-5,917
Cash flow
-15.4%
Cash-on-Cash Return
2.1%
Cap rate
0.4%
Rent to Value Ratio

Active
$1,175,000
2
bds
|
3
ba
|
1,606
sqft
|
built
2018
10 Shipyard Dr, Hingham, MA 02043
$-3,196
Cash flow
-14.2%
Cash-on-Cash Return
2.4%
Cap rate
0.5%
Rent to Value Ratio
Active
$3,400,000
4
bds
|
6
ba
|
7,100
sqft
|
built
1999
130 Popes Ln, Hingham, MA 02043
$-13,261
Cash flow
-20.3%
Cash-on-Cash Return
1.0%
Cap rate
0.2%
Rent to Value Ratio
Active
$990,000
3
bds
|
2
ba
|
2,482
sqft
|
built
1946
212 Cushing St, Hingham, MA 02043
$-2,145
Cash flow
-11.3%
Cash-on-Cash Return
3.1%
Cap rate
0.5%
Rent to Value Ratio
Active
$5,498,000
6
bds
|
5
ba
|
6,500
sqft
|
built
1890
17 Paige St, Hingham, MA 02043
$-23,346
Cash flow
-22.2%
Cash-on-Cash Return
0.6%
Cap rate
0.1%
Rent to Value Ratio
Active
$4,385,000
6
bds
|
4
ba
|
4,984
sqft
|
built
1840
50 Lincoln St, Hingham, MA 02043
$-18,335
Cash flow
-21.8%
Cash-on-Cash Return
0.7%
Cap rate
0.2%
Rent to Value Ratio
Active
$4,549,000
6
bds
|
6
ba
|
7,101
sqft
|
built
1774
93 Main St, Hingham, MA 02043
$-18,007
Cash flow
-20.7%
Cash-on-Cash Return
0.9%
Cap rate
0.2%
Rent to Value Ratio
Active
$2,145,000
5
bds
|
4
ba
|
4,203
sqft
|
built
2025
34 Kimball Beach Rd, Hingham, MA 02043
$-7,322
Cash flow
-17.8%
Cash-on-Cash Return
1.6%
Cap rate
0.2%
Rent to Value Ratio
Active
$5,399,000
5
bds
|
8
ba
|
8,378
sqft
|
built
2012
86 Black Rock Dr, Hingham, MA 02043
$-27,802
Cash flow
-26.9%
Cash-on-Cash Return
-0.5%
Cap rate
0.1%
Rent to Value Ratio
Active
$4,850,000
5
bds
|
6
ba
|
6,554
sqft
|
built
1929
17 Cole Rd, Hingham, MA 02043
$-20,153
Cash flow
-21.7%
Cash-on-Cash Return
0.7%
Cap rate
0.2%
Rent to Value Ratio
Active
$920,000
3
bds
|
2
ba
|
1,546
sqft
|
built
1922
21 Surry Rd, Hingham, MA 02043
$-2,384
Cash flow
-13.5%
Cash-on-Cash Return
2.6%
Cap rate
0.4%
Rent to Value Ratio

Active
$1,895,000
5
bds
|
4
ba
|
3,668
sqft
|
built
2024
8 Elizabeth Ln, Hingham, MA 02043
$-1,447
Cash flow
-4.0%
Cash-on-Cash Return
4.8%
Cap rate
0.6%
Rent to Value Ratio

Active
$3,995,000
4
bds
|
4
ba
|
5,898
sqft
|
built
1987
70 Lazell St, Hingham, MA 02043
$-14,289
Cash flow
-18.7%
Cash-on-Cash Return
1.4%
Cap rate
0.3%
Rent to Value Ratio