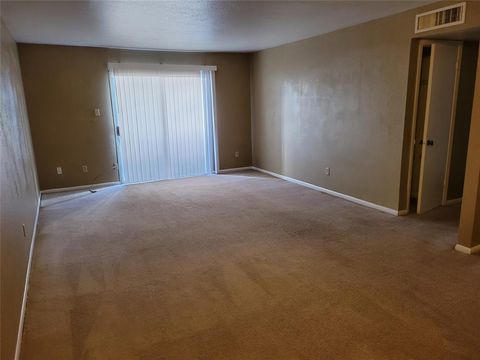
Houston, TX Investment Properties for Sale
Browse homes for sale and investment properties in Houston, TX. Refine your search by price, property type, or more.
Best cash flowing properties in Houston, TX
Active
$57,900
2
bds
|
1
ba
|
834
sqft
|
built
1978
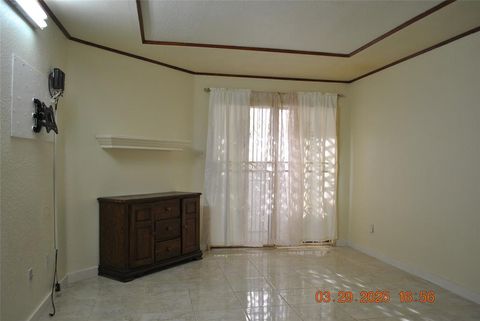
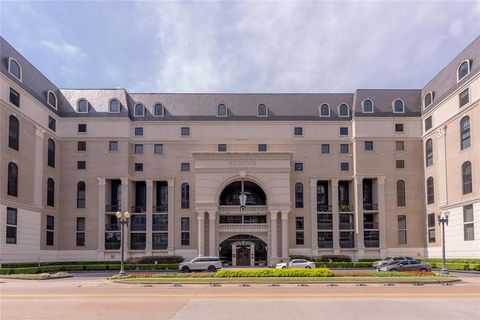
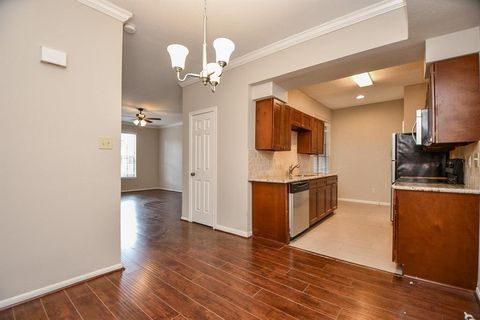
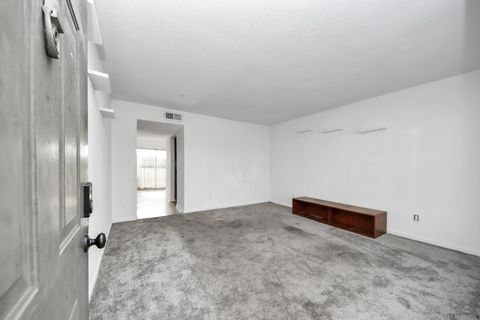
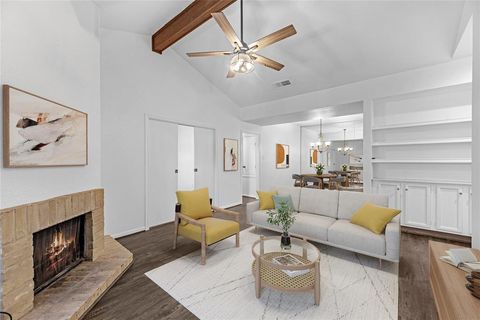
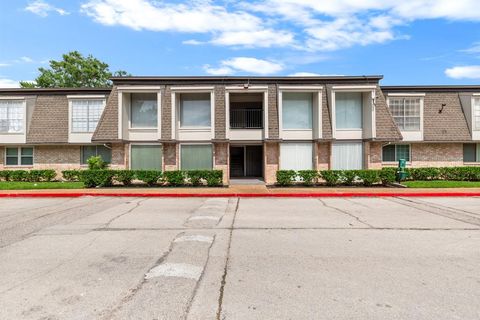
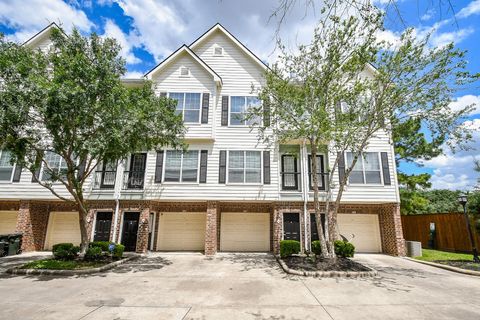
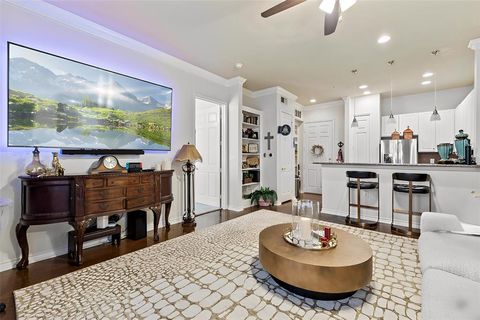
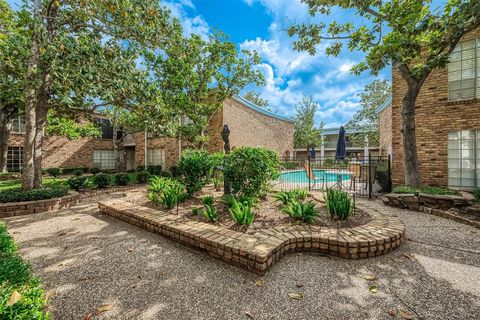
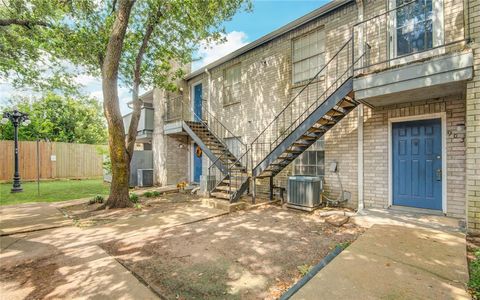
8405 Wilcrest Dr, Houston, TX 77072
$371
Cash flow
7.5%
Cash-on-Cash Return
7.7%
Cap rate
1.9%
Rent to Value Ratio
Active
$65,000
2
bds
|
2
ba
|
1,018
sqft
|
built
1978
8405 Wilcrest Dr, Houston, TX 77072
$254
Cash flow
4.6%
Cash-on-Cash Return
4.7%
Cap rate
1.5%
Rent to Value Ratio
914 out of 1,016 properties for sale in Houston, TX
Limited Results Shown
Create a free account, or log in to reveal all property listings and enjoy the complete experience.
Active
$155,000
2
bds
|
2
ba
|
1,282
sqft
|
built
1982
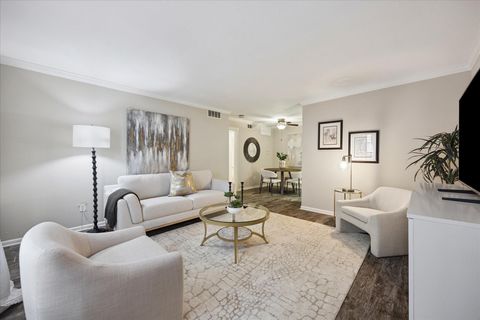
14911 Wunderlich Dr, Houston, TX 77069
$-262
Cash flow
-8.8%
Cash-on-Cash Return
3.7%
Cap rate
1.0%
Rent to Value Ratio
Active
$89,999
2
bds
|
2
ba
|
1,092
sqft
|
built
1979
8419 Hearth Dr, Houston, TX 77054
$-205
Cash flow
-11.9%
Cash-on-Cash Return
2.9%
Cap rate
1.3%
Rent to Value Ratio
Active
$515,000
1
bds
|
2
ba
|
1,802
sqft
|
built
2000
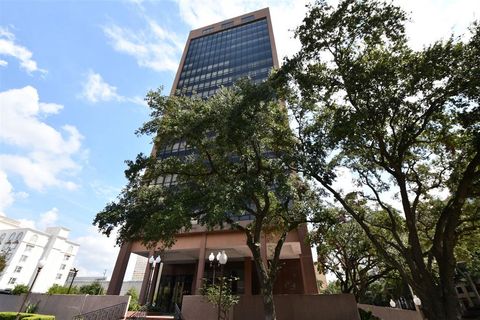
1005 S Shepherd Dr, Houston, TX 77019
$-1,994
Cash flow
-20.2%
Cash-on-Cash Return
1.0%
Cap rate
0.6%
Rent to Value Ratio
Active
$149,000
1
bds
|
1
ba
|
774
sqft
|
built
1983
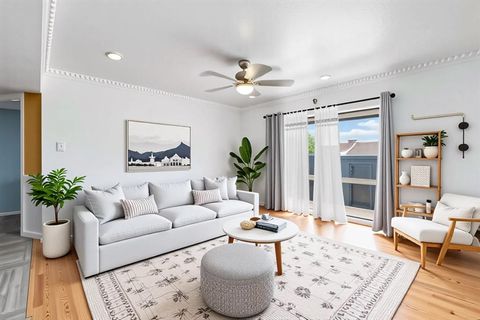
2255 Braeswood Park Dr, Houston, TX 77030
$-447
Cash flow
-15.7%
Cash-on-Cash Return
2.1%
Cap rate
0.9%
Rent to Value Ratio
Active
$279,900
2
bds
|
1
ba
|
1,230
sqft
|
built
1992
2111 Welch St, Houston, TX 77019
$-1,057
Cash flow
-19.7%
Cash-on-Cash Return
1.1%
Cap rate
0.8%
Rent to Value Ratio
Active
$199,900
2
bds
|
2
ba
|
1,055
sqft
|
built
1995
1330 Old Spanish Trl, Houston, TX 77054
$-550
Cash flow
-14.4%
Cash-on-Cash Return
2.4%
Cap rate
0.9%
Rent to Value Ratio
Active
$100,000
3
bds
|
2
ba
|
1,182
sqft
|
built
1976
8100 Creekbend Dr, Houston, TX 77071
$-49
Cash flow
-2.6%
Cash-on-Cash Return
5.1%
Cap rate
1.3%
Rent to Value Ratio
Active
$339,000
2
bds
|
2
ba
|
1,017
sqft
|
built
2001
2400 Mc Cue Rd, Houston, TX 77056
$-1,522
Cash flow
-23.4%
Cash-on-Cash Return
0.3%
Cap rate
0.6%
Rent to Value Ratio
Active
$93,000
2
bds
|
2
ba
|
1,164
sqft
|
built
1982
10211 Sugar Branch Dr, Houston, TX 77036
$-148
Cash flow
-8.3%
Cash-on-Cash Return
3.8%
Cap rate
1.4%
Rent to Value Ratio
Active
$109,000
1
bds
|
1
ba
|
729
sqft
|
built
1980
7950 N Stadium Dr, Houston, TX 77030
$-83
Cash flow
-4.0%
Cash-on-Cash Return
4.8%
Cap rate
1.3%
Rent to Value Ratio
Active
$210,000
2
bds
|
2
ba
|
1,286
sqft
|
built
1977
11711 Memorial Dr, Houston, TX 77024
$-601
Cash flow
-14.9%
Cash-on-Cash Return
2.2%
Cap rate
0.9%
Rent to Value Ratio
Active
$110,000
1
bds
|
1
ba
|
678
sqft
|
built
1978
2350 Bering Dr, Houston, TX 77057
$17
Cash flow
0.8%
Cash-on-Cash Return
5.9%
Cap rate
1.1%
Rent to Value Ratio
Active
$239,000
2
bds
|
2
ba
|
1,427
sqft
|
built
1981
5150 Hidalgo St, Houston, TX 77056
$-1,258
Cash flow
-27.5%
Cash-on-Cash Return
-0.6%
Cap rate
1.0%
Rent to Value Ratio
Active
$115,000
2
bds
|
2
ba
|
1,080
sqft
|
built
1980
3015 Walnut Bend Ln, Houston, TX 77042
$-200
Cash flow
-9.1%
Cash-on-Cash Return
3.6%
Cap rate
1.3%
Rent to Value Ratio
Active
$175,000
2
bds
|
3
ba
|
1,174
sqft
|
built
1982
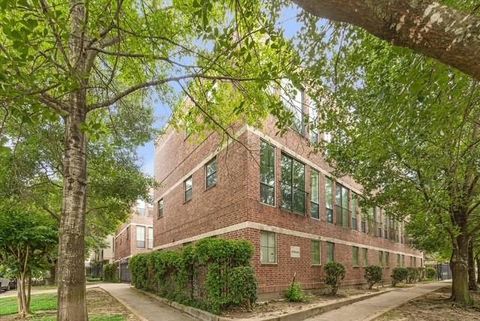
7575 Cambridge St, Houston, TX 77054
$-522
Cash flow
-15.6%
Cash-on-Cash Return
2.1%
Cap rate
0.9%
Rent to Value Ratio
Active
$117,000
2
bds
|
2
ba
|
980
sqft
|
built
1983
2011 Spenwick Dr, Houston, TX 77055
$-370
Cash flow
-16.5%
Cash-on-Cash Return
1.9%
Cap rate
1.1%
Rent to Value Ratio
Active
$485,000
2
bds
|
2
ba
|
1,250
sqft
|
built
1983
2001 Holcombe Blvd, Houston, TX 77030
$-2,282
Cash flow
-24.5%
Cash-on-Cash Return
0.0%
Cap rate
0.5%
Rent to Value Ratio

Active
$335,000
3
bds
|
3
ba
|
2,178
sqft
|
built
1983
3350 Mc Cue Rd, Houston, TX 77056
$-2,526
Cash flow
-39.3%
Cash-on-Cash Return
-3.4%
Cap rate
0.9%
Rent to Value Ratio
Active
$87,800
2
bds
|
2
ba
|
1,068
sqft
|
built
1983
9797 Leawood Blvd, Houston, TX 77099
$-160
Cash flow
-9.5%
Cash-on-Cash Return
3.5%
Cap rate
1.3%
Rent to Value Ratio
Active
$74,000
2
bds
|
2
ba
|
1,040
sqft
|
built
1979
8519 Hearth Dr, Houston, TX 77054
$189
Cash flow
3.0%
Cash-on-Cash Return
3.1%
Cap rate
1.5%
Rent to Value Ratio
Active
$92,000
2
bds
|
2
ba
|
796
sqft
|
built
1984
2750 Holly Hall St, Houston, TX 77054
$31
Cash flow
1.8%
Cash-on-Cash Return
6.1%
Cap rate
1.3%
Rent to Value Ratio

Active
$330,000
3
bds
|
3
ba
|
2,115
sqft
|
built
1980
661 Bering Dr, Houston, TX 77057
$-2,375
Cash flow
-37.5%
Cash-on-Cash Return
-3.0%
Cap rate
0.7%
Rent to Value Ratio
Active
$108,500
2
bds
|
2
ba
|
1,152
sqft
|
built
1983
3770 Lovers Wood Ln, Houston, TX 77014
$-359
Cash flow
-17.3%
Cash-on-Cash Return
1.7%
Cap rate
1.2%
Rent to Value Ratio
Active
$164,899
3
bds
|
3
ba
|
1,880
sqft
|
built
2021
5802 Twisted Pine Ct, Houston, TX 77039
$-66
Cash flow
-2.1%
Cash-on-Cash Return
5.2%
Cap rate
1.2%
Rent to Value Ratio
Active
$215,000
3
bds
|
2
ba
|
1,522
sqft
|
built
1969
12633 Memorial Dr, Houston, TX 77024
$-531
Cash flow
-12.9%
Cash-on-Cash Return
2.7%
Cap rate
0.9%
Rent to Value Ratio
Active
$136,000
1
bds
|
1
ba
|
774
sqft
|
built
1983
2255 Braeswood Park Dr, Houston, TX 77030
$-130
Cash flow
-5.0%
Cash-on-Cash Return
4.5%
Cap rate
1.0%
Rent to Value Ratio
Active
$249,000
2
bds
|
2
ba
|
1,183
sqft
|
built
2005
1711 Old Spanish Trl, Houston, TX 77054
$-510
Cash flow
-10.7%
Cash-on-Cash Return
3.2%
Cap rate
0.8%
Rent to Value Ratio
Active
$314,999
2
bds
|
3
ba
|
1,666
sqft
|
built
2001
1616 Fountain View Dr, Houston, TX 77057
$-1,468
Cash flow
-24.3%
Cash-on-Cash Return
0.1%
Cap rate
0.7%
Rent to Value Ratio
Active
$154,000
1
bds
|
2
ba
|
858
sqft
|
built
2003
9200 Westheimer Rd, Houston, TX 77063
$-465
Cash flow
-15.8%
Cash-on-Cash Return
2.1%
Cap rate
0.9%
Rent to Value Ratio
Active
$325,000
2
bds
|
2
ba
|
1,066
sqft
|
built
2004
118 Mc Gowen St, Houston, TX 77006
$-1,176
Cash flow
-18.9%
Cash-on-Cash Return
1.3%
Cap rate
0.6%
Rent to Value Ratio
Active
$199,900
1
bds
|
1
ba
|
783
sqft
|
built
2003
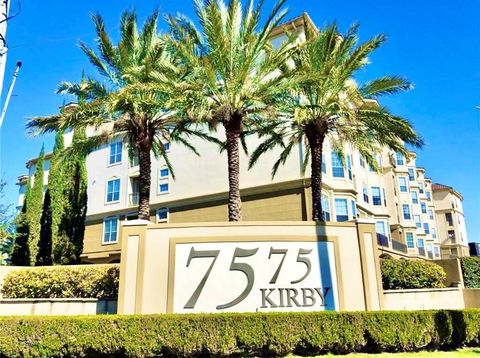
7575 Kirby Dr, Houston, TX 77030
$-523
Cash flow
-13.7%
Cash-on-Cash Return
2.5%
Cap rate
0.7%
Rent to Value Ratio
Active
$222,000
1
bds
|
1
ba
|
869
sqft
|
built
2003
1901 Post Oak Blvd, Houston, TX 77056
$-639
Cash flow
-15.0%
Cash-on-Cash Return
2.2%
Cap rate
0.9%
Rent to Value Ratio
Active
$200,000
1
bds
|
1
ba
|
679
sqft
|
built
2001
2400 Mc Cue Rd, Houston, TX 77056
$-331
Cash flow
-8.6%
Cash-on-Cash Return
3.7%
Cap rate
0.9%
Rent to Value Ratio
Active
$159,000
2
bds
|
2
ba
|
1,103
sqft
|
built
1980
8435 Sands Point Dr, Houston, TX 77036
$-286
Cash flow
-9.4%
Cash-on-Cash Return
3.5%
Cap rate
0.9%
Rent to Value Ratio
Active
$132,500
2
bds
|
2
ba
|
1,184
sqft
|
built
1981
3130 Walnut Bend Ln, Houston, TX 77042
$-336
Cash flow
-13.2%
Cash-on-Cash Return
2.6%
Cap rate
1.1%
Rent to Value Ratio
Active
$165,000
2
bds
|
2
ba
|
1,052
sqft
|
built
1964
8277 Kingsbrook Rd, Houston, TX 77024
$-399
Cash flow
-12.6%
Cash-on-Cash Return
2.8%
Cap rate
1.2%
Rent to Value Ratio
Active
$120,000
1
bds
|
1
ba
|
660
sqft
|
built
1968
2121 Fountain View Dr, Houston, TX 77057
$-126
Cash flow
-5.5%
Cash-on-Cash Return
4.4%
Cap rate
1.1%
Rent to Value Ratio
Active
$88,000
2
bds
|
2
ba
|
1,068
sqft
|
built
1983
9797 Leawood Blvd, Houston, TX 77099
$-48
Cash flow
-2.8%
Cash-on-Cash Return
5.0%
Cap rate
1.5%
Rent to Value Ratio