Houston, TX Investment Properties for Sale
Browse homes for sale and investment properties in Houston, TX. Refine your search by price, property type, or more.
Best cash flowing properties in Houston, TX
Active
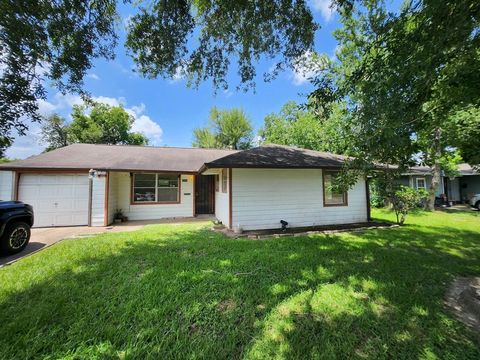
$180,000
4
bds
|
2
ba
|
1,947
sqft
|
built
1971
12806 Bauman Rd, Houston, TX 77037
$666
Cash flow
19.3%
Cash-on-Cash Return
10.1%
Cap rate
1.2%
Rent to Value Ratio
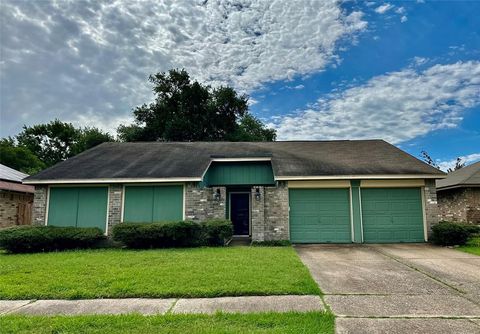
Active
$119,990
3
bds
|
1
ba
|
1,232
sqft
|
built
1953
3210 Mc Crarey Dr, Houston, TX 77088
$260
Cash flow
11.3%
Cash-on-Cash Return
8.3%
Cap rate
1.3%
Rent to Value Ratio
5,557 out of 5,966 properties for sale in Houston, TX
Limited Results Shown
Create a free account, or log in to reveal all property listings and enjoy the complete experience.
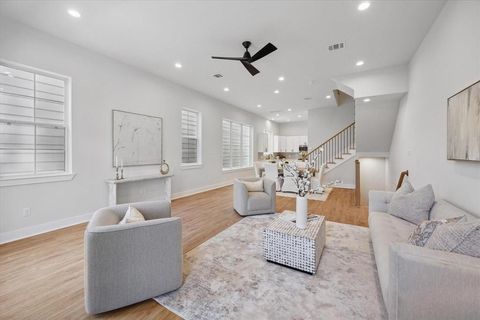
Active
$175,000
3
bds
|
2
ba
|
956
sqft
|
built
1942
6810 Eastwood St, Houston, TX 77021
$-96
Cash flow
-2.9%
Cash-on-Cash Return
5.0%
Cap rate
0.8%
Rent to Value Ratio
Active
$155,000
2
bds
|
3
ba
|
1,664
sqft
|
built
1963
3300 Yorktown St, Houston, TX 77056
$-1,068
Cash flow
-35.9%
Cash-on-Cash Return
-2.6%
Cap rate
1.3%
Rent to Value Ratio
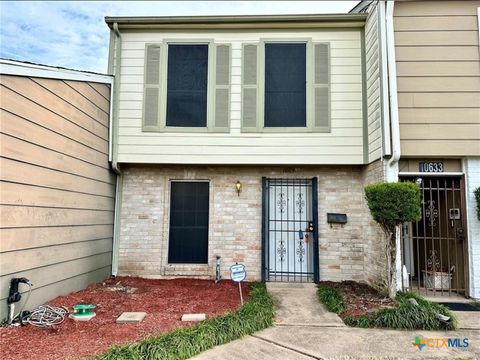
Active
$181,500
2
bds
|
3
ba
|
1,728
sqft
|
built
1973
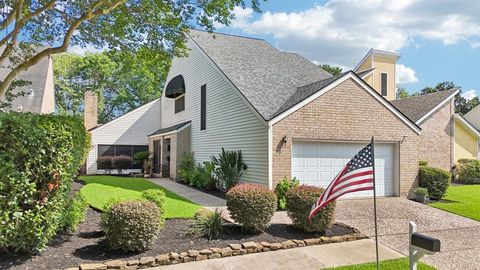
10631 Sandpiper Dr, Houston, TX 77096
$230
Cash flow
6.6%
Cash-on-Cash Return
7.2%
Cap rate
1.1%
Rent to Value Ratio
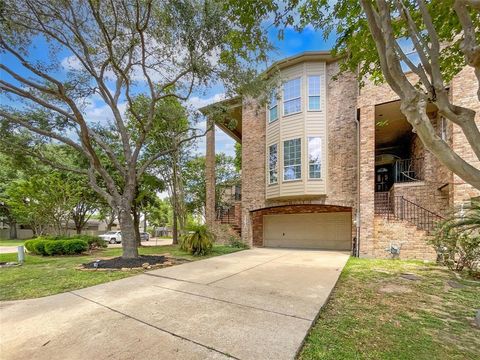
Active
$695,000
3
bds
|
4
ba
|
2,618
sqft
|
built
2002
4524 Rose St, Houston, TX 77007
$-1,644
Cash flow
-12.3%
Cash-on-Cash Return
2.8%
Cap rate
0.5%
Rent to Value Ratio
Active
$155,000
2
bds
|
2
ba
|
1,282
sqft
|
built
1982
14911 Wunderlich Dr, Houston, TX 77069
$-262
Cash flow
-8.8%
Cash-on-Cash Return
3.7%
Cap rate
1.0%
Rent to Value Ratio
Active
$155,000
2
bds
|
1
ba
|
1,012
sqft
|
built
1938
7815 Dayton St, Houston, TX 77012
$157
Cash flow
5.3%
Cash-on-Cash Return
6.9%
Cap rate
1.0%
Rent to Value Ratio
Active
$2,895,000
4
bds
|
4
ba
|
3,306
sqft
|
built
1974
435 Flint Point Dr, Houston, TX 77024
$-12,493
Cash flow
-22.5%
Cash-on-Cash Return
0.5%
Cap rate
0.2%
Rent to Value Ratio
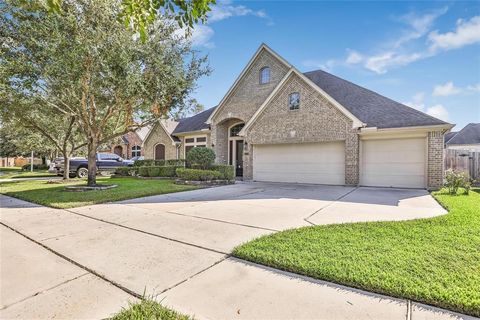
Active
$469,900
3
bds
|
4
ba
|
2,345
sqft
|
built
2013
1909 Hickory St, Houston, TX 77007
$-1,102
Cash flow
-12.2%
Cash-on-Cash Return
2.9%
Cap rate
0.6%
Rent to Value Ratio
Active
$335,000
4
bds
|
3
ba
|
2,076
sqft
|
built
1975
10007 Sagedowne Ln, Houston, TX 77089
$-681
Cash flow
-10.6%
Cash-on-Cash Return
3.2%
Cap rate
0.6%
Rent to Value Ratio
Active
$2,900,000
4
bds
|
4
ba
|
4,947
sqft
|
built
2000
2409 Maconda Ln, Houston, TX 77027
$-11,491
Cash flow
-20.7%
Cash-on-Cash Return
0.9%
Cap rate
0.3%
Rent to Value Ratio
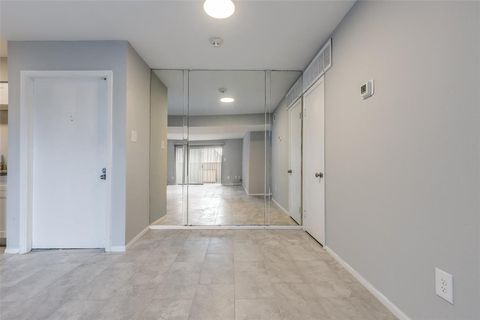
Active
$279,990
3
bds
|
2
ba
|
1,512
sqft
|
built
1950
7109 Saint Augustine St, Houston, TX 77021
$21
Cash flow
0.4%
Cash-on-Cash Return
5.8%
Cap rate
0.8%
Rent to Value Ratio
Active
$159,900
3
bds
|
1
ba
|
1,176
sqft
|
built
1950
5302 Lavender St, Houston, TX 77026
$69
Cash flow
2.3%
Cash-on-Cash Return
6.2%
Cap rate
1.1%
Rent to Value Ratio
Active
$1,250,000
4
bds
|
4
ba
|
4,664
sqft
|
built
1940
2127 Milford St, Houston, TX 77098
$-5,678
Cash flow
-23.7%
Cash-on-Cash Return
0.2%
Cap rate
0.3%
Rent to Value Ratio
Active
$319,999
2
bds
|
1
ba
|
720
sqft
|
built
1930
3417 Bremond St, Houston, TX 77004
$-1,197
Cash flow
-19.5%
Cash-on-Cash Return
1.2%
Cap rate
0.3%
Rent to Value Ratio
Active
$390,000
4
bds
|
4
ba
|
3,097
sqft
|
built
1993
6923 Queensclub Dr, Houston, TX 77069
$-707
Cash flow
-9.5%
Cash-on-Cash Return
3.5%
Cap rate
0.7%
Rent to Value Ratio
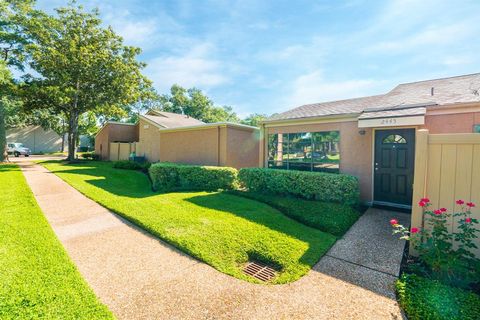
Active
$185,000
3
bds
|
2
ba
|
1,307
sqft
|
built
1978
2445 Briarwest Blvd, Houston, TX 77077
$-307
Cash flow
-8.7%
Cash-on-Cash Return
3.7%
Cap rate
0.9%
Rent to Value Ratio
Active
$420,000
3
bds
|
2
ba
|
1,600
sqft
|
built
1955
3709 Gager St, Houston, TX 77093
$-1,151
Cash flow
-14.3%
Cash-on-Cash Return
2.4%
Cap rate
0.4%
Rent to Value Ratio
Active
$249,500
3
bds
|
2
ba
|
1,539
sqft
|
built
1979
12531 La Rochelle Dr, Houston, TX 77015
$-403
Cash flow
-8.4%
Cash-on-Cash Return
3.7%
Cap rate
0.7%
Rent to Value Ratio
Active
$510,000
3
bds
|
2
ba
|
1,431
sqft
|
built
2022
7422 Mount St, Houston, TX 77088
$-1,220
Cash flow
-12.5%
Cash-on-Cash Return
2.8%
Cap rate
0.4%
Rent to Value Ratio
Active
$365,000
3
bds
|
3
ba
|
1,823
sqft
|
built
2022
5214 Sherman St, Houston, TX 77011
$-392
Cash flow
-5.6%
Cash-on-Cash Return
4.4%
Cap rate
0.8%
Rent to Value Ratio

Active
$170,000
2
bds
|
3
ba
|
1,600
sqft
|
built
1984
3254 Holly Hall St, Houston, TX 77054
$-644
Cash flow
-19.8%
Cash-on-Cash Return
1.1%
Cap rate
1.1%
Rent to Value Ratio
Active
$279,000
3
bds
|
2
ba
|
1,579
sqft
|
built
2023
11411 Bright Sun Dr, Houston, TX 77048
$-329
Cash flow
-6.2%
Cash-on-Cash Return
4.3%
Cap rate
0.8%
Rent to Value Ratio
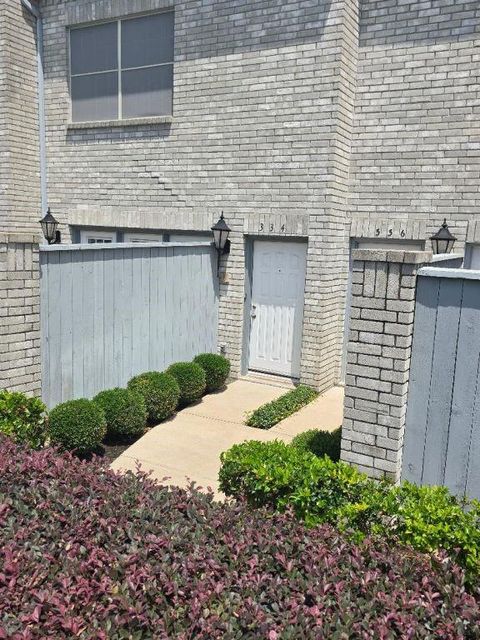
Active
$204,000
2
bds
|
3
ba
|
1,740
sqft
|
built
1983
334 Wilcrest Dr, Houston, TX 77042
$-662
Cash flow
-16.9%
Cash-on-Cash Return
1.8%
Cap rate
0.9%
Rent to Value Ratio
Active
$159,000
3
bds
|
1
ba
|
1,185
sqft
|
built
1952
5535 Flamingo Dr, Houston, TX 77033
$163
Cash flow
5.3%
Cash-on-Cash Return
6.9%
Cap rate
1.0%
Rent to Value Ratio
Active
$332,000
2
bds
|
3
ba
|
2,173
sqft
|
built
2002
12620 Briar Patch Rd, Houston, TX 77077
$-920
Cash flow
-14.5%
Cash-on-Cash Return
2.4%
Cap rate
0.7%
Rent to Value Ratio
Active
$549,900
4
bds
|
4
ba
|
3,724
sqft
|
built
2010
13722 Playa Lucia Ct, Houston, TX 77044
$-1,145
Cash flow
-10.9%
Cash-on-Cash Return
3.2%
Cap rate
0.7%
Rent to Value Ratio
Active
$89,999
2
bds
|
2
ba
|
1,092
sqft
|
built
1979
8419 Hearth Dr, Houston, TX 77054
$-205
Cash flow
-11.9%
Cash-on-Cash Return
2.9%
Cap rate
1.3%
Rent to Value Ratio
Active
$365,000
4
bds
|
4
ba
|
2,602
sqft
|
built
2001
10210 Squirehill Ct, Houston, TX 77070
$-666
Cash flow
-9.5%
Cash-on-Cash Return
3.5%
Cap rate
0.7%
Rent to Value Ratio
Active
$15,900,000
6
bds
|
11
ba
|
13,788
sqft
|
built
1983
3812 Willowick Rd, Houston, TX 77019
$-83,850
Cash flow
-27.5%
Cash-on-Cash Return
-0.6%
Cap rate
0.0%
Rent to Value Ratio
Active
$525,000
9
bds
|
0
ba
|
2,992
sqft
|
built
1948
4718 Gunter St, Houston, TX 77020
$-1,490
Cash flow
-14.8%
Cash-on-Cash Return
2.3%
Cap rate
0.5%
Rent to Value Ratio
Active
$335,000
4
bds
|
3
ba
|
2,513
sqft
|
built
2022
5014 Aspen Orchard Dr, Houston, TX 77066
$-726
Cash flow
-11.3%
Cash-on-Cash Return
3.1%
Cap rate
0.7%
Rent to Value Ratio
Active
$335,000
2
bds
|
3
ba
|
1,365
sqft
|
built
2022
753 N Emile St, Houston, TX 77020
$-310
Cash flow
-4.8%
Cash-on-Cash Return
4.6%
Cap rate
0.8%
Rent to Value Ratio
Active
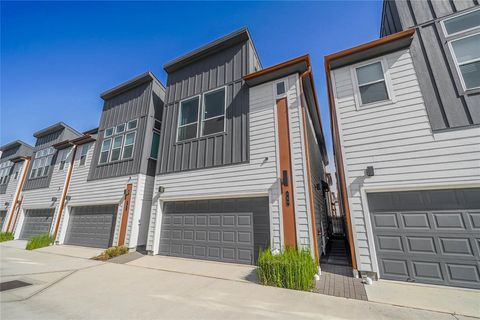
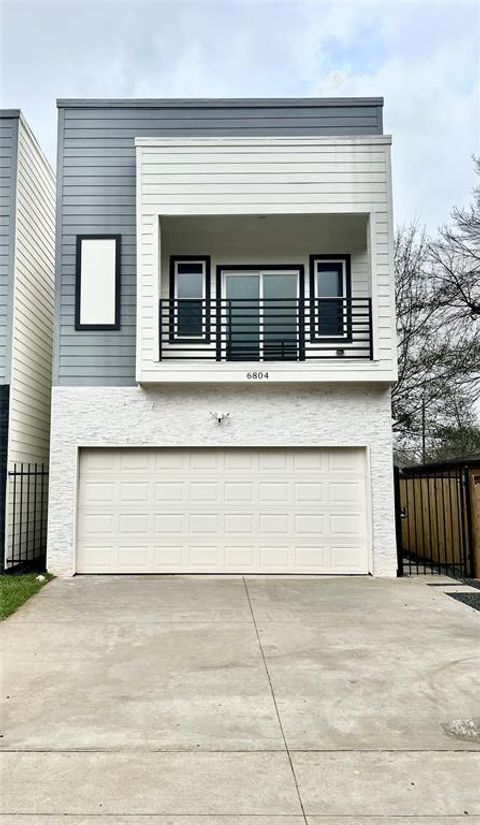
$349,900
3
bds
|
3
ba
|
1,706
sqft
|
built
2022
6804 Foster St, Houston, TX 77021
$69
Cash flow
1.0%
Cash-on-Cash Return
5.9%
Cap rate
0.7%
Rent to Value Ratio
Active
$131,000
3
bds
|
2
ba
|
1,672
sqft
|
built
1978
9501 Windswept Ln, Houston, TX 77063
$-314
Cash flow
-12.5%
Cash-on-Cash Return
2.8%
Cap rate
1.3%
Rent to Value Ratio
Active
$349,900
3
bds
|
3
ba
|
1,683
sqft
|
built
2022
3508 Oak Forest Grove Dr, Houston, TX 77018
$-511
Cash flow
-7.6%
Cash-on-Cash Return
3.9%
Cap rate
0.7%
Rent to Value Ratio
Active
$475,000
3
bds
|
3
ba
|
2,453
sqft
|
built
1980
12207 Gladewick Dr, Houston, TX 77077
$-1,146
Cash flow
-12.6%
Cash-on-Cash Return
2.8%
Cap rate
0.6%
Rent to Value Ratio
Active
$530,000
3
bds
|
4
ba
|
0
sqft
|
built
2024
1037 W 17th St, Houston, TX 77008
$-253
Cash flow
-2.5%
Cash-on-Cash Return
5.1%
Cap rate
0.7%
Rent to Value Ratio
Active
$248,000
3
bds
|
2
ba
|
1,602
sqft
|
built
1984
7254 Sonnet Glen Ln, Houston, TX 77095
$-361
Cash flow
-7.6%
Cash-on-Cash Return
3.9%
Cap rate
0.8%
Rent to Value Ratio