Houston, TX Investment Properties for Sale
Browse homes for sale and investment properties in Houston, TX. Refine your search by price, property type, or more.
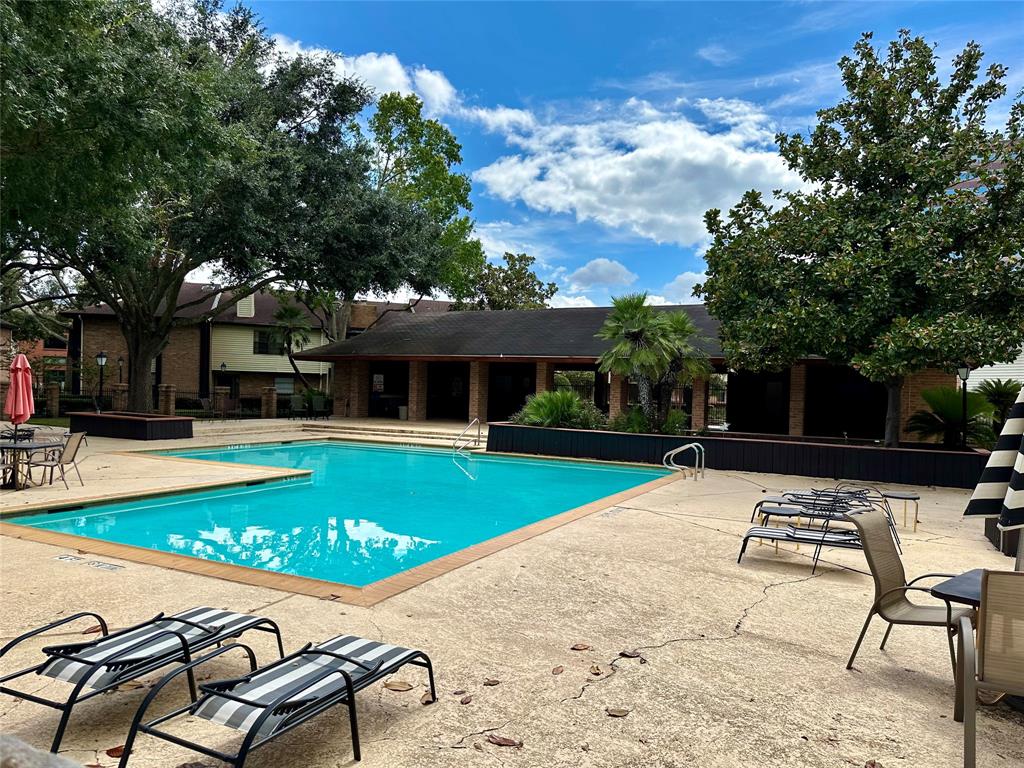
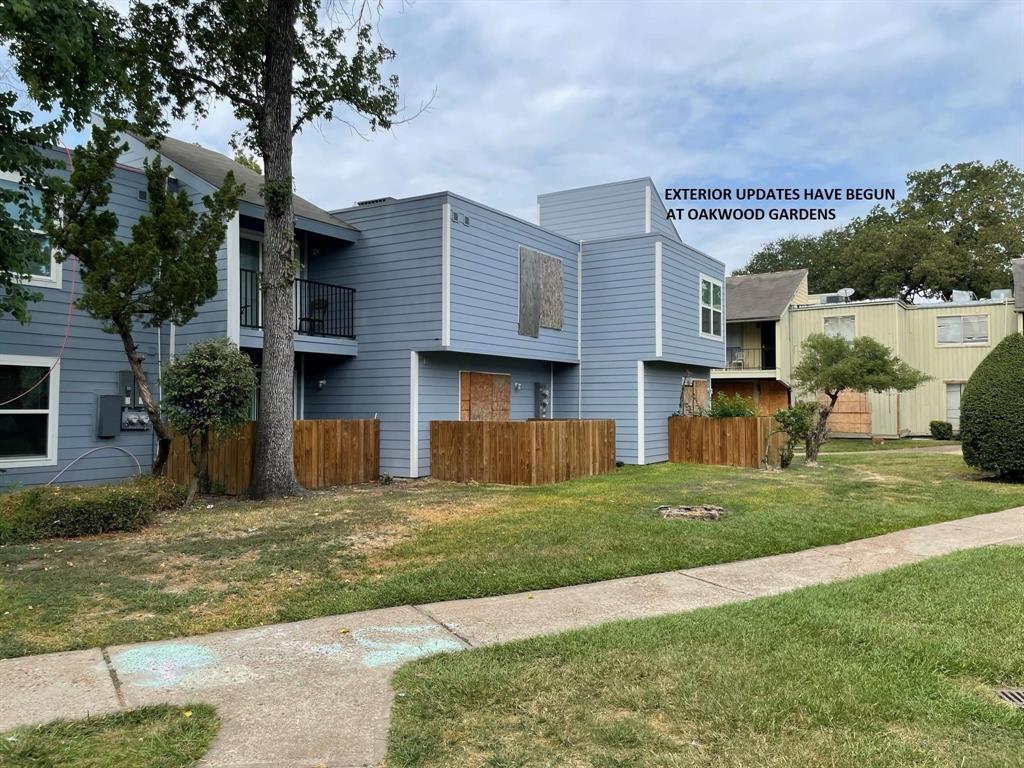
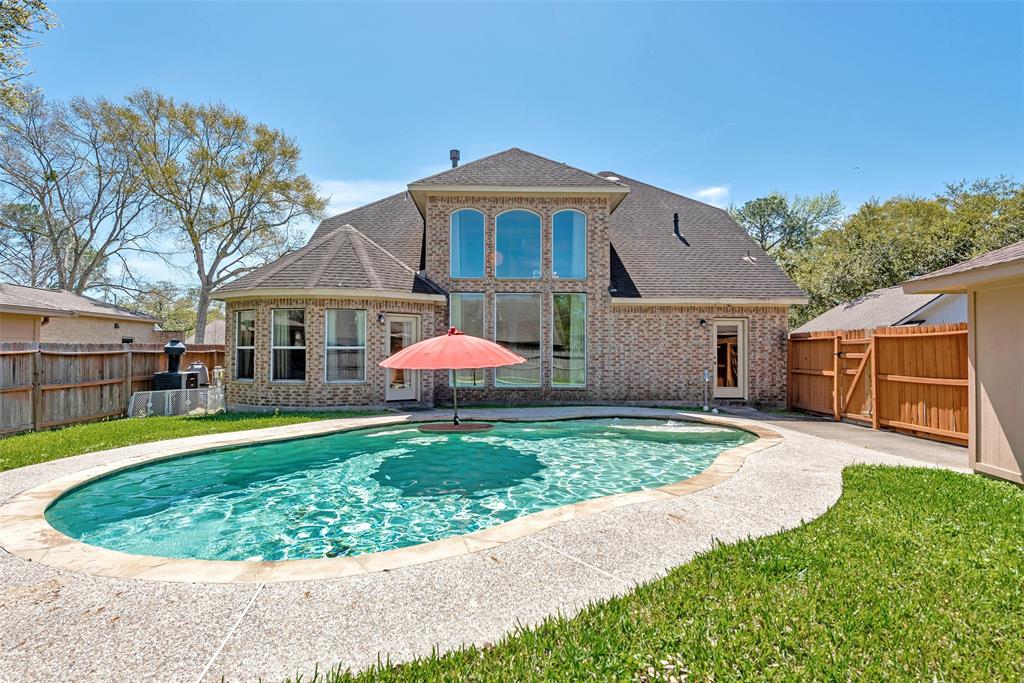
Best cash flowing properties in Houston, TX

Active
$249,000
2
bds
|
0
ba
|
1,080
sqft
|
built
1930
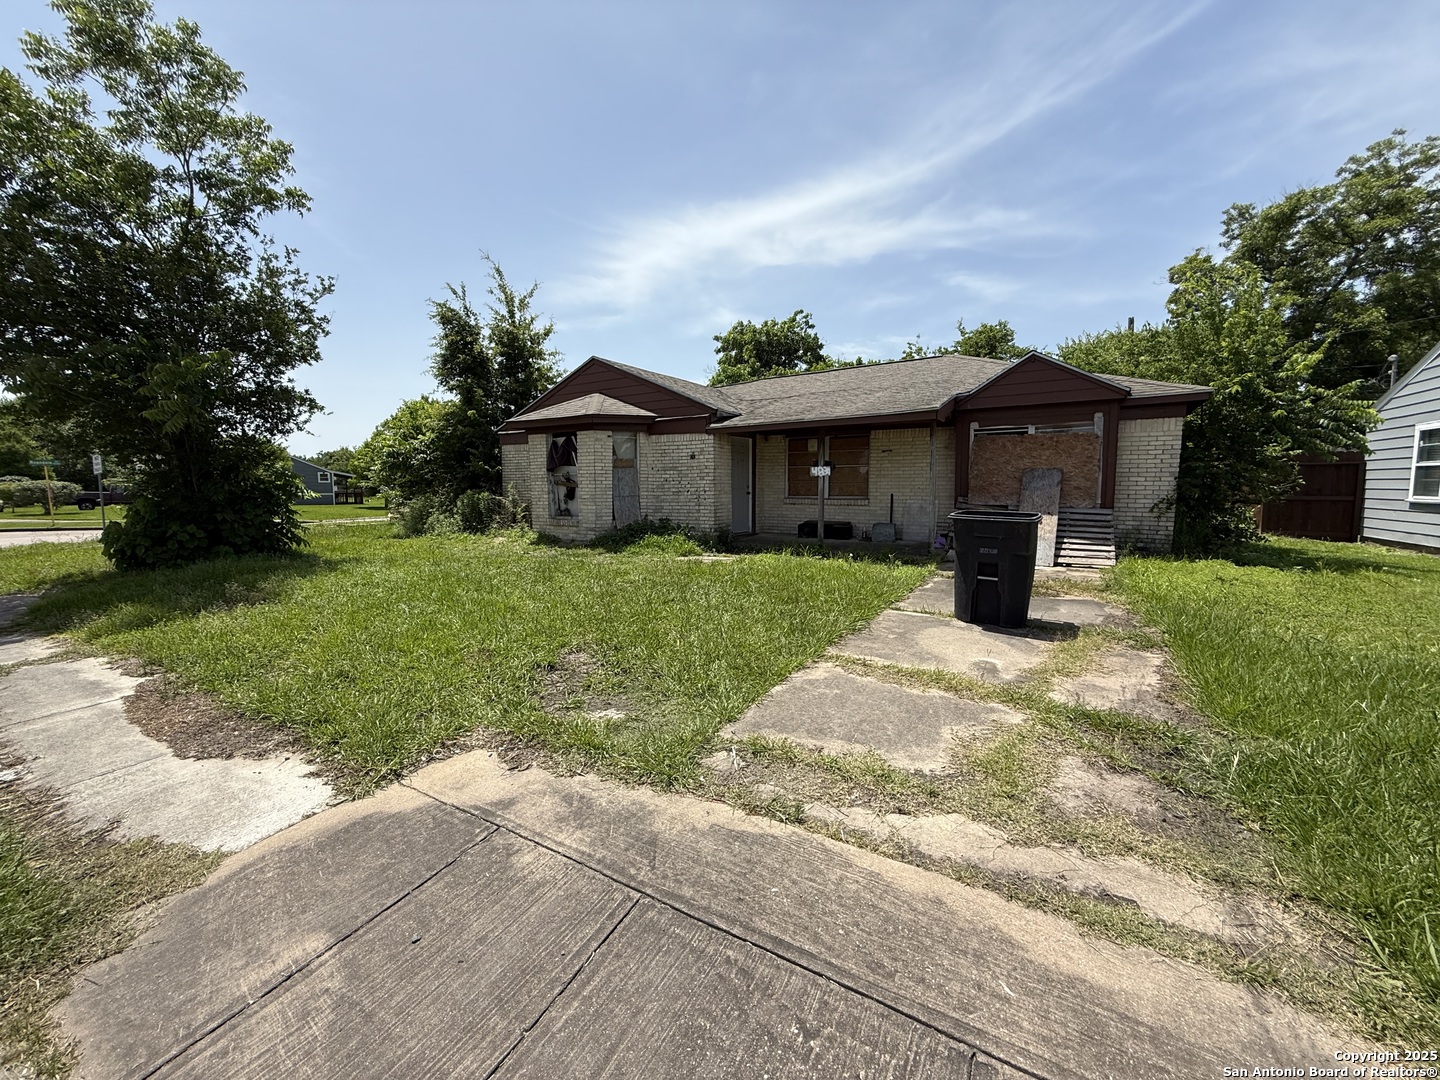
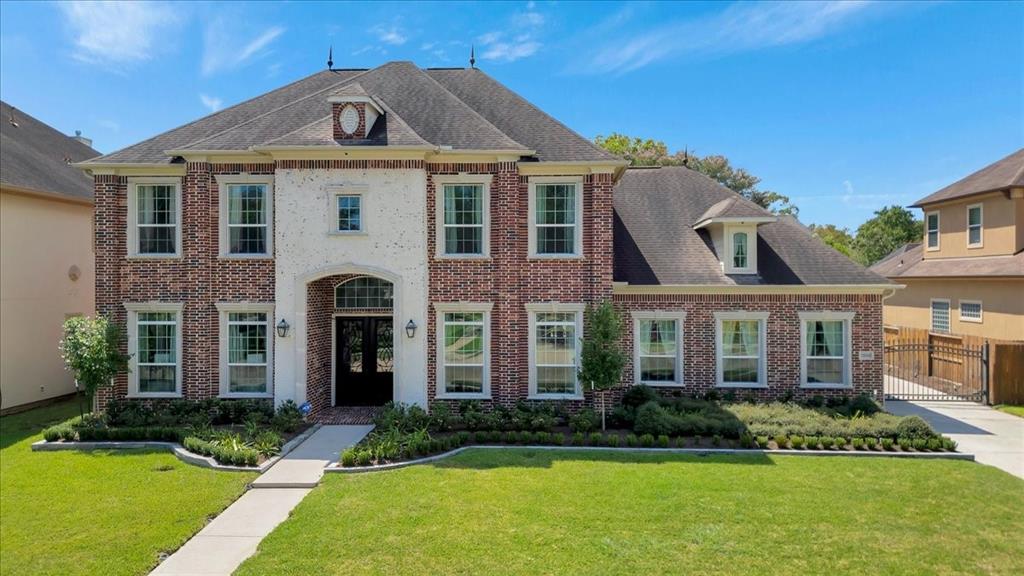
5316 Bell St, Houston, TX 77023
$754
Cash flow
15.8%
Cash-on-Cash Return
9.3%
Cap rate
1.1%
Rent to Value Ratio
Active
$89,000
3
bds
|
2
ba
|
1,737
sqft
|
built
1955
4830 Airport Blvd, Houston, TX 77048
$657
Cash flow
38.5%
Cash-on-Cash Return
14.5%
Cap rate
2.0%
Rent to Value Ratio
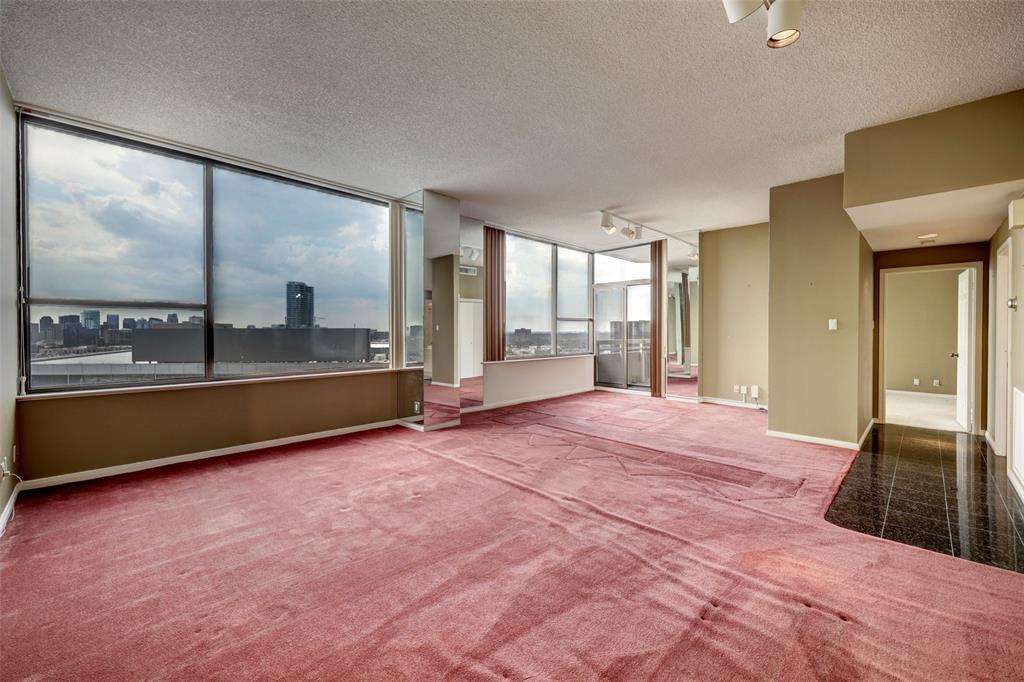
8,587 out of 9,035 properties for sale in Houston, TX
Limited Results Shown
Create a free account, or log in to reveal all property listings and enjoy the complete experience.
Active
$190,000
2
bds
|
3
ba
|
1,728
sqft
|
built
1973
10631 Sandpiper Dr, Houston, TX 77096
$481
Cash flow
13.2%
Cash-on-Cash Return
8.7%
Cap rate
1.1%
Rent to Value Ratio
Active
$220,000
3
bds
|
2
ba
|
1,265
sqft
|
built
2018
13247 Montane Manor Ln, Houston, TX 77044
$-60
Cash flow
-1.4%
Cash-on-Cash Return
5.4%
Cap rate
0.8%
Rent to Value Ratio
Pending
$200,000
3
bds
|
2
ba
|
1,248
sqft
|
built
1963
4031 Curly Oaks Dr, Houston, TX 77053
$12
Cash flow
0.3%
Cash-on-Cash Return
5.7%
Cap rate
0.9%
Rent to Value Ratio
Active
$430,000
3
bds
|
3
ba
|
2,253
sqft
|
built
2002
603 Dinorah Ct, Houston, TX 77094
$-1,058
Cash flow
-12.8%
Cash-on-Cash Return
2.7%
Cap rate
0.5%
Rent to Value Ratio
Active
$89,000
3
bds
|
2
ba
|
1,737
sqft
|
built
1955
4830 Airport Blvd, Houston, TX 77048
$657
Cash flow
38.5%
Cash-on-Cash Return
14.5%
Cap rate
2.0%
Rent to Value Ratio
Pending
$154,999
3
bds
|
2
ba
|
1,850
sqft
|
built
1965
5415 Fairgreen Ln, Houston, TX 77048
$182
Cash flow
6.1%
Cash-on-Cash Return
7.1%
Cap rate
1.2%
Rent to Value Ratio

Active
$695,000
3
bds
|
4
ba
|
2,618
sqft
|
built
2002
4524 Rose St, Houston, TX 77007
$-1,644
Cash flow
-12.3%
Cash-on-Cash Return
2.8%
Cap rate
0.5%
Rent to Value Ratio

Active
$169,900
2
bds
|
2
ba
|
1,282
sqft
|
built
1982
14911 Wunderlich Dr, Houston, TX 77069
$-332
Cash flow
-10.2%
Cash-on-Cash Return
3.3%
Cap rate
0.9%
Rent to Value Ratio
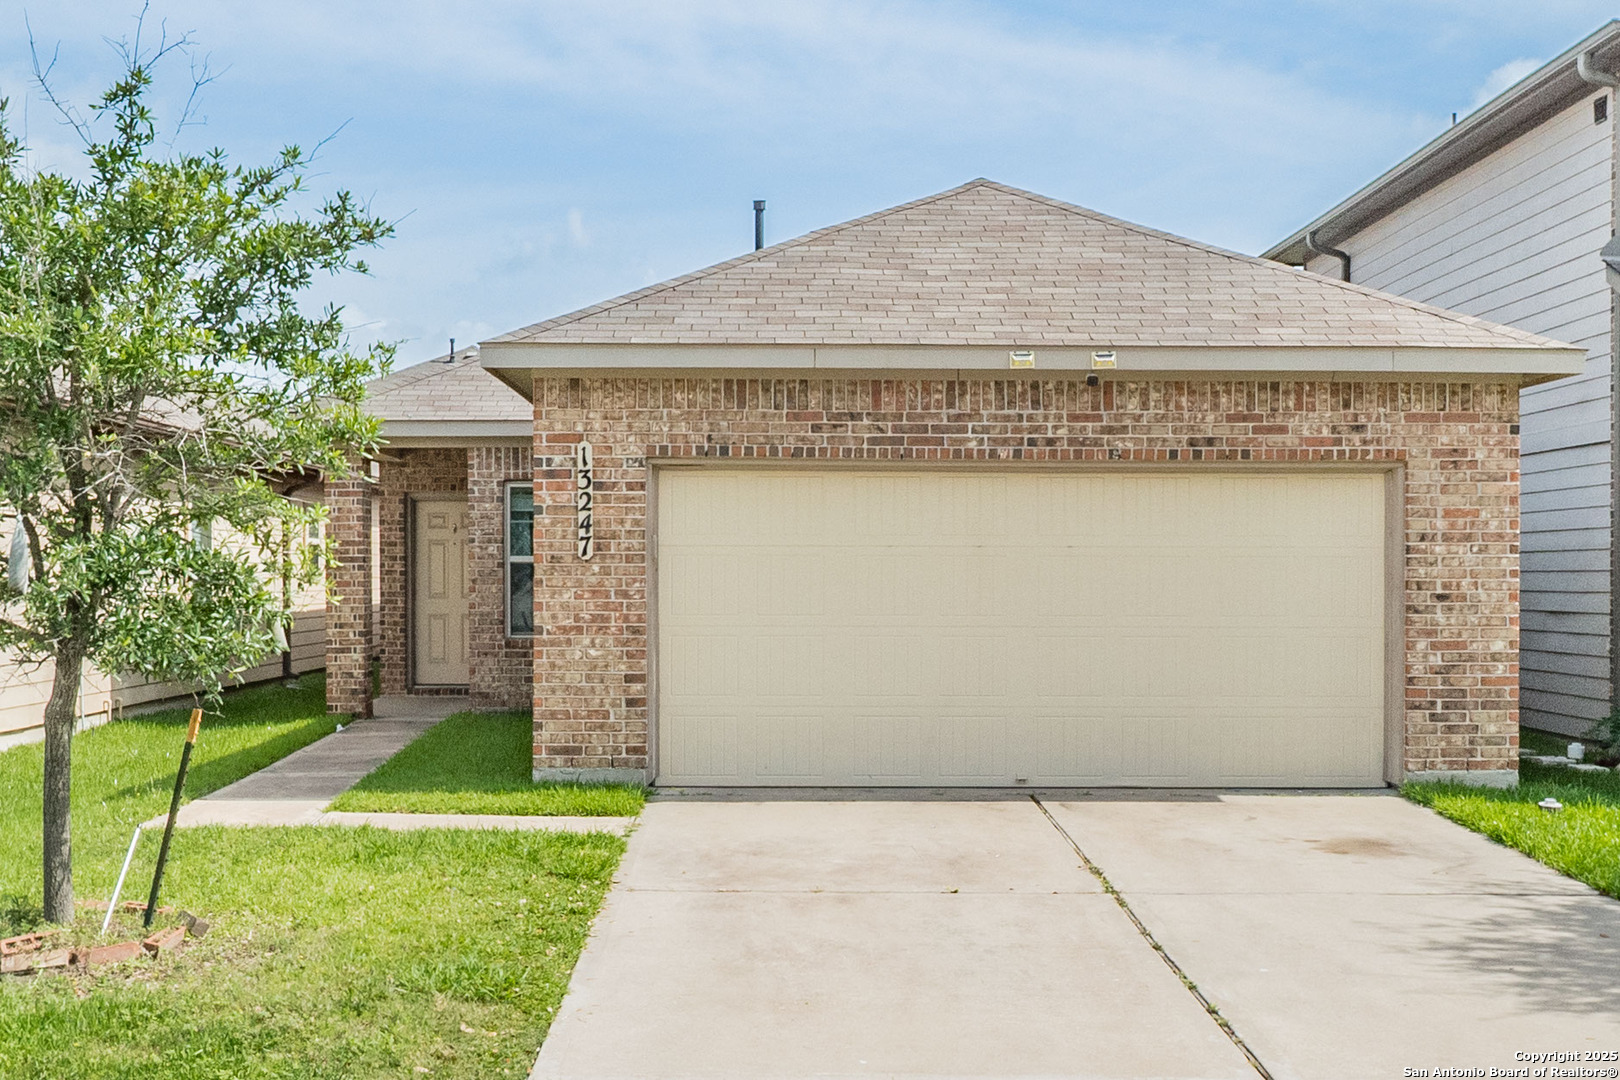
Active
$450,000
5
bds
|
0
ba
|
3,856
sqft
|
built
2003
10007 Caldera Canyon Dr, Houston, TX 77095
$-727
Cash flow
-8.4%
Cash-on-Cash Return
3.7%
Cap rate
0.7%
Rent to Value Ratio
Active
$346,999
3
bds
|
0
ba
|
2,265
sqft
|
built
2004
16707 Vivian Point Ln, Houston, TX 77095
$-739
Cash flow
-11.1%
Cash-on-Cash Return
3.1%
Cap rate
0.7%
Rent to Value Ratio
Active
$244,000
2
bds
|
0
ba
|
1,640
sqft
|
built
1979
2512 Bering Dr, Houston, TX 77057
$-399
Cash flow
-8.5%
Cash-on-Cash Return
3.7%
Cap rate
0.7%
Rent to Value Ratio
Active
$42,000
1
bds
|
0
ba
|
725
sqft
|
built
1972
5625 Antoine Dr, Houston, TX 77091
$34
Cash flow
0.9%
Cash-on-Cash Return
1.0%
Cap rate
2.1%
Rent to Value Ratio
Active
$58,000
2
bds
|
0
ba
|
1,052
sqft
|
built
1972
5625 Antoine Dr, Houston, TX 77091
$266
Cash flow
5.3%
Cash-on-Cash Return
5.5%
Cap rate
2.1%
Rent to Value Ratio
Active
$604,900
4
bds
|
0
ba
|
3,310
sqft
|
built
2012
15811 Crestbrook Dr, Houston, TX 77059
$-1,204
Cash flow
-10.4%
Cash-on-Cash Return
3.3%
Cap rate
0.7%
Rent to Value Ratio
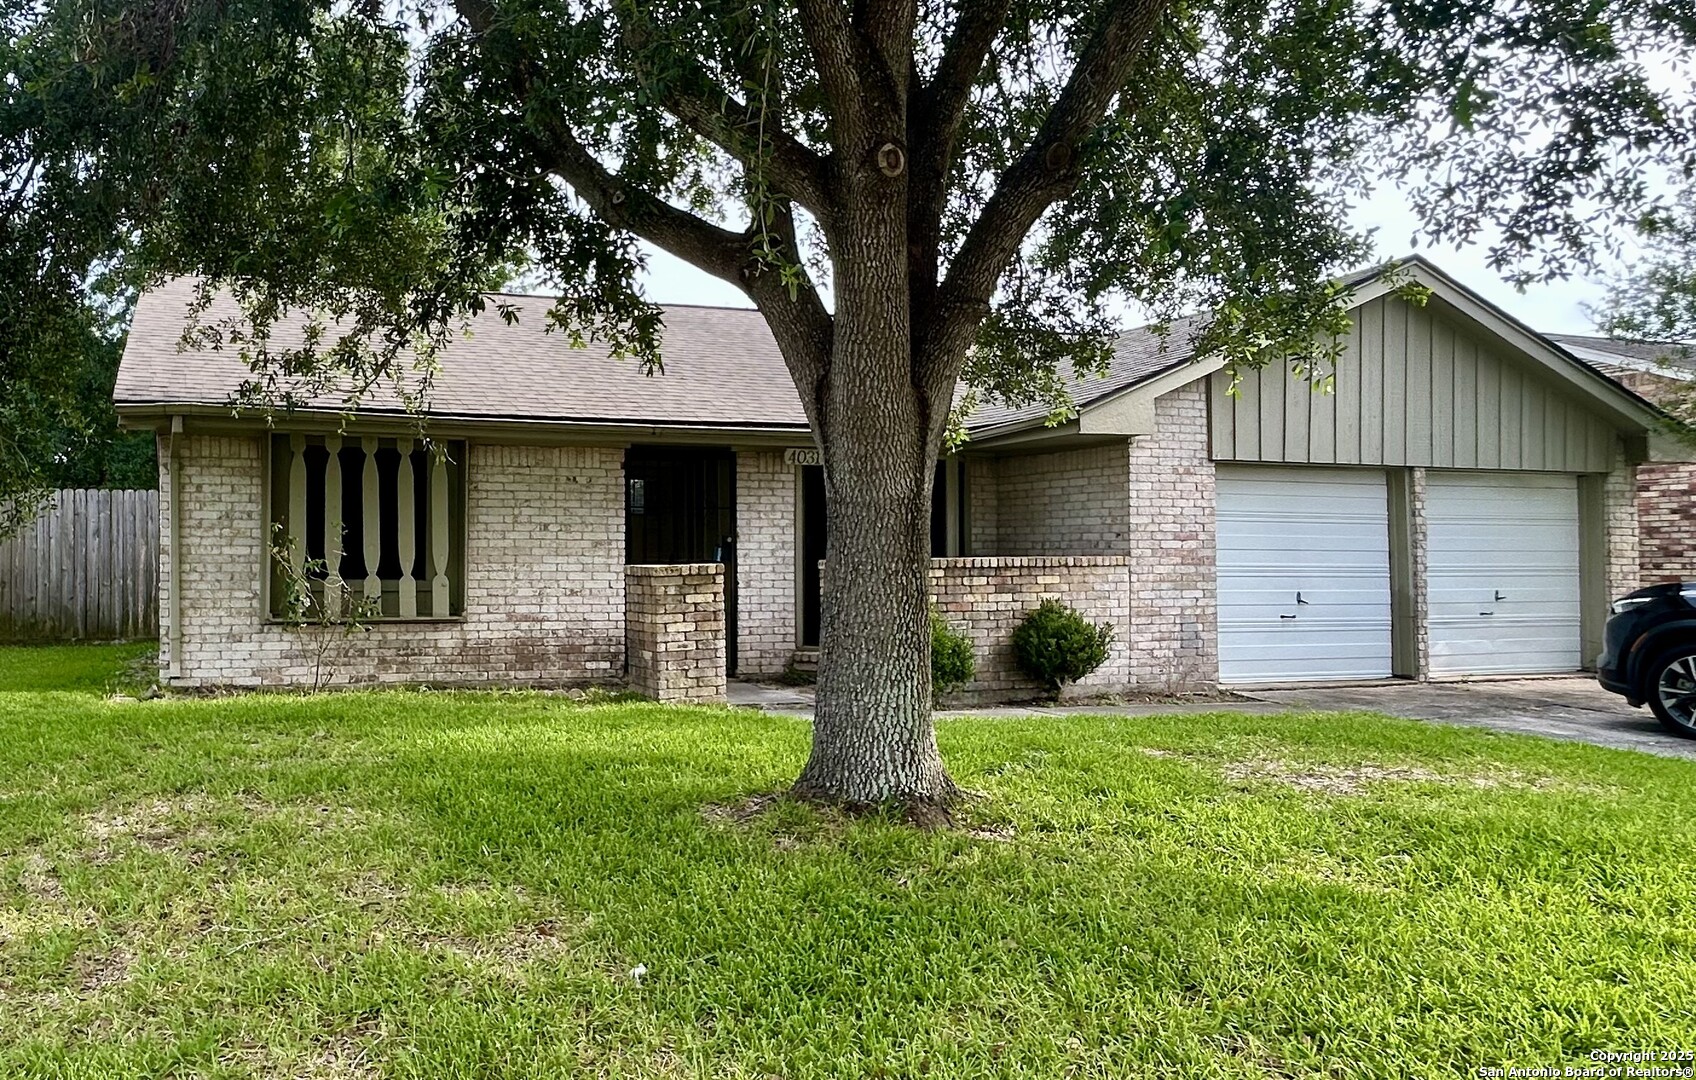
Active
$445,000
3
bds
|
0
ba
|
2,076
sqft
|
built
1959
5466 Beechnut St, Houston, TX 77096
$-577
Cash flow
-6.8%
Cash-on-Cash Return
4.1%
Cap rate
0.7%
Rent to Value Ratio

Active
$79,900
1
bds
|
0
ba
|
744
sqft
|
built
1960
2601 Bellefontaine St, Houston, TX 77025
$-91
Cash flow
-5.9%
Cash-on-Cash Return
4.3%
Cap rate
1.8%
Rent to Value Ratio
Active
$679,000
6
bds
|
0
ba
|
4,155
sqft
|
built
2019
4206 Great Bear Pl, Houston, TX 77084
$-1,559
Cash flow
-12.0%
Cash-on-Cash Return
2.9%
Cap rate
0.6%
Rent to Value Ratio
Active
$120,000
1
bds
|
0
ba
|
660
sqft
|
built
1968
2121 Fountain View Dr, Houston, TX 77057
$-126
Cash flow
-5.5%
Cash-on-Cash Return
4.4%
Cap rate
1.1%
Rent to Value Ratio
Active
$179,000
2
bds
|
0
ba
|
1,415
sqft
|
built
1930
3410 Nagle St, Houston, TX 77004
$-418
Cash flow
-12.2%
Cash-on-Cash Return
2.9%
Cap rate
0.6%
Rent to Value Ratio
Active
$329,900
3
bds
|
0
ba
|
3,000
sqft
|
built
1930
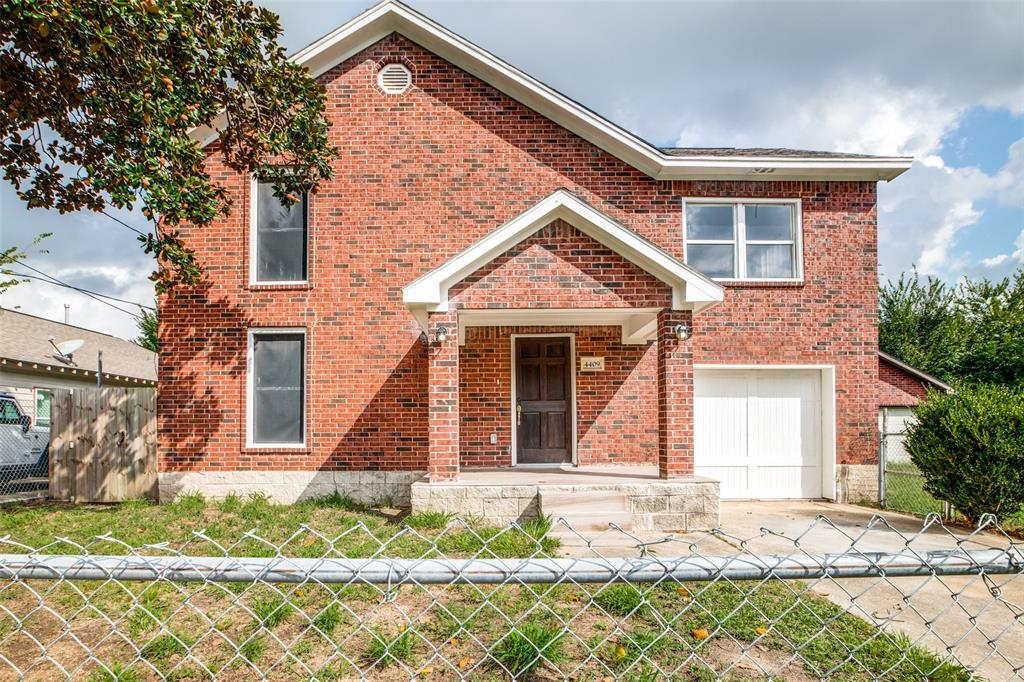
4409 Rawley St, Houston, TX 77020
$-181
Cash flow
-2.9%
Cash-on-Cash Return
5.0%
Cap rate
0.6%
Rent to Value Ratio
Active
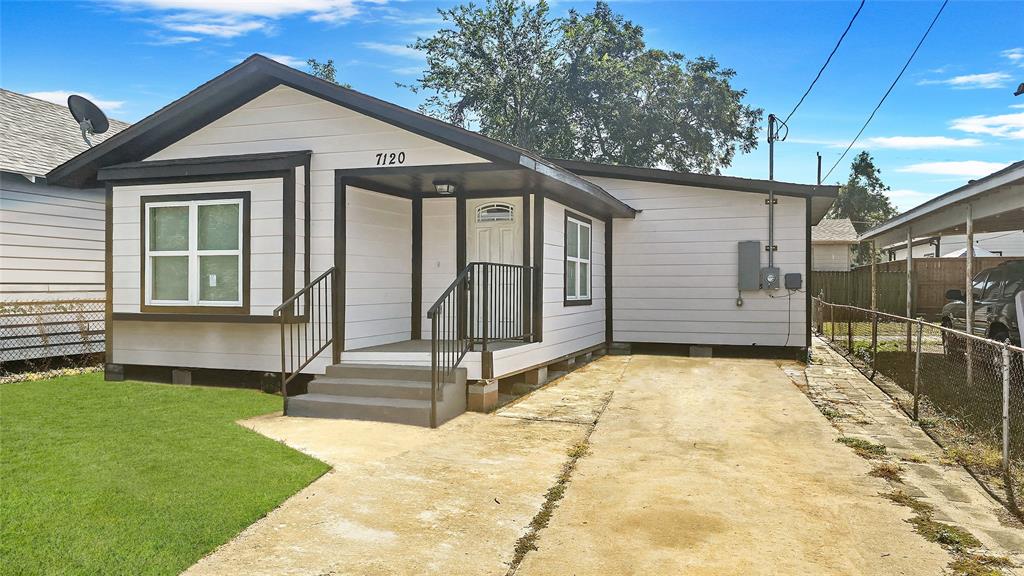
$229,900
3
bds
|
0
ba
|
1,346
sqft
|
built
1935
7120 Avenue O, Houston, TX 77011
$-281
Cash flow
-6.4%
Cash-on-Cash Return
4.2%
Cap rate
0.8%
Rent to Value Ratio
Active
$249,000
2
bds
|
0
ba
|
1,080
sqft
|
built
1930
5316 Bell St, Houston, TX 77023
$754
Cash flow
15.8%
Cash-on-Cash Return
9.3%
Cap rate
1.1%
Rent to Value Ratio
Active
$331,000
4
bds
|
0
ba
|
2,912
sqft
|
built
1980
3334 Woodbriar Dr, Houston, TX 77068
$-828
Cash flow
-13.1%
Cash-on-Cash Return
2.7%
Cap rate
0.5%
Rent to Value Ratio

Active
$194,000
3
bds
|
0
ba
|
1,558
sqft
|
built
1980
11502 Dovedale Ct, Houston, TX 77067
$-248
Cash flow
-6.7%
Cash-on-Cash Return
4.1%
Cap rate
0.8%
Rent to Value Ratio
Active
$91,000
1
bds
|
0
ba
|
746
sqft
|
built
1979
2800 Jeanetta St, Houston, TX 77063
$-169
Cash flow
-9.7%
Cash-on-Cash Return
3.5%
Cap rate
1.1%
Rent to Value Ratio
Active
$349,000
3
bds
|
0
ba
|
1,503
sqft
|
built
1978
1300 Augusta Dr, Houston, TX 77057
$-969
Cash flow
-14.5%
Cash-on-Cash Return
2.3%
Cap rate
0.6%
Rent to Value Ratio
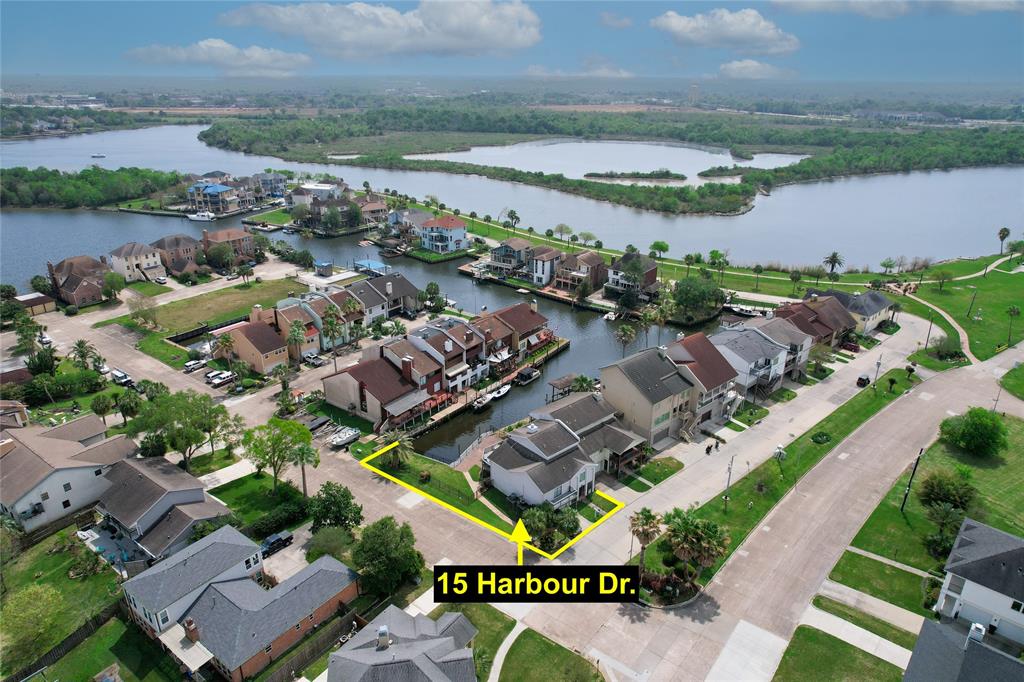
Active
$699,990
3
bds
|
0
ba
|
3,346
sqft
|
built
1981
15 Harbour Dr, Houston, TX 77058
$-1,790
Cash flow
-13.3%
Cash-on-Cash Return
2.6%
Cap rate
0.5%
Rent to Value Ratio
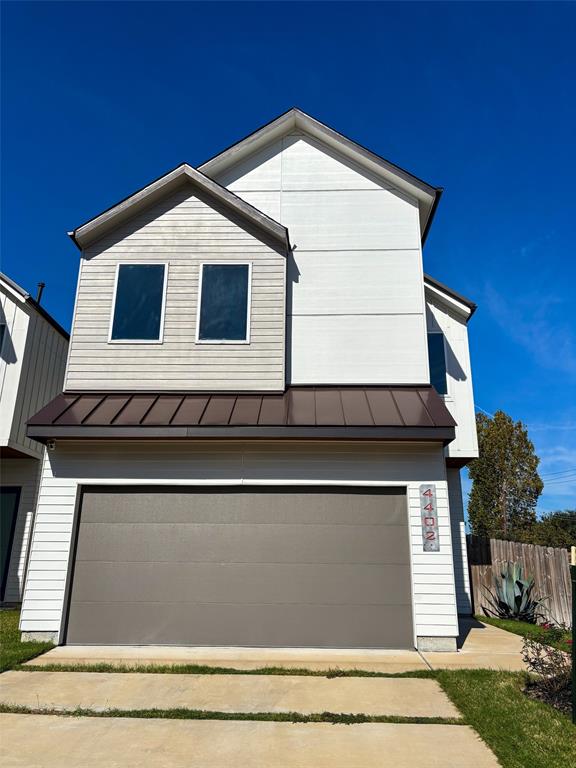
Active
$349,900
3
bds
|
0
ba
|
1,913
sqft
|
built
2021
4402 Bora Bora Ln, Houston, TX 77045
$-699
Cash flow
-10.4%
Cash-on-Cash Return
3.3%
Cap rate
0.7%
Rent to Value Ratio
Active
$268,500
3
bds
|
0
ba
|
1,792
sqft
|
built
1953
10005 Bonazzi St, Houston, TX 77088
$-269
Cash flow
-5.2%
Cash-on-Cash Return
4.5%
Cap rate
0.7%
Rent to Value Ratio
Active
$549,995
3
bds
|
0
ba
|
2,330
sqft
|
built
2021
2207 Silverbonnet St, Houston, TX 77055
$-1,409
Cash flow
-13.4%
Cash-on-Cash Return
2.6%
Cap rate
0.6%
Rent to Value Ratio
Active
$229,000
4
bds
|
0
ba
|
2,173
sqft
|
built
1968
538 Glenvale Dr, Houston, TX 77060
$-128
Cash flow
-2.9%
Cash-on-Cash Return
5.0%
Cap rate
0.8%
Rent to Value Ratio
Active
$410,000
4
bds
|
0
ba
|
2,500
sqft
|
built
2019
13802 Andover Park Dr, Houston, TX 77083
$-1,187
Cash flow
-15.1%
Cash-on-Cash Return
2.2%
Cap rate
0.6%
Rent to Value Ratio
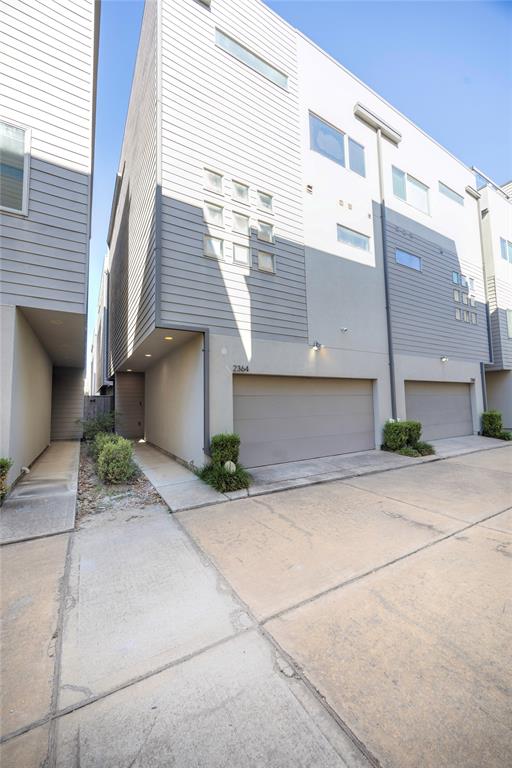
Active
$399,999
3
bds
|
0
ba
|
1,919
sqft
|
built
2014
2364 Commerce St, Houston, TX 77003
$-586
Cash flow
-7.6%
Cash-on-Cash Return
3.9%
Cap rate
0.7%
Rent to Value Ratio
Active
$1,189,000
4
bds
|
0
ba
|
3,972
sqft
|
built
2014
15026 Blossom Bay Dr, Houston, TX 77059
$-2,428
Cash flow
-10.7%
Cash-on-Cash Return
3.2%
Cap rate
0.5%
Rent to Value Ratio
Active
$190,000
3
bds
|
0
ba
|
1,500
sqft
|
built
1977
12525 Wellington Park Dr, Houston, TX 77072
$-222
Cash flow
-6.1%
Cash-on-Cash Return
4.3%
Cap rate
0.9%
Rent to Value Ratio
Active
$110,000
2
bds
|
0
ba
|
1,340
sqft
|
built
1979
12331 W Village Dr, Houston, TX 77039
$183
Cash flow
8.7%
Cash-on-Cash Return
7.7%
Cap rate
1.3%
Rent to Value Ratio
Active
$135,000
1
bds
|
0
ba
|
818
sqft
|
built
1963
2727 Briarhurst Dr, Houston, TX 77057
$-331
Cash flow
-12.8%
Cash-on-Cash Return
2.7%
Cap rate
1.0%
Rent to Value Ratio
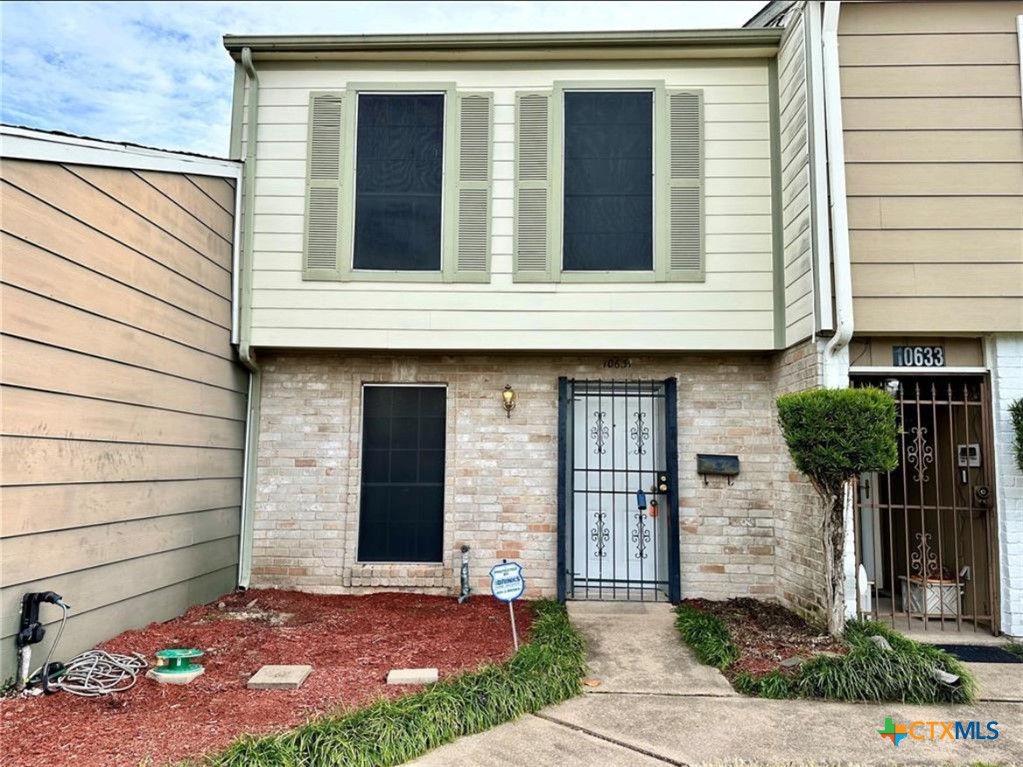
Closed
$194,500
1
bds
|
0
ba
|
1,080
sqft
|
built
1980
14 Greenway Plz, Houston, TX 77046
$158
Cash flow
4.2%
Cash-on-Cash Return
6.7%
Cap rate
1.4%
Rent to Value Ratio
Active
$785,000
2
bds
|
0
ba
|
4,464
sqft
|
built
1930
2501 Truxillo St, Houston, TX 77004
$-2,107
Cash flow
-14.0%
Cash-on-Cash Return
2.5%
Cap rate
0.4%
Rent to Value Ratio
Active
$1,279,000
2
bds
|
0
ba
|
2,834
sqft
|
built
2013
2221 Welch St, Houston, TX 77019
$-4,293
Cash flow
-17.5%
Cash-on-Cash Return
1.7%
Cap rate
0.5%
Rent to Value Ratio