Houston, TX Investment Properties for Sale
Browse homes for sale and investment properties in Houston, TX. Refine your search by price, property type, or more.
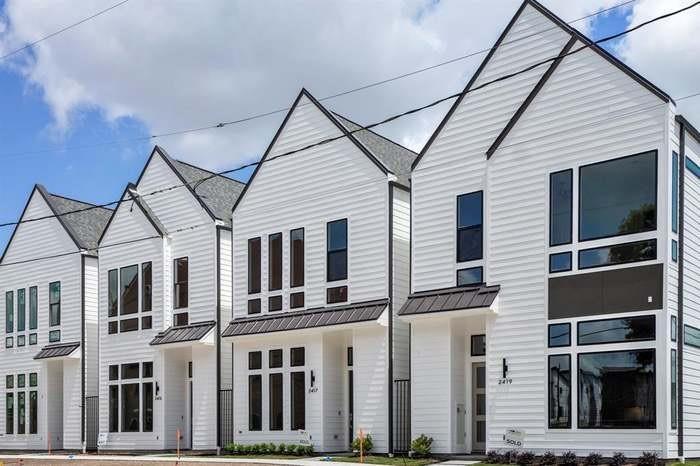
Best cash flowing properties in Houston, TX
Active
$114,900
1
bds
|
0
ba
|
750
sqft
|
built
1980
10555 Turtlewood Ct, Houston, TX 77072
$-274
Cash flow
-12.4%
Cash-on-Cash Return
3.4%
Cap rate
1.0%
Rent to Value Ratio
Active
$165,000
2
bds
|
0
ba
|
1,184
sqft
|
built
1970
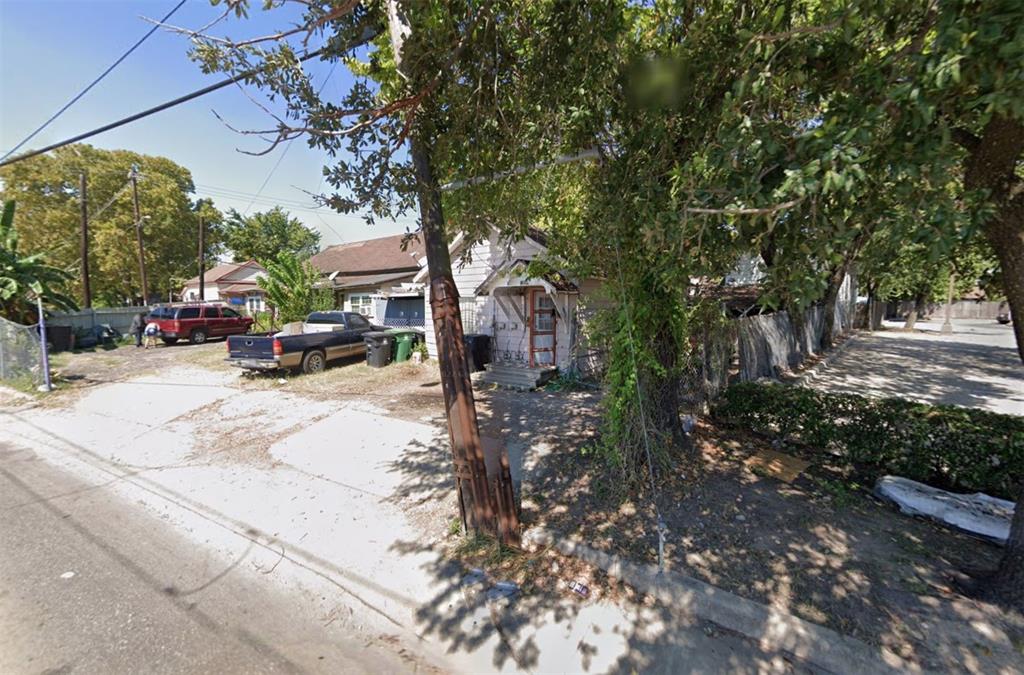
12046 Beechnut St, Houston, TX 77072
$-388
Cash flow
-12.3%
Cash-on-Cash Return
3.5%
Cap rate
0.6%
Rent to Value Ratio
8,547 out of 8,994 properties for sale in Houston, TX
Limited Results Shown
Create a free account, or log in to reveal all property listings and enjoy the complete experience.
Active
$165,000
2
bds
|
0
ba
|
1,184
sqft
|
built
1970
12046 Beechnut St, Houston, TX 77072
$-388
Cash flow
-12.3%
Cash-on-Cash Return
3.5%
Cap rate
0.6%
Rent to Value Ratio
Active
$375,000
4
bds
|
0
ba
|
2,602
sqft
|
built
2001
10210 Squirehill Ct, Houston, TX 77070
$-903
Cash flow
-12.6%
Cash-on-Cash Return
3.4%
Cap rate
0.7%
Rent to Value Ratio
Active
$224,500
3
bds
|
0
ba
|
1,650
sqft
|
built
1976
11330 Sunfish Ln, Houston, TX 77067
$-477
Cash flow
-11.1%
Cash-on-Cash Return
3.7%
Cap rate
0.7%
Rent to Value Ratio
Active
$320,000
3
bds
|
0
ba
|
1,868
sqft
|
built
1982
11738 Fairpoint Dr, Houston, TX 77099
$-682
Cash flow
-11.1%
Cash-on-Cash Return
3.7%
Cap rate
0.6%
Rent to Value Ratio
Active
$114,900
1
bds
|
0
ba
|
750
sqft
|
built
1980
10555 Turtlewood Ct, Houston, TX 77072
$-274
Cash flow
-12.4%
Cash-on-Cash Return
3.4%
Cap rate
1.0%
Rent to Value Ratio
Active
$675,000
3
bds
|
0
ba
|
1,894
sqft
|
built
1953
2227 Hialeah Dr, Houston, TX 77018
$-2,567
Cash flow
-19.8%
Cash-on-Cash Return
1.7%
Cap rate
0.5%
Rent to Value Ratio
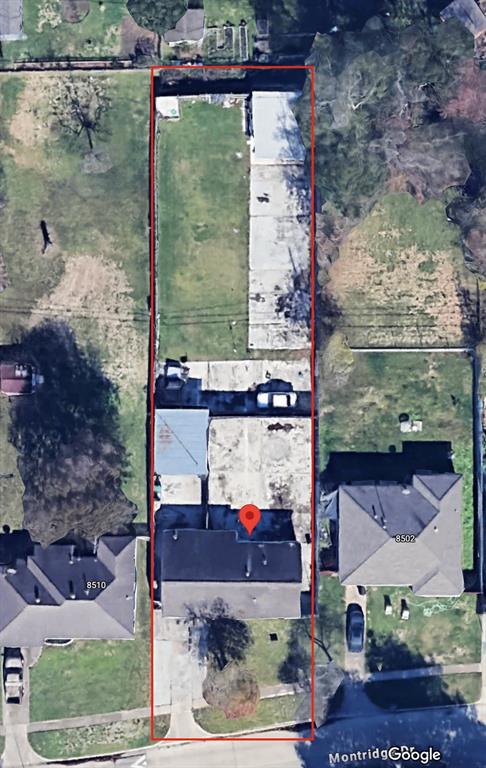
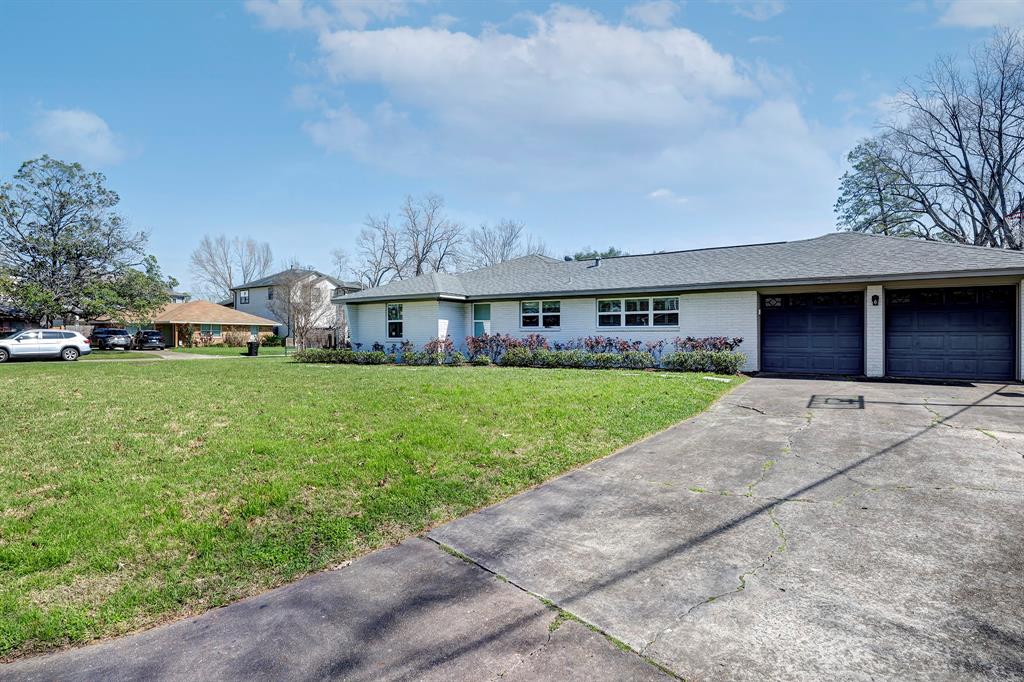
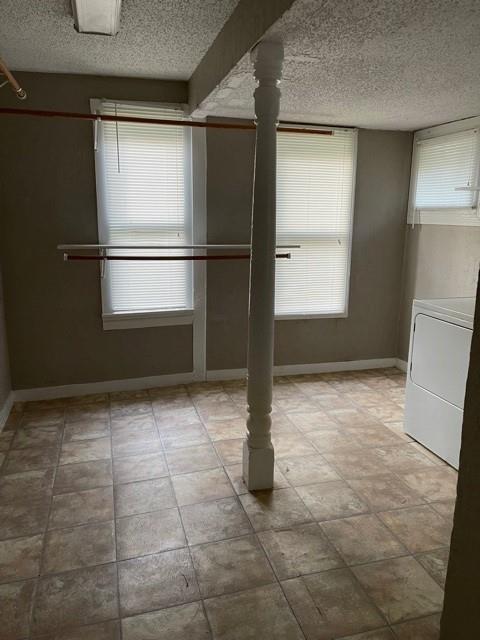
Active
$475,000
2
bds
|
0
ba
|
900
sqft
|
built
1952
8506 Montridge Dr, Houston, TX 77055
$-1,676
Cash flow
-18.4%
Cash-on-Cash Return
2.0%
Cap rate
0.4%
Rent to Value Ratio
Active
$500,000
2
bds
|
0
ba
|
1,019
sqft
|
built
1930
928 W Gardner St, Houston, TX 77009
$-2,712
Cash flow
-28.3%
Cash-on-Cash Return
-0.2%
Cap rate
0.4%
Rent to Value Ratio
Active
$1,250,000
3
bds
|
0
ba
|
3,215
sqft
|
built
2018
911 Thompson St, Houston, TX 77007
$-3,844
Cash flow
-16.0%
Cash-on-Cash Return
2.6%
Cap rate
0.5%
Rent to Value Ratio
Active
$225,000
2
bds
|
0
ba
|
1,996
sqft
|
built
1965
5050 Woodway Dr, Houston, TX 77056
$-1,615
Cash flow
-37.4%
Cash-on-Cash Return
-2.3%
Cap rate
1.1%
Rent to Value Ratio

Active
$295,000
4
bds
|
0
ba
|
1,962
sqft
|
built
1973
10807 Kirkwell Dr, Houston, TX 77089
$-656
Cash flow
-11.6%
Cash-on-Cash Return
3.6%
Cap rate
0.7%
Rent to Value Ratio
Active
$339,900
4
bds
|
0
ba
|
2,724
sqft
|
built
2001
5942 Crestford Park Ln, Houston, TX 77084
$-725
Cash flow
-11.1%
Cash-on-Cash Return
3.7%
Cap rate
0.7%
Rent to Value Ratio
Active
$2,395,000
2
bds
|
0
ba
|
4,848
sqft
|
built
2003
1100 Uptown Park Blvd, Houston, TX 77056
$-16,284
Cash flow
-35.5%
Cash-on-Cash Return
-1.9%
Cap rate
0.3%
Rent to Value Ratio
Active
$1,199,000
4
bds
|
0
ba
|
5,783
sqft
|
built
1997
5906 Southern Hills Dr, Houston, TX 77069
$-3,307
Cash flow
-14.4%
Cash-on-Cash Return
3.0%
Cap rate
0.5%
Rent to Value Ratio
Active
$385,000
3
bds
|
0
ba
|
1,363
sqft
|
built
1940
2406 Charleston St, Houston, TX 77021
$-843
Cash flow
-11.4%
Cash-on-Cash Return
3.7%
Cap rate
0.4%
Rent to Value Ratio
Active
$489,000
3
bds
|
0
ba
|
2,433
sqft
|
built
2007
2640 Couch St, Houston, TX 77008
$-1,296
Cash flow
-13.8%
Cash-on-Cash Return
3.1%
Cap rate
0.6%
Rent to Value Ratio
Active
$499,444
3
bds
|
0
ba
|
2,566
sqft
|
built
2007
2634 Couch St, Houston, TX 77008
$-1,661
Cash flow
-17.4%
Cash-on-Cash Return
2.3%
Cap rate
0.6%
Rent to Value Ratio
Active
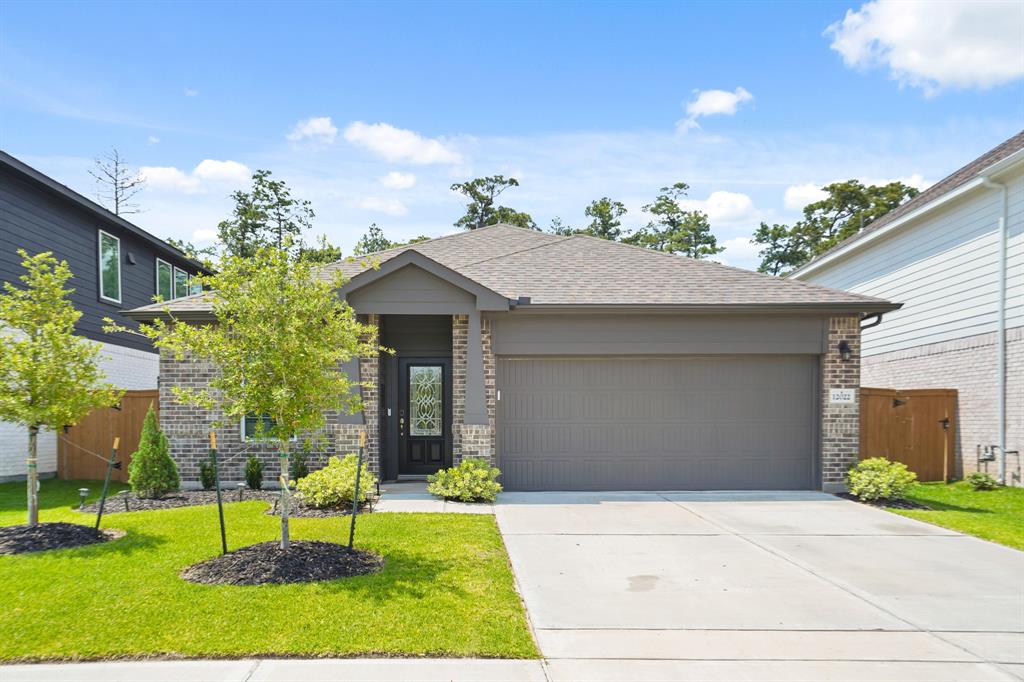
$335,000
4
bds
|
0
ba
|
1,845
sqft
|
built
2023
12022 Fletching Stone Ln, Houston, TX 77044
$-1,191
Cash flow
-18.5%
Cash-on-Cash Return
2.0%
Cap rate
0.7%
Rent to Value Ratio
Active under contract
$550,000
3
bds
|
0
ba
|
2,492
sqft
|
built
2017
1230 W 25th St, Houston, TX 77008
$-1,164
Cash flow
-11.0%
Cash-on-Cash Return
3.7%
Cap rate
0.7%
Rent to Value Ratio
Active
$325,000
4
bds
|
0
ba
|
2,075
sqft
|
built
1929
1007 Boundary St, Houston, TX 77009
$-1,407
Cash flow
-22.6%
Cash-on-Cash Return
1.1%
Cap rate
0.3%
Rent to Value Ratio
Active
$1,250,000
2
bds
|
0
ba
|
2,335
sqft
|
built
1982
121 N Post Oak Ln, Houston, TX 77024
$-3,897
Cash flow
-16.3%
Cash-on-Cash Return
2.5%
Cap rate
0.8%
Rent to Value Ratio
Active
$359,900
3
bds
|
0
ba
|
1,403
sqft
|
built
1949
5500 Evergreen St, Houston, TX 77081
$-874
Cash flow
-12.7%
Cash-on-Cash Return
3.4%
Cap rate
0.6%
Rent to Value Ratio
Active
$875,000
3
bds
|
0
ba
|
1,846
sqft
|
built
1920
3211 Beauchamp St, Houston, TX 77009
$-3,587
Cash flow
-21.4%
Cash-on-Cash Return
1.4%
Cap rate
0.3%
Rent to Value Ratio
Active
$1,249,000
4
bds
|
0
ba
|
3,986
sqft
|
built
2012
5314 Paseo Caceres Dr, Houston, TX 77007
$-3,863
Cash flow
-16.1%
Cash-on-Cash Return
2.6%
Cap rate
0.6%
Rent to Value Ratio
Active
$1,625,000
4
bds
|
0
ba
|
4,058
sqft
|
built
2020
14526 Cindywood Dr, Houston, TX 77079
$-4,559
Cash flow
-14.6%
Cash-on-Cash Return
2.9%
Cap rate
0.6%
Rent to Value Ratio
Active
$620,000
2
bds
|
0
ba
|
1,956
sqft
|
built
1940
606 Enid St, Houston, TX 77009
$-3,112
Cash flow
-26.2%
Cash-on-Cash Return
0.3%
Cap rate
0.2%
Rent to Value Ratio
Active
$424,900
3
bds
|
0
ba
|
2,153
sqft
|
built
1964
8002 Richmond Ave, Houston, TX 77063
$-869
Cash flow
-10.7%
Cash-on-Cash Return
3.8%
Cap rate
0.7%
Rent to Value Ratio
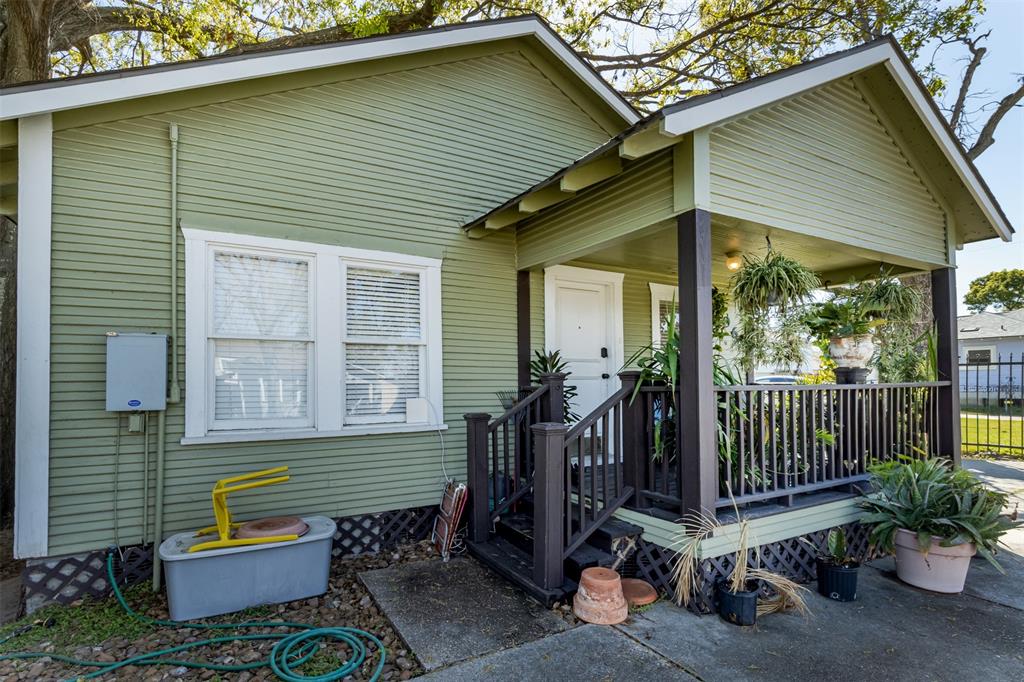
Active
$449,000
3
bds
|
0
ba
|
1,777
sqft
|
built
2020
1608 Chestnut St, Houston, TX 77009
$-1,034
Cash flow
-12.0%
Cash-on-Cash Return
3.5%
Cap rate
0.6%
Rent to Value Ratio
Active
$394,000
2
bds
|
0
ba
|
1,865
sqft
|
built
1983
150 Gessner Rd, Houston, TX 77024
$-2,566
Cash flow
-34.0%
Cash-on-Cash Return
-1.5%
Cap rate
0.8%
Rent to Value Ratio
Active
$425,000
3
bds
|
0
ba
|
1,647
sqft
|
built
2022
2409 Webster St, Houston, TX 77003
$-990
Cash flow
-12.2%
Cash-on-Cash Return
3.5%
Cap rate
0.7%
Rent to Value Ratio
Active
$394,400
4
bds
|
0
ba
|
2,912
sqft
|
built
2016
18539 Windy Knoll Way, Houston, TX 77084
$-911
Cash flow
-12.1%
Cash-on-Cash Return
3.5%
Cap rate
0.7%
Rent to Value Ratio
Active
$495,000
3
bds
|
0
ba
|
2,470
sqft
|
built
1998
5718 Feagan St, Houston, TX 77007
$-1,107
Cash flow
-11.7%
Cash-on-Cash Return
3.6%
Cap rate
0.6%
Rent to Value Ratio
Active
$385,000
4
bds
|
0
ba
|
2,554
sqft
|
built
1972
5206 Lodge Creek Dr, Houston, TX 77066
$-795
Cash flow
-10.8%
Cash-on-Cash Return
3.8%
Cap rate
0.6%
Rent to Value Ratio
Active
$590,000
3
bds
|
0
ba
|
2,283
sqft
|
built
2022
2520 Ohsfeldt St, Houston, TX 77008
$-1,337
Cash flow
-11.8%
Cash-on-Cash Return
3.6%
Cap rate
0.7%
Rent to Value Ratio
Active
$849,500
4
bds
|
0
ba
|
4,606
sqft
|
built
2001
1308 Dart St, Houston, TX 77007
$-1,661
Cash flow
-10.2%
Cash-on-Cash Return
3.9%
Cap rate
0.7%
Rent to Value Ratio
Active
$400,000
4
bds
|
0
ba
|
3,097
sqft
|
built
1993
6923 Queensclub Dr, Houston, TX 77069
$-956
Cash flow
-12.5%
Cash-on-Cash Return
3.4%
Cap rate
0.7%
Rent to Value Ratio
Active
$1,450,000
4
bds
|
0
ba
|
2,757
sqft
|
built
1955
11902 Dover St, Houston, TX 77031
$-6,413
Cash flow
-23.1%
Cash-on-Cash Return
1.0%
Cap rate
0.2%
Rent to Value Ratio
Active
$1,299,000
3
bds
|
0
ba
|
2,480
sqft
|
built
1962
1622 Haverhill Dr, Houston, TX 77008
$-3,962
Cash flow
-15.9%
Cash-on-Cash Return
2.6%
Cap rate
0.5%
Rent to Value Ratio
Active
$345,000
4
bds
|
0
ba
|
1,550
sqft
|
built
1938
3229 Holman St, Houston, TX 77004
$-1,777
Cash flow
-26.9%
Cash-on-Cash Return
0.1%
Cap rate
0.2%
Rent to Value Ratio
Active
$405,000
4
bds
|
0
ba
|
2,757
sqft
|
built
1992
13819 Marbledale Ct, Houston, TX 77059
$-872
Cash flow
-11.2%
Cash-on-Cash Return
3.7%
Cap rate
0.7%
Rent to Value Ratio