Houston, TX Investment Properties for Sale
Browse homes for sale and investment properties in Houston, TX. Refine your search by price, property type, or more.
Best cash flowing properties in Houston, TX
Active under contract
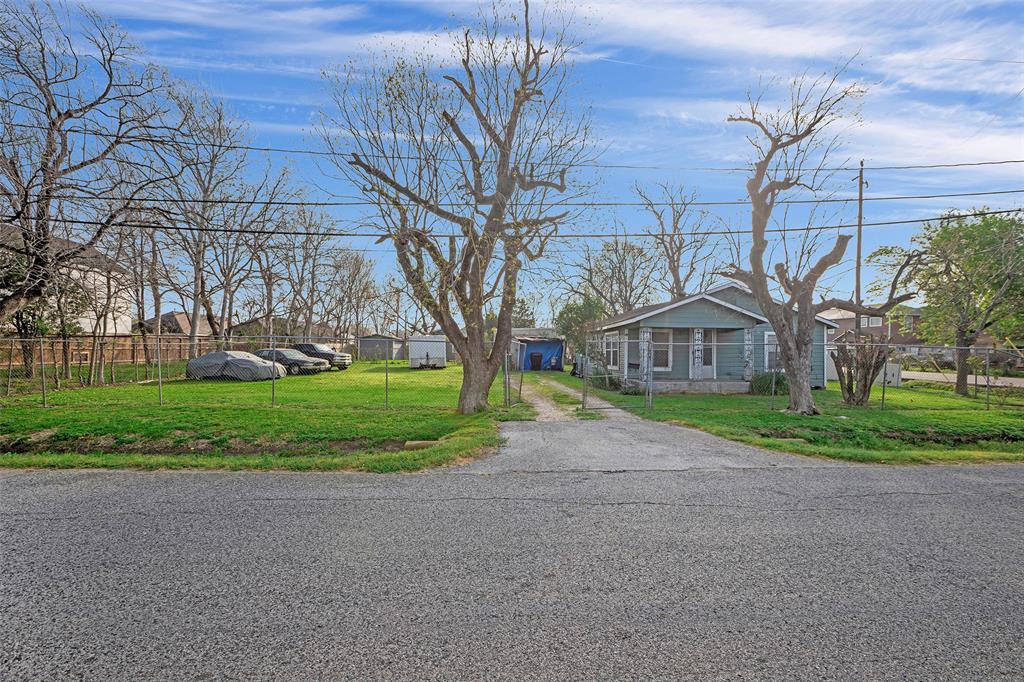
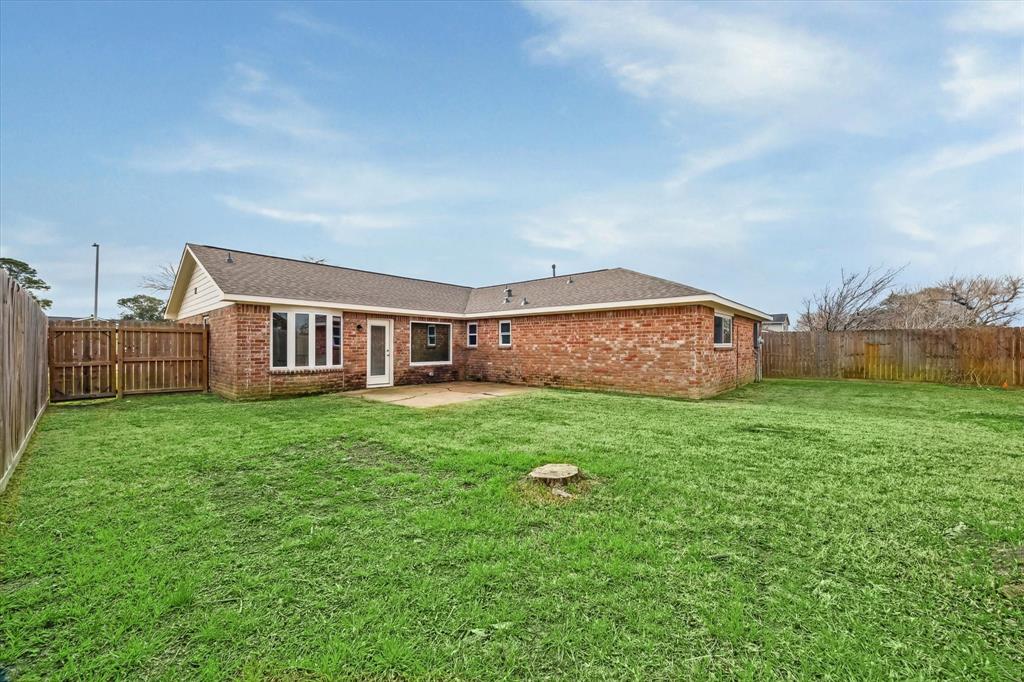
$170,000
2
bds
|
0
ba
|
957
sqft
|
built
1950
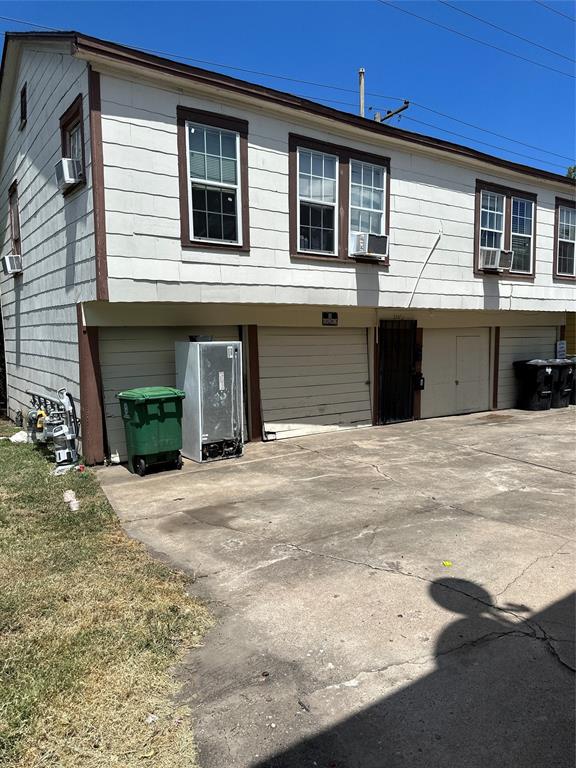
8137 Canyon St, Houston, TX 77051
$105
Cash flow
3.2%
Cash-on-Cash Return
6.4%
Cap rate
0.9%
Rent to Value Ratio
Active
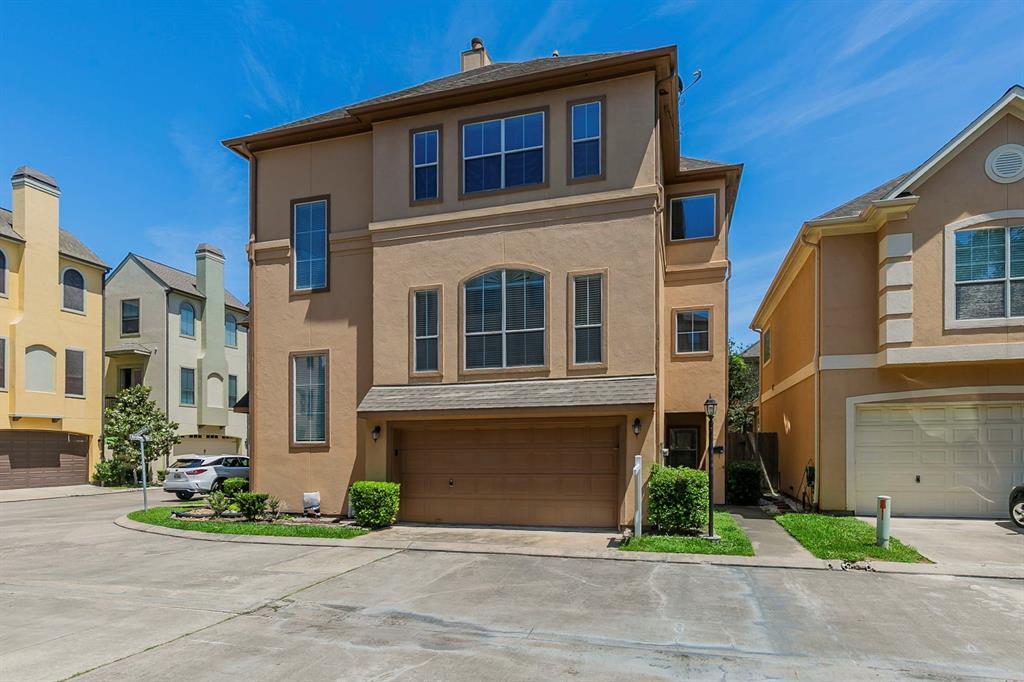
$550,000
3
bds
|
0
ba
|
2,550
sqft
|
built
2021
1005 E 28th St, Houston, TX 77009
$-112
Cash flow
-1.1%
Cash-on-Cash Return
5.4%
Cap rate
0.7%
Rent to Value Ratio
8,515 out of 8,960 properties for sale in Houston, TX
Limited Results Shown
Create a free account, or log in to reveal all property listings and enjoy the complete experience.
Active
$408,000
3
bds
|
0
ba
|
2,064
sqft
|
built
1955
3906 Blalock Rd, Houston, TX 77080
$-1,049
Cash flow
-13.4%
Cash-on-Cash Return
2.6%
Cap rate
0.6%
Rent to Value Ratio
Active
$460,000
3
bds
|
0
ba
|
2,384
sqft
|
built
2007
2540 Prospect St, Houston, TX 77004
$-1,285
Cash flow
-14.6%
Cash-on-Cash Return
2.3%
Cap rate
0.6%
Rent to Value Ratio
Active
$264,990
3
bds
|
0
ba
|
1,519
sqft
|
built
2001
10207 Revelstoke Dr, Houston, TX 77086
$-304
Cash flow
-6.0%
Cash-on-Cash Return
4.3%
Cap rate
0.8%
Rent to Value Ratio
Active
$695,000
3
bds
|
0
ba
|
1,717
sqft
|
built
1930
1720 W Main St, Houston, TX 77098
$-2,090
Cash flow
-15.7%
Cash-on-Cash Return
2.1%
Cap rate
0.5%
Rent to Value Ratio
Active
$999,000
2
bds
|
0
ba
|
1,032
sqft
|
built
1930
5403 Breen Dr, Houston, TX 77086
$-4,821
Cash flow
-25.2%
Cash-on-Cash Return
-0.1%
Cap rate
0.2%
Rent to Value Ratio
Active
$375,000
3
bds
|
0
ba
|
2,898
sqft
|
built
2007
16407 Jadestone Terrace Ln, Houston, TX 77044
$-569
Cash flow
-7.9%
Cash-on-Cash Return
3.9%
Cap rate
0.7%
Rent to Value Ratio
Active
$229,799
4
bds
|
0
ba
|
2,054
sqft
|
built
1971
11042 Lafferty Oaks St, Houston, TX 77013
$-231
Cash flow
-5.2%
Cash-on-Cash Return
4.5%
Cap rate
0.8%
Rent to Value Ratio
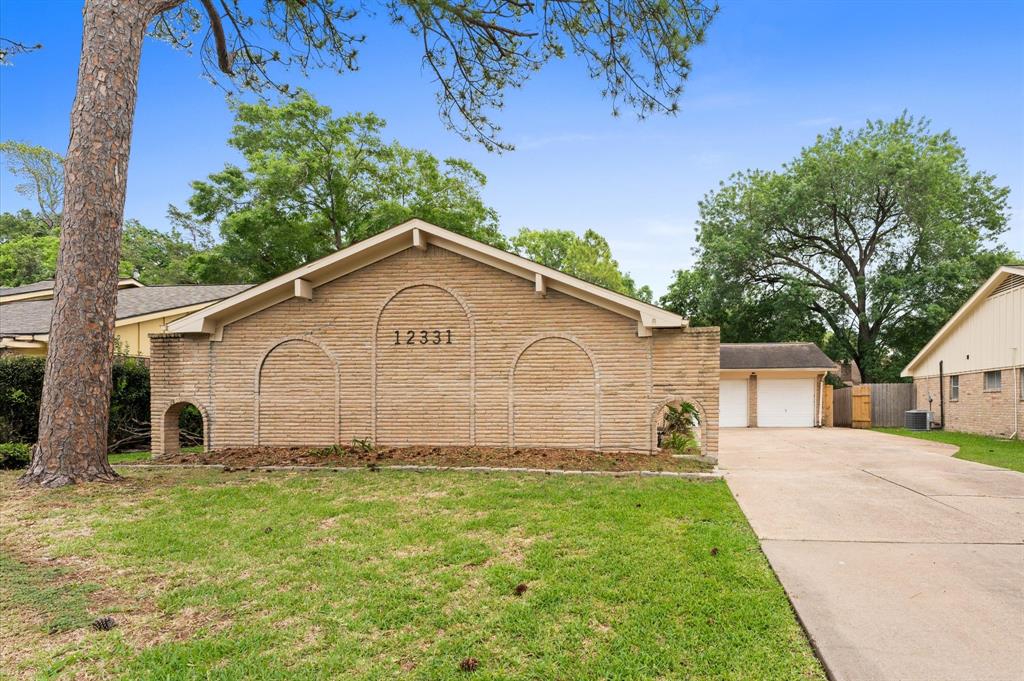
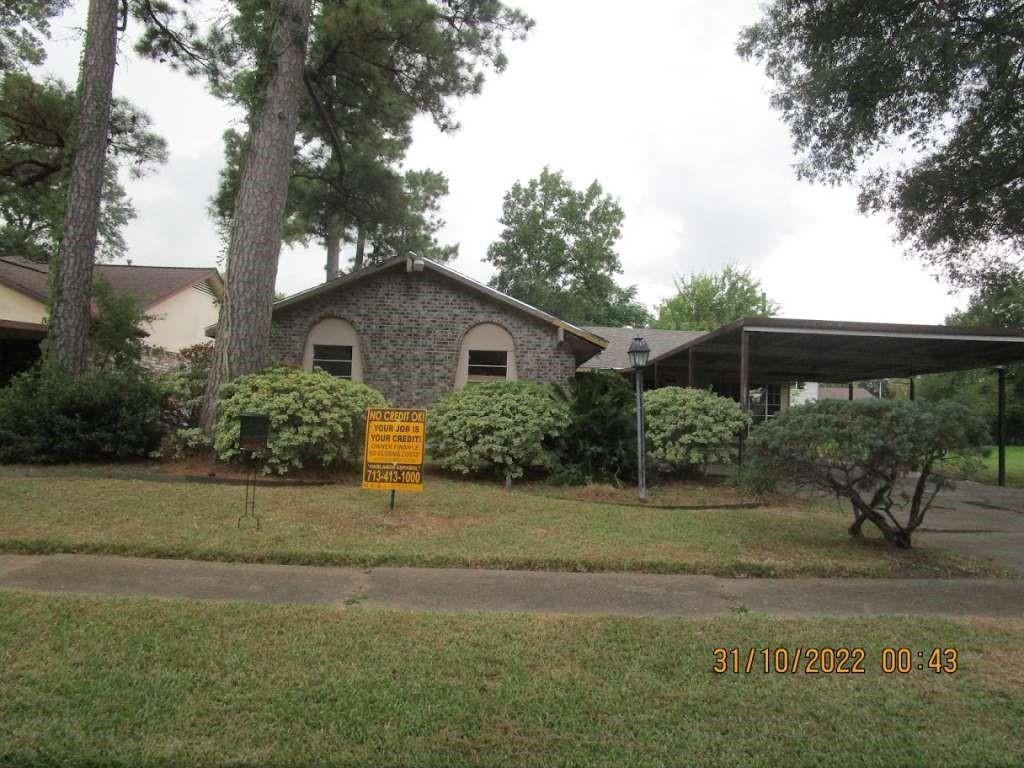
Active
$319,900
4
bds
|
0
ba
|
1,752
sqft
|
built
1969
12331 Wedgehill Ln, Houston, TX 77077
$-626
Cash flow
-10.2%
Cash-on-Cash Return
3.3%
Cap rate
0.7%
Rent to Value Ratio
Active
$399,000
3
bds
|
0
ba
|
2,002
sqft
|
built
2021
1720 Summerlyn Terrace Dr, Houston, TX 77080
$-953
Cash flow
-12.5%
Cash-on-Cash Return
2.8%
Cap rate
0.7%
Rent to Value Ratio
Active
$449,000
3
bds
|
0
ba
|
1,873
sqft
|
built
1950
3401 Robertson St, Houston, TX 77009
$-1,195
Cash flow
-13.9%
Cash-on-Cash Return
2.5%
Cap rate
0.5%
Rent to Value Ratio
Active
$575,000
1
bds
|
0
ba
|
2,604
sqft
|
built
1955
2711 Ruth St, Houston, TX 77004
$-1,755
Cash flow
-15.9%
Cash-on-Cash Return
2.0%
Cap rate
0.2%
Rent to Value Ratio
Active
$1,195,000
4
bds
|
0
ba
|
3,781
sqft
|
built
2020
7213 Tickner St, Houston, TX 77055
$-1,957
Cash flow
-8.5%
Cash-on-Cash Return
3.7%
Cap rate
0.7%
Rent to Value Ratio
Active
$700,000
5
bds
|
0
ba
|
5,248
sqft
|
built
1954
4314 Reed Rd, Houston, TX 77051
$-2,220
Cash flow
-16.5%
Cash-on-Cash Return
1.9%
Cap rate
0.4%
Rent to Value Ratio

Active
$2,595,000
7
bds
|
0
ba
|
6,384
sqft
|
built
1960
11730 Denise Dr, Houston, TX 77024
$-7,243
Cash flow
-14.6%
Cash-on-Cash Return
2.3%
Cap rate
0.3%
Rent to Value Ratio
Active
$179,999
2
bds
|
0
ba
|
993
sqft
|
built
1938
7615 Avenue F, Houston, TX 77012
$-272
Cash flow
-7.9%
Cash-on-Cash Return
3.9%
Cap rate
0.6%
Rent to Value Ratio

Active
$285,000
3
bds
|
0
ba
|
2,048
sqft
|
built
1980
14714 Windlea Ln, Houston, TX 77040
$-366
Cash flow
-6.7%
Cash-on-Cash Return
4.1%
Cap rate
0.8%
Rent to Value Ratio
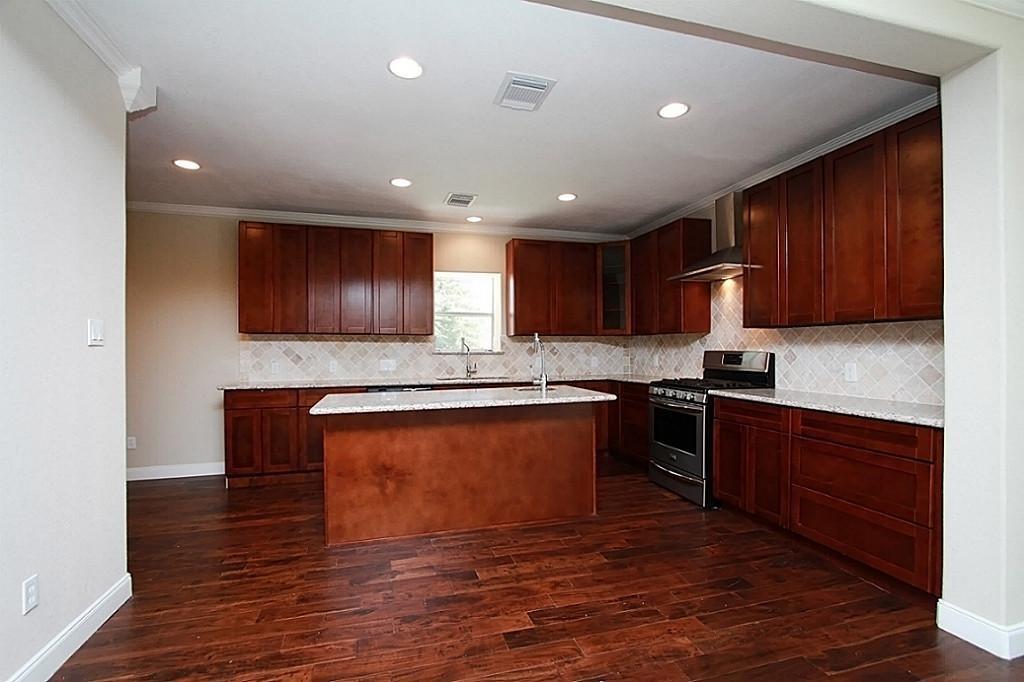
Active
$360,000
3
bds
|
0
ba
|
2,262
sqft
|
built
2005
1417 Live Oak St, Houston, TX 77003
$-562
Cash flow
-8.1%
Cash-on-Cash Return
3.8%
Cap rate
0.8%
Rent to Value Ratio
Active
$427,000
3
bds
|
0
ba
|
2,448
sqft
|
built
1930
2619 Prospect St, Houston, TX 77004
$-766
Cash flow
-9.4%
Cash-on-Cash Return
3.5%
Cap rate
0.7%
Rent to Value Ratio
Active
$350,000
4
bds
|
0
ba
|
1,730
sqft
|
built
1969
12334 Brandywyne Dr, Houston, TX 77077
$-817
Cash flow
-12.2%
Cash-on-Cash Return
2.9%
Cap rate
0.6%
Rent to Value Ratio
Active
$299,000
2
bds
|
0
ba
|
936
sqft
|
built
1949
1630 Stonecrest Dr, Houston, TX 77018
$-843
Cash flow
-14.7%
Cash-on-Cash Return
2.3%
Cap rate
0.5%
Rent to Value Ratio
Active
$535,000
4
bds
|
0
ba
|
2,393
sqft
|
built
1968
10014 Moorberry Ln, Houston, TX 77080
$-734
Cash flow
-7.2%
Cash-on-Cash Return
4.0%
Cap rate
0.7%
Rent to Value Ratio
Active
$415,000
3
bds
|
0
ba
|
1,825
sqft
|
built
1960
5471 Birdwood Rd, Houston, TX 77096
$-946
Cash flow
-11.9%
Cash-on-Cash Return
2.9%
Cap rate
0.6%
Rent to Value Ratio
Active
$550,000
3
bds
|
0
ba
|
2,313
sqft
|
built
1976
3022 Triway Ln, Houston, TX 77043
$-1,135
Cash flow
-10.8%
Cash-on-Cash Return
3.2%
Cap rate
0.7%
Rent to Value Ratio
Active under contract
$530,000
3
bds
|
0
ba
|
2,408
sqft
|
built
1995
1948 Welch St, Houston, TX 77019
$-911
Cash flow
-9.0%
Cash-on-Cash Return
3.6%
Cap rate
0.7%
Rent to Value Ratio
Active
$405,000
3
bds
|
0
ba
|
2,870
sqft
|
built
2004
9907 Adeline Ln, Houston, TX 77054
$-827
Cash flow
-10.7%
Cash-on-Cash Return
3.2%
Cap rate
0.7%
Rent to Value Ratio
Active
$569,900
3
bds
|
0
ba
|
2,128
sqft
|
built
1952
3515 Norris Dr, Houston, TX 77025
$-1,147
Cash flow
-10.5%
Cash-on-Cash Return
3.3%
Cap rate
0.5%
Rent to Value Ratio
Active
$599,000
3
bds
|
0
ba
|
2,621
sqft
|
built
1995
13826 Aspen Cove Dr, Houston, TX 77077
$-1,687
Cash flow
-14.7%
Cash-on-Cash Return
2.3%
Cap rate
0.5%
Rent to Value Ratio
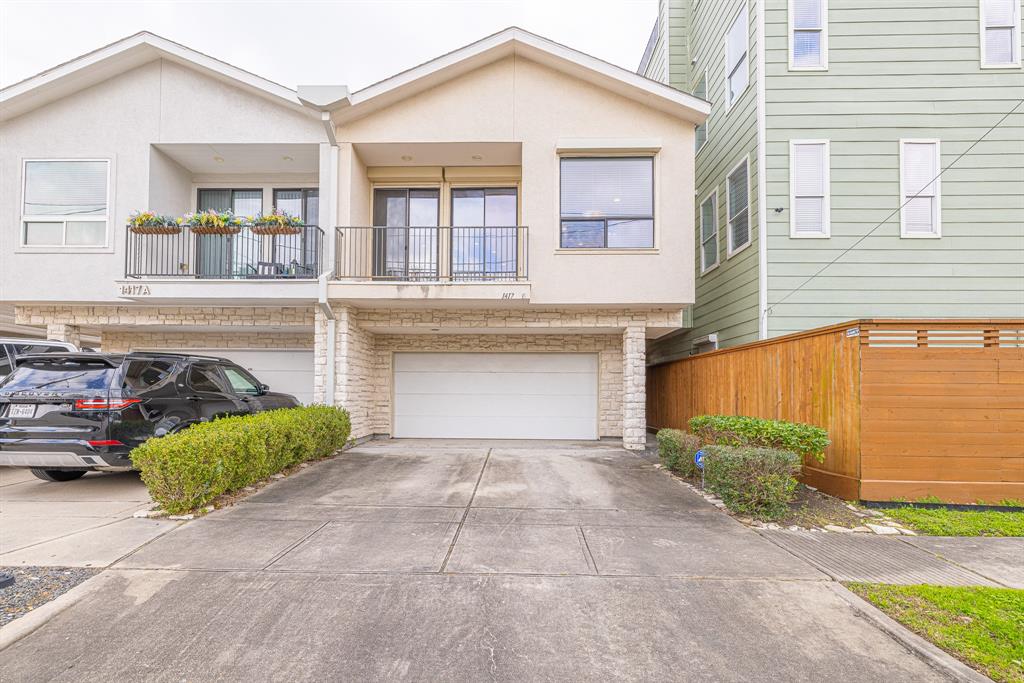
Active
$550,000
3
bds
|
0
ba
|
2,550
sqft
|
built
2021
1005 E 28th St, Houston, TX 77009
$-112
Cash flow
-1.1%
Cash-on-Cash Return
5.4%
Cap rate
0.7%
Rent to Value Ratio
Active
$495,000
3
bds
|
0
ba
|
2,272
sqft
|
built
1992
1315 Crescent Parkway Ct, Houston, TX 77094
$-457
Cash flow
-4.8%
Cash-on-Cash Return
4.6%
Cap rate
0.6%
Rent to Value Ratio

Active
$320,000
4
bds
|
0
ba
|
2,595
sqft
|
built
2022
12518 Pelican Bay Dr, Houston, TX 77038
$-530
Cash flow
-8.6%
Cash-on-Cash Return
3.7%
Cap rate
0.8%
Rent to Value Ratio
Active
$302,500
3
bds
|
0
ba
|
1,674
sqft
|
built
1970
10603 Kirkshire Dr, Houston, TX 77089
$-209
Cash flow
-3.6%
Cash-on-Cash Return
4.9%
Cap rate
0.8%
Rent to Value Ratio

Active
$235,000
3
bds
|
0
ba
|
1,156
sqft
|
built
1950
4118 Gano St, Houston, TX 77009
$-540
Cash flow
-12.0%
Cash-on-Cash Return
2.9%
Cap rate
0.6%
Rent to Value Ratio
Active
$159,000
2
bds
|
0
ba
|
1,204
sqft
|
built
1984
8888 Benning Dr, Houston, TX 77031
$-275
Cash flow
-9.0%
Cash-on-Cash Return
3.6%
Cap rate
1.0%
Rent to Value Ratio
Active
$335,000
2
bds
|
0
ba
|
1,365
sqft
|
built
2022
753 N Emile St, Houston, TX 77020
$-310
Cash flow
-4.8%
Cash-on-Cash Return
4.6%
Cap rate
0.8%
Rent to Value Ratio
Active under contract
$170,000
2
bds
|
0
ba
|
957
sqft
|
built
1950
8137 Canyon St, Houston, TX 77051
$105
Cash flow
3.2%
Cash-on-Cash Return
6.4%
Cap rate
0.9%
Rent to Value Ratio
Active under contract
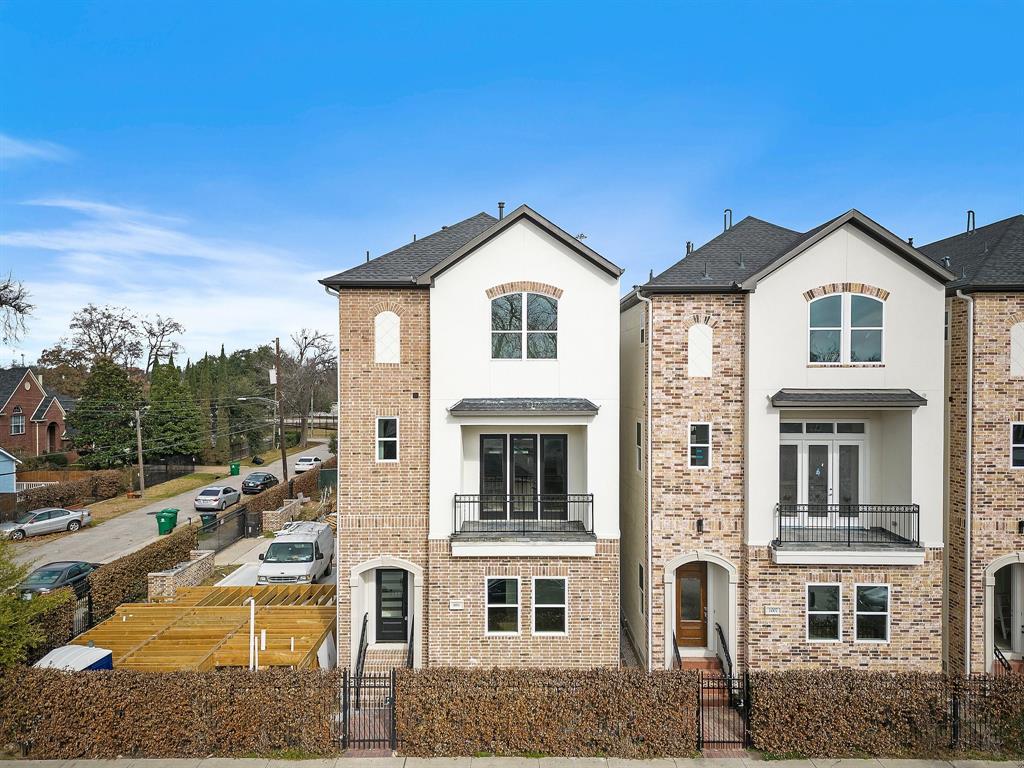
$287,000
2
bds
|
0
ba
|
1,006
sqft
|
built
1993
3231 Allen Pkwy, Houston, TX 77019
$-863
Cash flow
-15.7%
Cash-on-Cash Return
2.1%
Cap rate
0.8%
Rent to Value Ratio
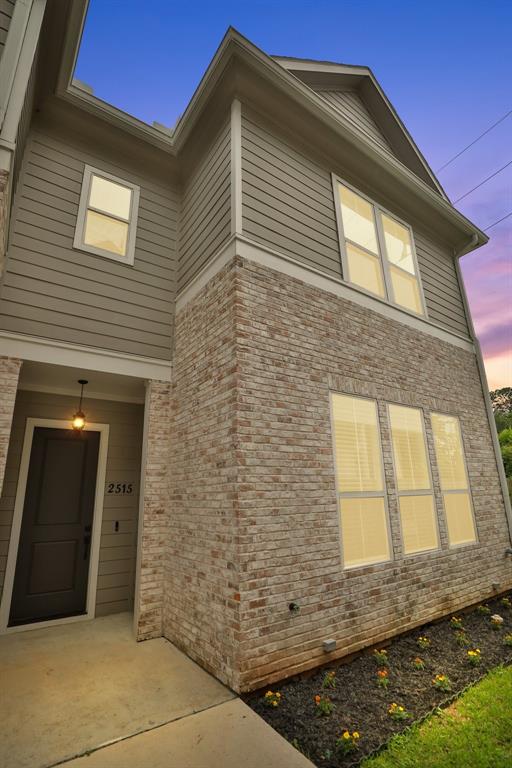
Active
$450,000
3
bds
|
0
ba
|
2,165
sqft
|
built
2015
2515 Judiway St, Houston, TX 77018
$-871
Cash flow
-10.1%
Cash-on-Cash Return
3.4%
Cap rate
0.7%
Rent to Value Ratio
Active
$509,999
3
bds
|
0
ba
|
2,456
sqft
|
built
2016
829 Wakefield Dr, Houston, TX 77018
$-890
Cash flow
-9.1%
Cash-on-Cash Return
3.6%
Cap rate
0.7%
Rent to Value Ratio
Active
$470,000
3
bds
|
0
ba
|
2,224
sqft
|
built
2015
2004 Lou Ellen Ln, Houston, TX 77018
$-967
Cash flow
-10.7%
Cash-on-Cash Return
3.2%
Cap rate
0.7%
Rent to Value Ratio
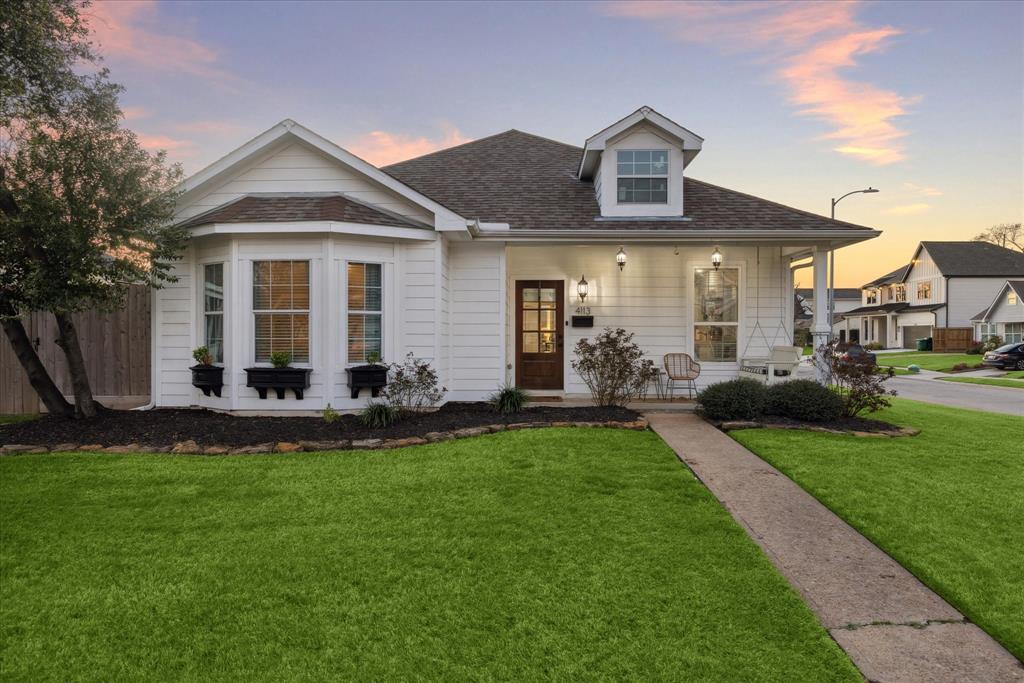
Active
$559,000
3
bds
|
0
ba
|
1,607
sqft
|
built
1947
4113 Ella Blvd, Houston, TX 77018
$-1,127
Cash flow
-10.5%
Cash-on-Cash Return
3.3%
Cap rate
0.4%
Rent to Value Ratio