Houston, TX Investment Properties for Sale
Browse homes for sale and investment properties in Houston, TX. Refine your search by price, property type, or more.
Best cash flowing properties in Houston, TX
Active
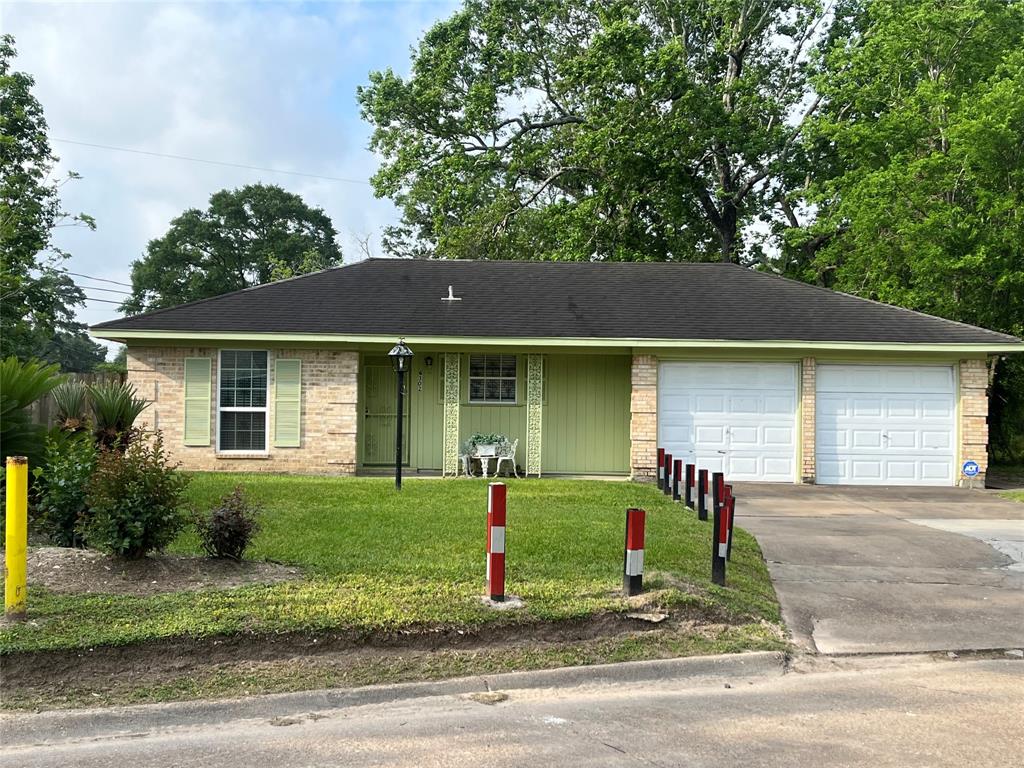
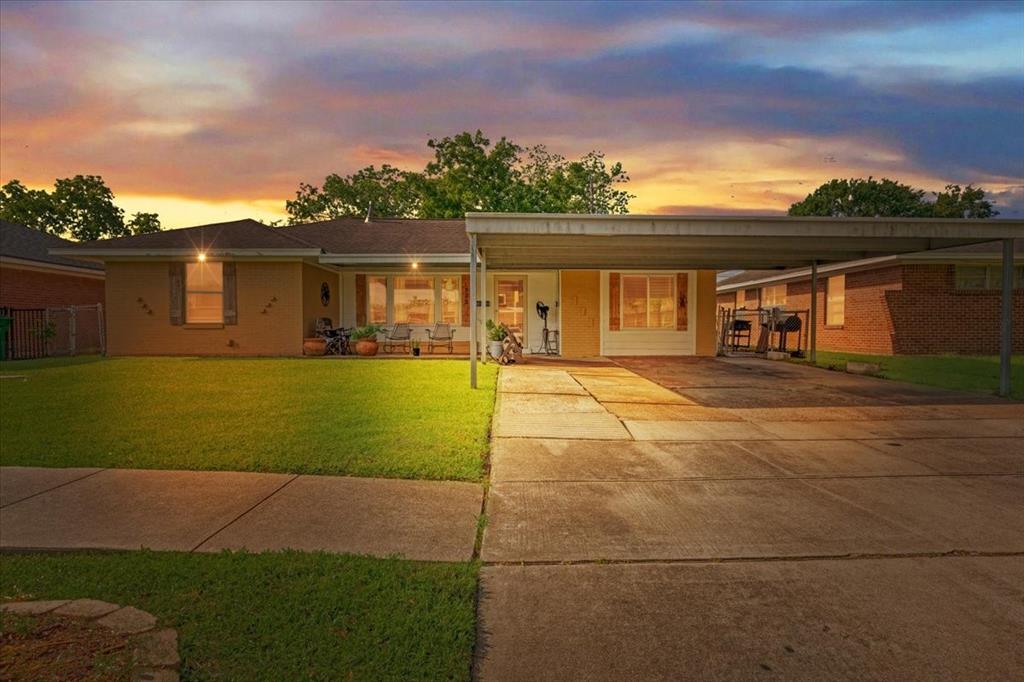
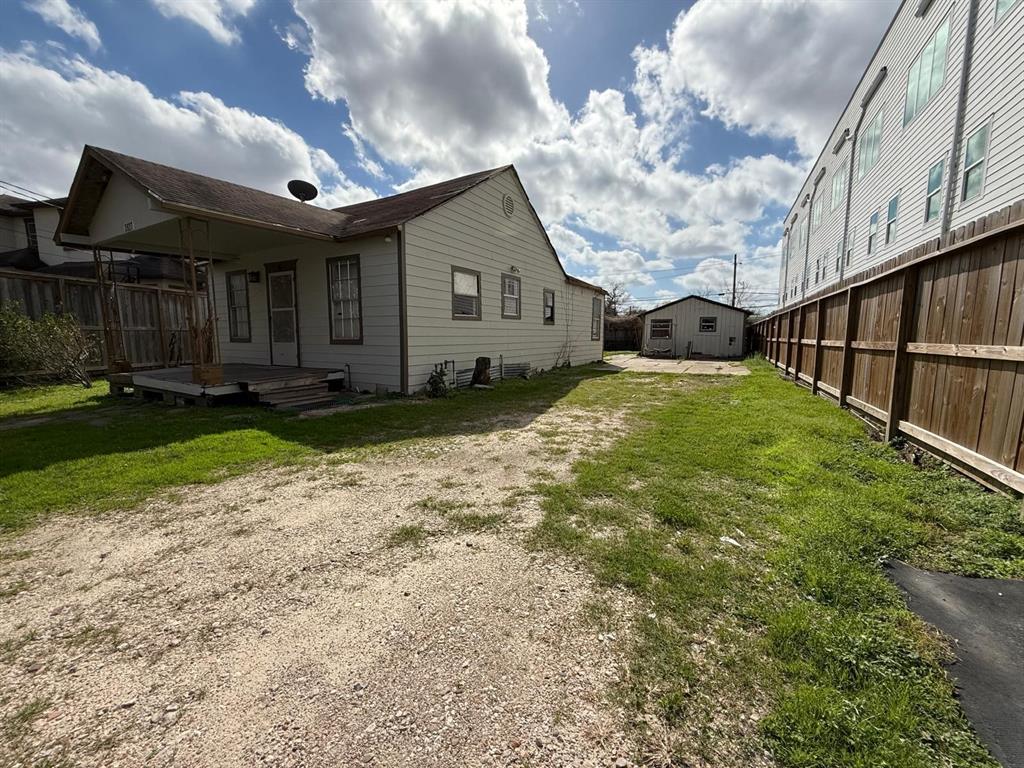
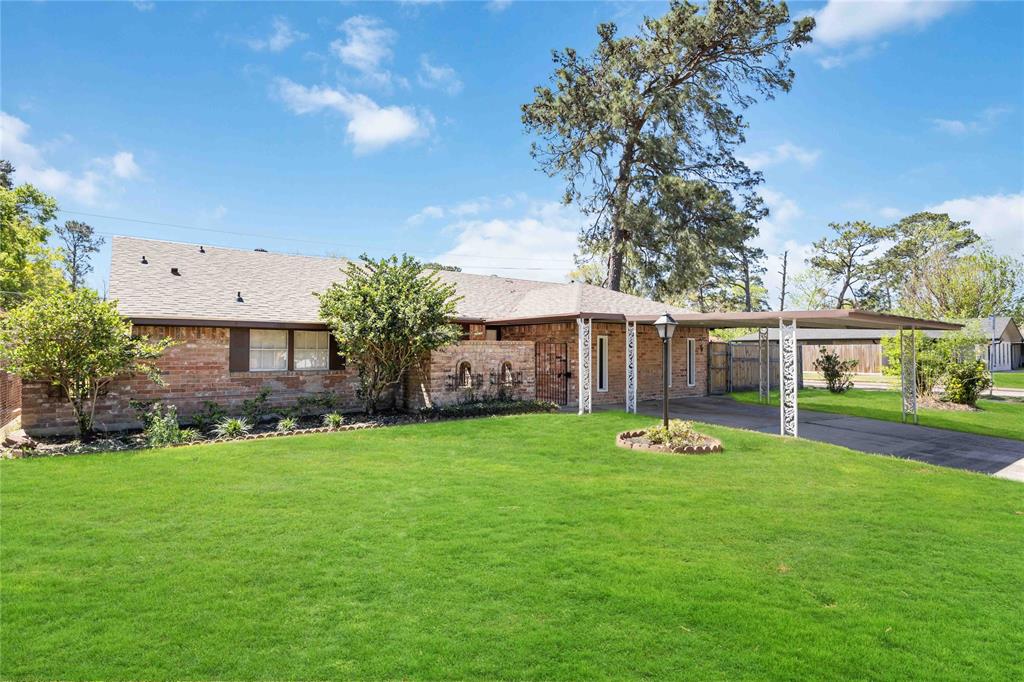
$165,000
2
bds
|
0
ba
|
1,116
sqft
|
built
1958
6302 Heath St, Houston, TX 77016
$81
Cash flow
2.6%
Cash-on-Cash Return
6.9%
Cap rate
1.0%
Rent to Value Ratio
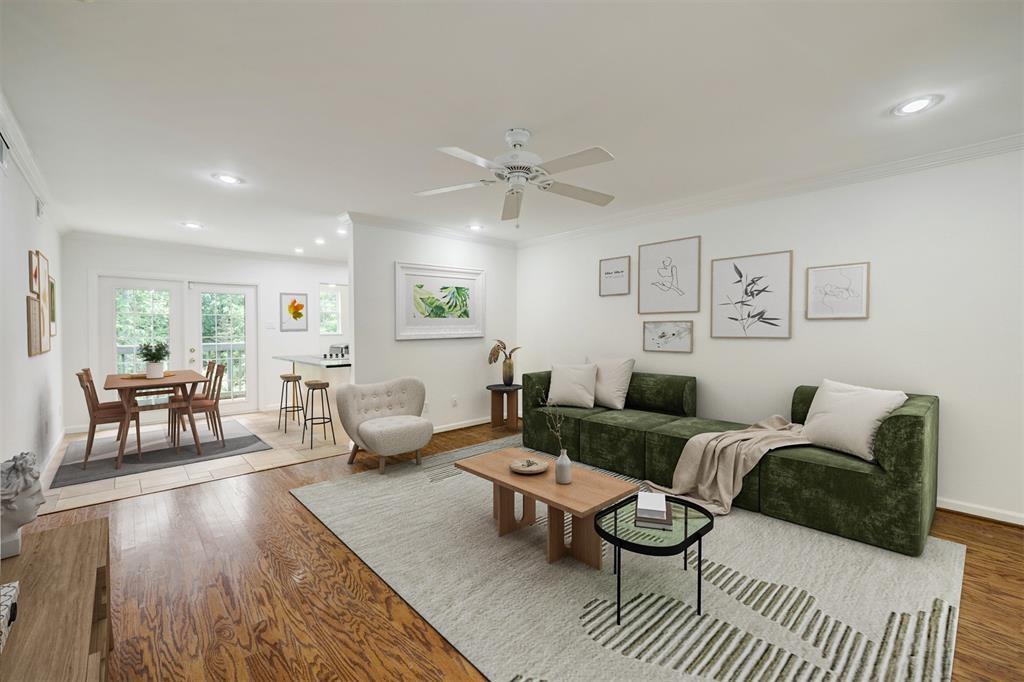
Active
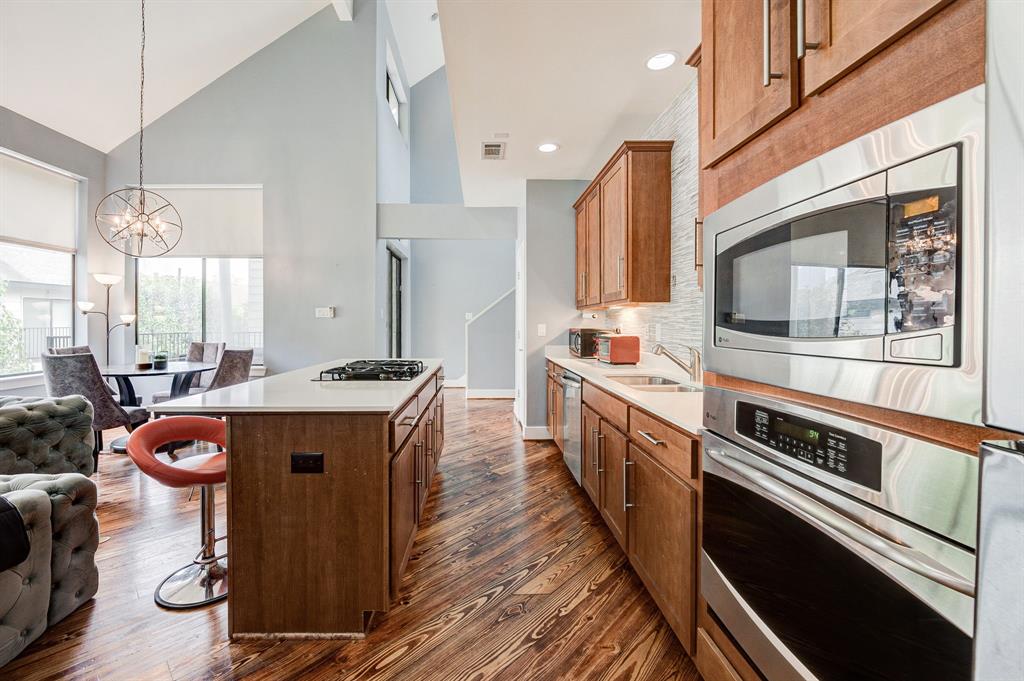
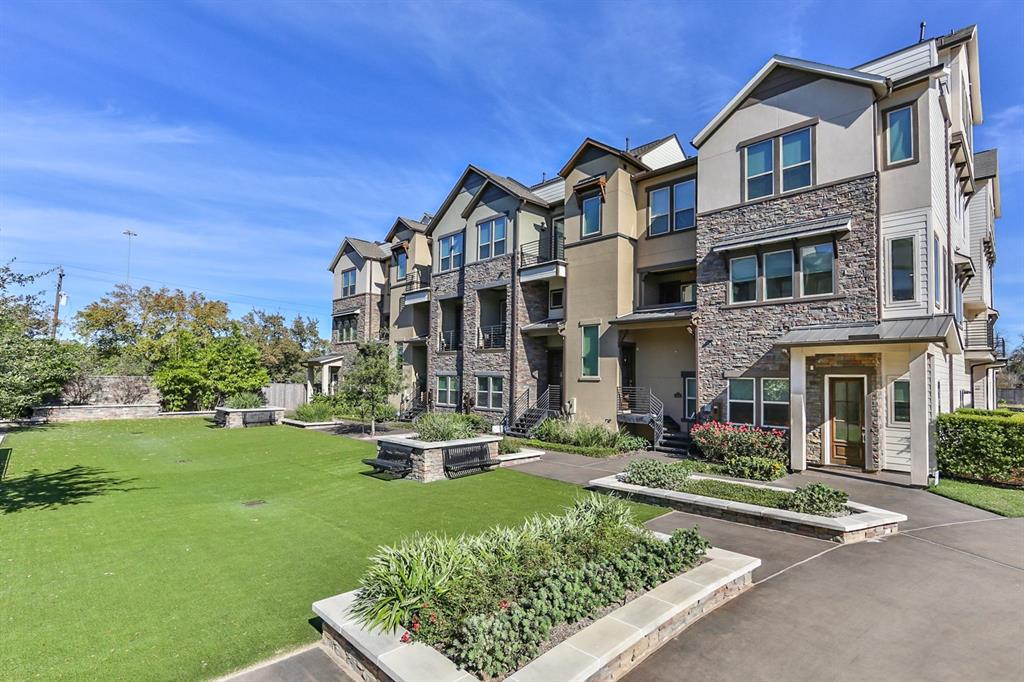
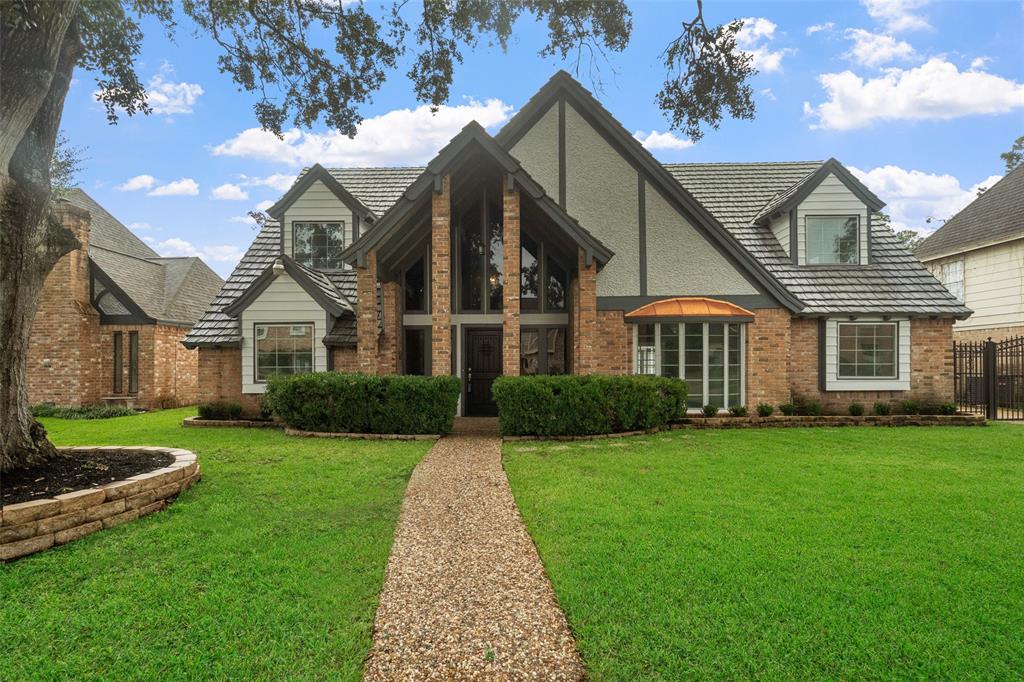
$425,000
3
bds
|
0
ba
|
2,052
sqft
|
built
2011
2308 Webster St, Houston, TX 77003
$-18
Cash flow
-0.2%
Cash-on-Cash Return
6.2%
Cap rate
0.8%
Rent to Value Ratio
8,537 out of 8,983 properties for sale in Houston, TX
Limited Results Shown
Create a free account, or log in to reveal all property listings and enjoy the complete experience.
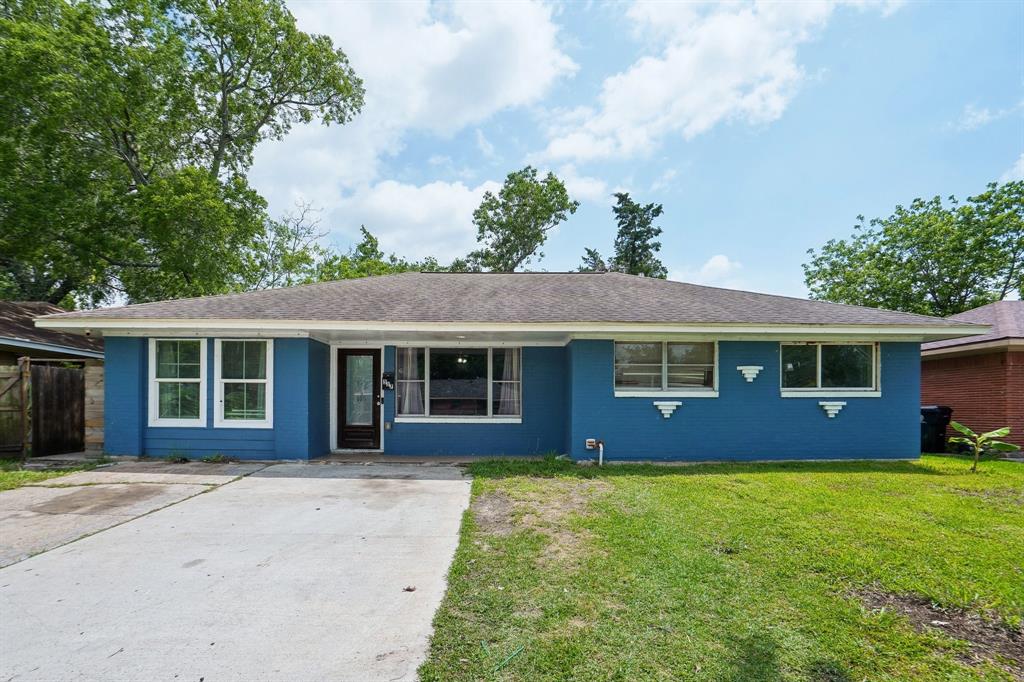
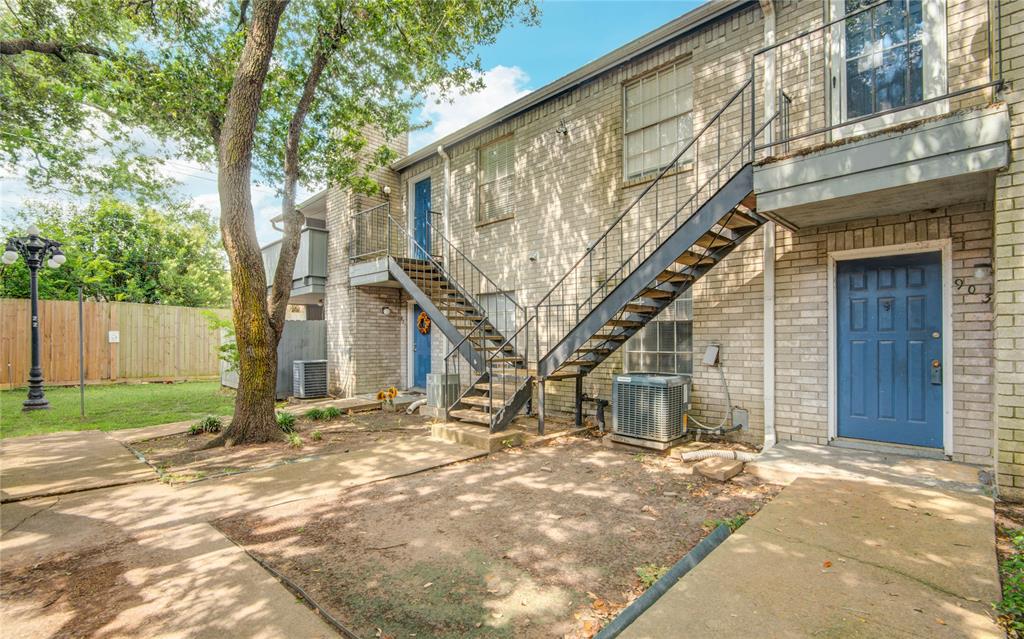
Active
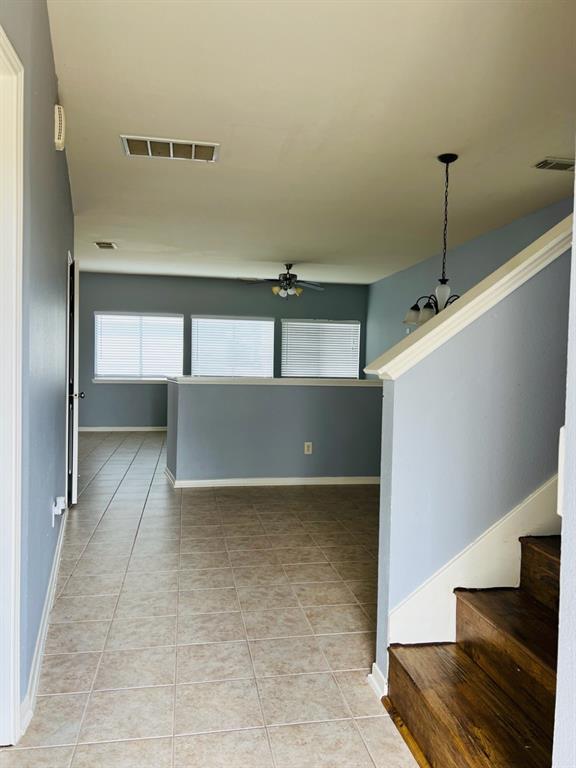
$259,920
4
bds
|
0
ba
|
2,166
sqft
|
built
2007
1114 Grassy View Dr, Houston, TX 77073
$-117
Cash flow
-2.3%
Cash-on-Cash Return
5.7%
Cap rate
0.7%
Rent to Value Ratio
Active
$165,000
2
bds
|
0
ba
|
1,116
sqft
|
built
1958
6302 Heath St, Houston, TX 77016
$81
Cash flow
2.6%
Cash-on-Cash Return
6.9%
Cap rate
1.0%
Rent to Value Ratio

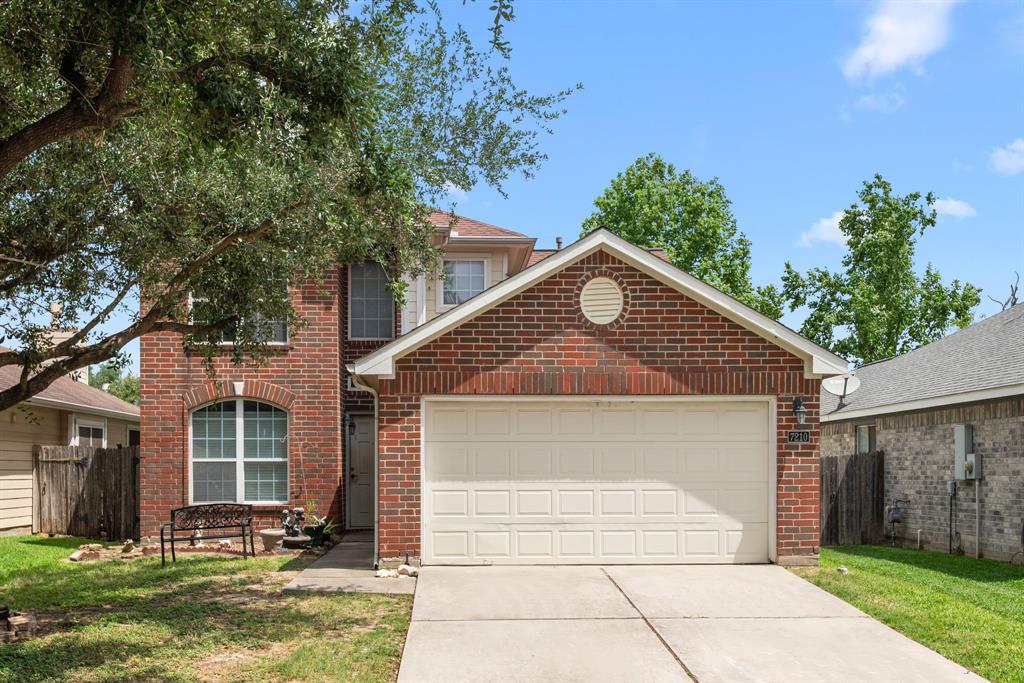
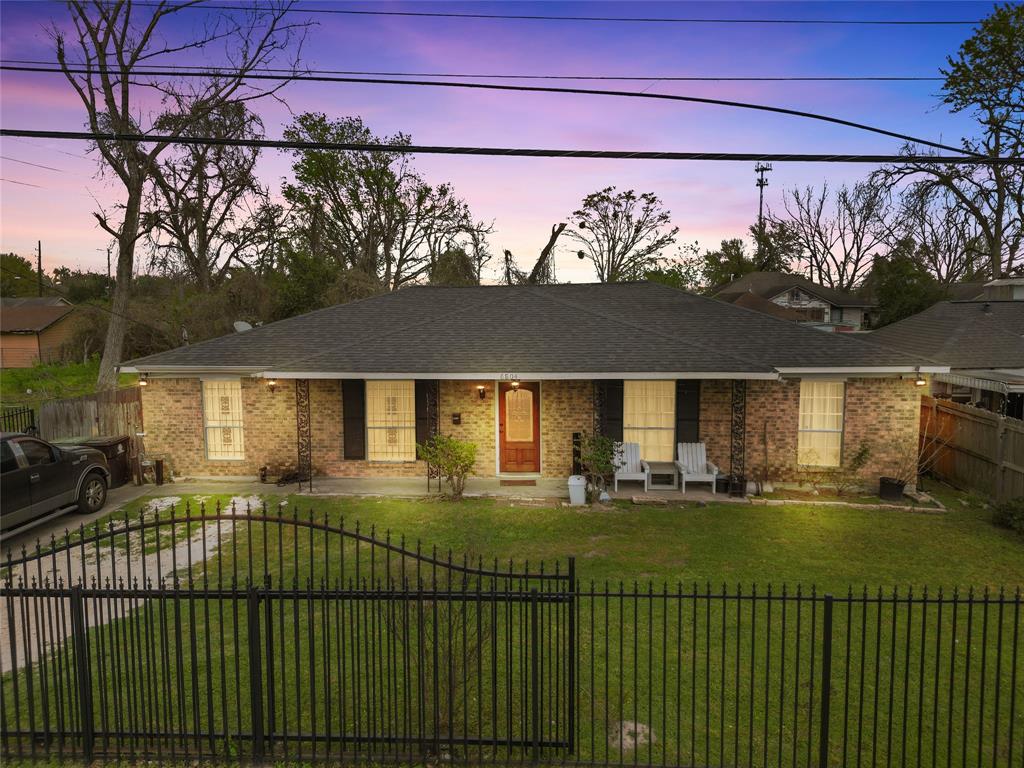
Active
$140,000
2
bds
|
0
ba
|
878
sqft
|
built
1983
12029 Greenwood Forest Dr, Houston, TX 77066
$-228
Cash flow
-8.5%
Cash-on-Cash Return
4.3%
Cap rate
1.0%
Rent to Value Ratio
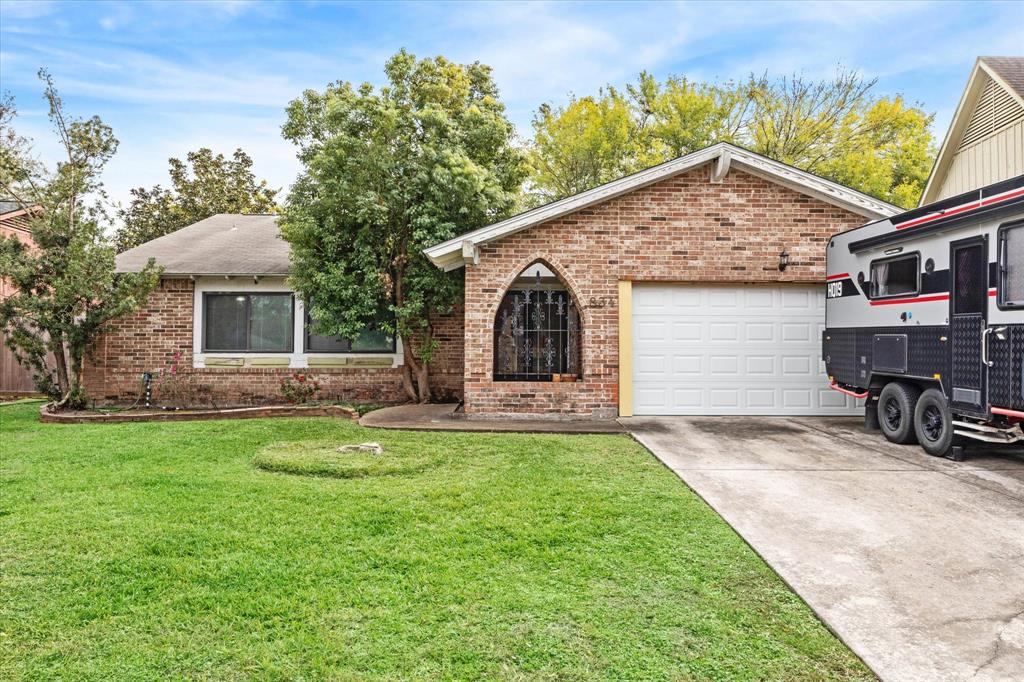
Active
$250,000
3
bds
|
0
ba
|
1,789
sqft
|
built
1968
834 Ramada Dr, Houston, TX 77062
$-286
Cash flow
-6.0%
Cash-on-Cash Return
4.9%
Cap rate
0.9%
Rent to Value Ratio
Active
$475,000
3
bds
|
0
ba
|
2,728
sqft
|
built
2015
2660 Fountain Key Blvd, Houston, TX 77008
$-228
Cash flow
-2.5%
Cash-on-Cash Return
5.7%
Cap rate
0.8%
Rent to Value Ratio
Active
$222,000
3
bds
|
0
ba
|
1,748
sqft
|
built
1980
17419 N Barker St, Houston, TX 77084
$-257
Cash flow
-6.0%
Cash-on-Cash Return
4.9%
Cap rate
0.9%
Rent to Value Ratio
Active
$285,000
4
bds
|
0
ba
|
2,338
sqft
|
built
1978
15459 Runswick Dr, Houston, TX 77062
$-380
Cash flow
-7.0%
Cash-on-Cash Return
4.7%
Cap rate
0.9%
Rent to Value Ratio
Active
$269,900
3
bds
|
0
ba
|
2,184
sqft
|
built
1983
10306 Wayward Wind Ln, Houston, TX 77064
$-357
Cash flow
-6.9%
Cash-on-Cash Return
4.7%
Cap rate
0.8%
Rent to Value Ratio
Active
$399,900
4
bds
|
0
ba
|
3,100
sqft
|
built
1973
1807 Roanwood Dr, Houston, TX 77090
$-330
Cash flow
-4.3%
Cash-on-Cash Return
5.3%
Cap rate
0.8%
Rent to Value Ratio
Active
$244,900
4
bds
|
0
ba
|
1,366
sqft
|
built
1961
922 Creager St, Houston, TX 77034
$-356
Cash flow
-7.6%
Cash-on-Cash Return
4.5%
Cap rate
0.8%
Rent to Value Ratio
Active
$220,000
3
bds
|
0
ba
|
1,368
sqft
|
built
1955
517 Marleen St, Houston, TX 77034
$-381
Cash flow
-9.0%
Cash-on-Cash Return
4.2%
Cap rate
0.8%
Rent to Value Ratio
Active
$265,000
4
bds
|
0
ba
|
2,376
sqft
|
built
2007
7210 Avocet Ln, Houston, TX 77040
$-407
Cash flow
-8.0%
Cash-on-Cash Return
4.4%
Cap rate
0.9%
Rent to Value Ratio
Active
$304,999
3
bds
|
0
ba
|
1,720
sqft
|
built
1960
5839 Ettrick Dr, Houston, TX 77035
$-553
Cash flow
-9.5%
Cash-on-Cash Return
4.1%
Cap rate
0.7%
Rent to Value Ratio
Active
$310,500
4
bds
|
0
ba
|
1,910
sqft
|
built
1978
815 Pebbleshire Dr, Houston, TX 77062
$-452
Cash flow
-7.6%
Cash-on-Cash Return
4.5%
Cap rate
0.8%
Rent to Value Ratio
Active under contract
$319,900
4
bds
|
0
ba
|
3,278
sqft
|
built
1970
5902 Old Lodge Dr, Houston, TX 77066
$-460
Cash flow
-7.5%
Cash-on-Cash Return
4.6%
Cap rate
0.8%
Rent to Value Ratio
Active
$289,000
3
bds
|
0
ba
|
1,786
sqft
|
built
1979
5427 Cairnleigh Dr, Houston, TX 77084
$-464
Cash flow
-8.4%
Cash-on-Cash Return
4.4%
Cap rate
0.8%
Rent to Value Ratio
Active
$265,000
3
bds
|
0
ba
|
2,059
sqft
|
built
2001
1983 Sugar Pine Cir, Houston, TX 77090
$-437
Cash flow
-8.6%
Cash-on-Cash Return
4.3%
Cap rate
0.8%
Rent to Value Ratio
Active
$369,000
4
bds
|
0
ba
|
2,710
sqft
|
built
1976
5610 Court Of Lions St, Houston, TX 77069
$-446
Cash flow
-6.3%
Cash-on-Cash Return
4.8%
Cap rate
0.8%
Rent to Value Ratio
Active
$350,000
4
bds
|
0
ba
|
2,374
sqft
|
built
1985
7914 Rio Crystal Dr, Houston, TX 77095
$-646
Cash flow
-9.6%
Cash-on-Cash Return
4.1%
Cap rate
0.7%
Rent to Value Ratio
Active
$249,900
2
bds
|
0
ba
|
1,518
sqft
|
built
2009
14744 Branchwest Dr, Houston, TX 77082
$-494
Cash flow
-10.3%
Cash-on-Cash Return
3.9%
Cap rate
0.7%
Rent to Value Ratio
Active
$134,999
1
bds
|
0
ba
|
794
sqft
|
built
1985
3525 Sage Rd, Houston, TX 77056
$-553
Cash flow
-21.4%
Cash-on-Cash Return
1.4%
Cap rate
1.3%
Rent to Value Ratio
Active
$295,000
4
bds
|
0
ba
|
2,179
sqft
|
built
2005
12430 Heritage Grove Dr, Houston, TX 77066
$-467
Cash flow
-8.3%
Cash-on-Cash Return
4.4%
Cap rate
0.8%
Rent to Value Ratio
Active
$299,900
2
bds
|
0
ba
|
1,630
sqft
|
built
1977
9400 Doliver Dr, Houston, TX 77063
$-593
Cash flow
-10.3%
Cash-on-Cash Return
3.9%
Cap rate
0.8%
Rent to Value Ratio
Active
$279,900
3
bds
|
0
ba
|
1,560
sqft
|
built
1980
9203 Kirkmont Dr, Houston, TX 77089
$-604
Cash flow
-11.3%
Cash-on-Cash Return
3.7%
Cap rate
0.7%
Rent to Value Ratio
Active
$230,000
2
bds
|
0
ba
|
836
sqft
|
built
1935
3927 Kennon St, Houston, TX 77009
$-600
Cash flow
-13.6%
Cash-on-Cash Return
3.2%
Cap rate
0.6%
Rent to Value Ratio
Active
$180,000
2
bds
|
0
ba
|
1,052
sqft
|
built
1964
8277 Kingsbrook Rd, Houston, TX 77024
$-561
Cash flow
-16.3%
Cash-on-Cash Return
2.5%
Cap rate
1.1%
Rent to Value Ratio
Active
$88,000
2
bds
|
0
ba
|
1,068
sqft
|
built
1983
9797 Leawood Blvd, Houston, TX 77099
$-93
Cash flow
-5.5%
Cash-on-Cash Return
5.0%
Cap rate
1.5%
Rent to Value Ratio
Pending
$235,000
3
bds
|
0
ba
|
1,968
sqft
|
built
1975
6804 Schuller Rd, Houston, TX 77093
$-235
Cash flow
-5.2%
Cash-on-Cash Return
5.1%
Cap rate
0.9%
Rent to Value Ratio
Active
$250,000
4
bds
|
0
ba
|
1,779
sqft
|
built
1960
6502 Leedale St, Houston, TX 77016
$-188
Cash flow
-3.9%
Cash-on-Cash Return
5.4%
Cap rate
0.8%
Rent to Value Ratio
Active
$88,888
1
bds
|
0
ba
|
768
sqft
|
built
1980
10501 South Dr, Houston, TX 77099
$-187
Cash flow
-11.0%
Cash-on-Cash Return
3.8%
Cap rate
1.1%
Rent to Value Ratio
Active
$425,000
3
bds
|
0
ba
|
2,052
sqft
|
built
2011
2308 Webster St, Houston, TX 77003
$-18
Cash flow
-0.2%
Cash-on-Cash Return
6.2%
Cap rate
0.8%
Rent to Value Ratio
Active
$160,000
2
bds
|
0
ba
|
909
sqft
|
built
1976
1100 Augusta Dr, Houston, TX 77057
$-378
Cash flow
-12.3%
Cash-on-Cash Return
3.5%
Cap rate
1.0%
Rent to Value Ratio
Active
$309,900
3
bds
|
0
ba
|
2,081
sqft
|
built
2021
2019 Harlem St, Houston, TX 77020
$-655
Cash flow
-11.0%
Cash-on-Cash Return
3.7%
Cap rate
0.7%
Rent to Value Ratio
Active
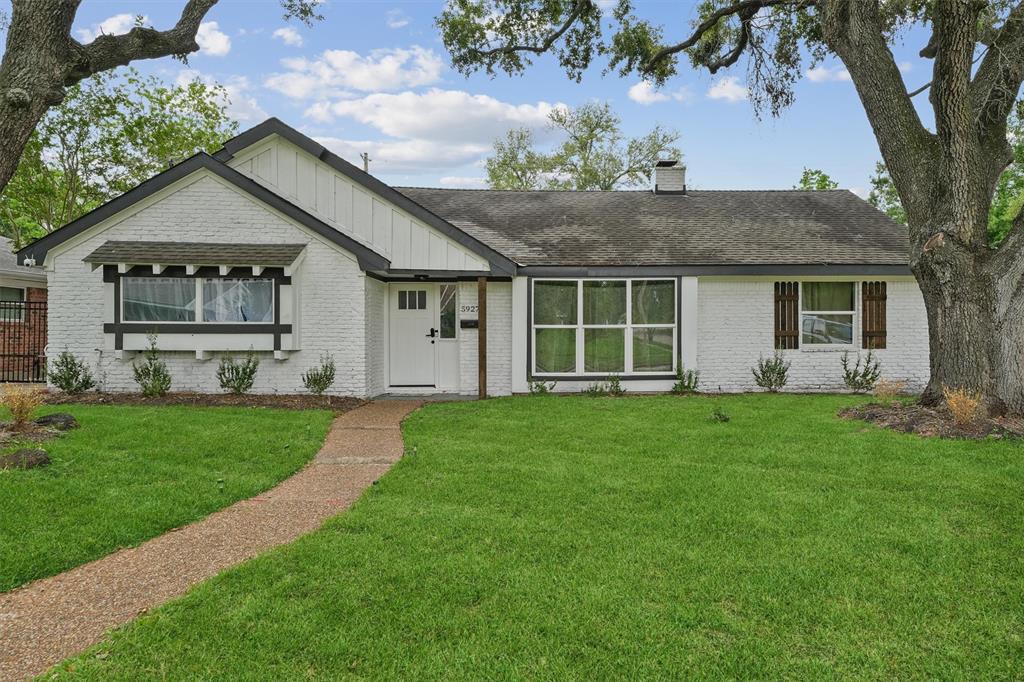
$350,000
4
bds
|
0
ba
|
2,064
sqft
|
built
1963
5927 Warm Springs Rd, Houston, TX 77035
$-717
Cash flow
-10.7%
Cash-on-Cash Return
3.8%
Cap rate
0.7%
Rent to Value Ratio

Active
$675,000
5
bds
|
0
ba
|
3,342
sqft
|
built
1996
19203 Yearling Mdws, Houston, TX 77094
$-891
Cash flow
-6.9%
Cash-on-Cash Return
4.7%
Cap rate
0.6%
Rent to Value Ratio
Active
$270,000
3
bds
|
0
ba
|
1,925
sqft
|
built
1955
4843 Bricker St, Houston, TX 77033
$-493
Cash flow
-9.5%
Cash-on-Cash Return
4.1%
Cap rate
0.6%
Rent to Value Ratio
Active
$165,000
2
bds
|
0
ba
|
1,184
sqft
|
built
1970
12046 Beechnut St, Houston, TX 77072
$-388
Cash flow
-12.3%
Cash-on-Cash Return
3.5%
Cap rate
0.6%
Rent to Value Ratio

Active
$190,000
1
bds
|
0
ba
|
1,095
sqft
|
built
1979
782 Worthshire St, Houston, TX 77008
$-596
Cash flow
-16.4%
Cash-on-Cash Return
2.5%
Cap rate
1.1%
Rent to Value Ratio
Active
$195,000
3
bds
|
0
ba
|
1,200
sqft
|
built
2000
2323 Chalet Rd, Houston, TX 77038
$-240
Cash flow
-6.4%
Cash-on-Cash Return
4.8%
Cap rate
0.8%
Rent to Value Ratio
Active
$189,950
3
bds
|
0
ba
|
1,224
sqft
|
built
1950
4813 Larkspur St, Houston, TX 77033
$-207
Cash flow
-5.7%
Cash-on-Cash Return
5.0%
Cap rate
0.8%
Rent to Value Ratio