Houston, TX Investment Properties for Sale
Browse homes for sale and investment properties in Houston, TX. Refine your search by price, property type, or more.
Best cash flowing properties in Houston, TX
Active
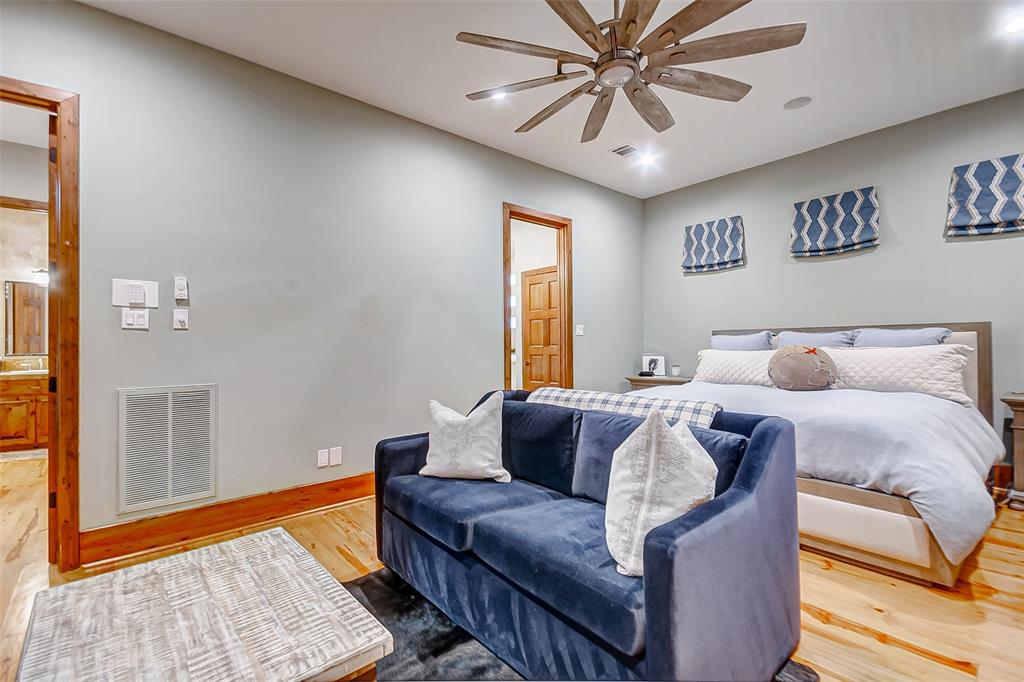
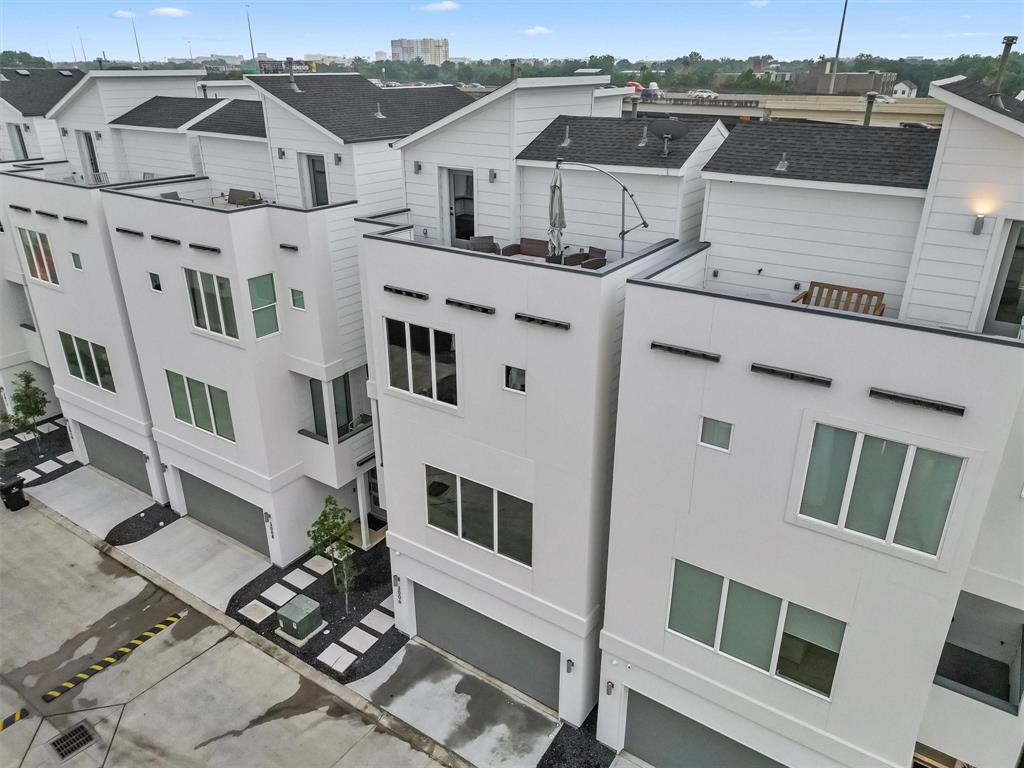
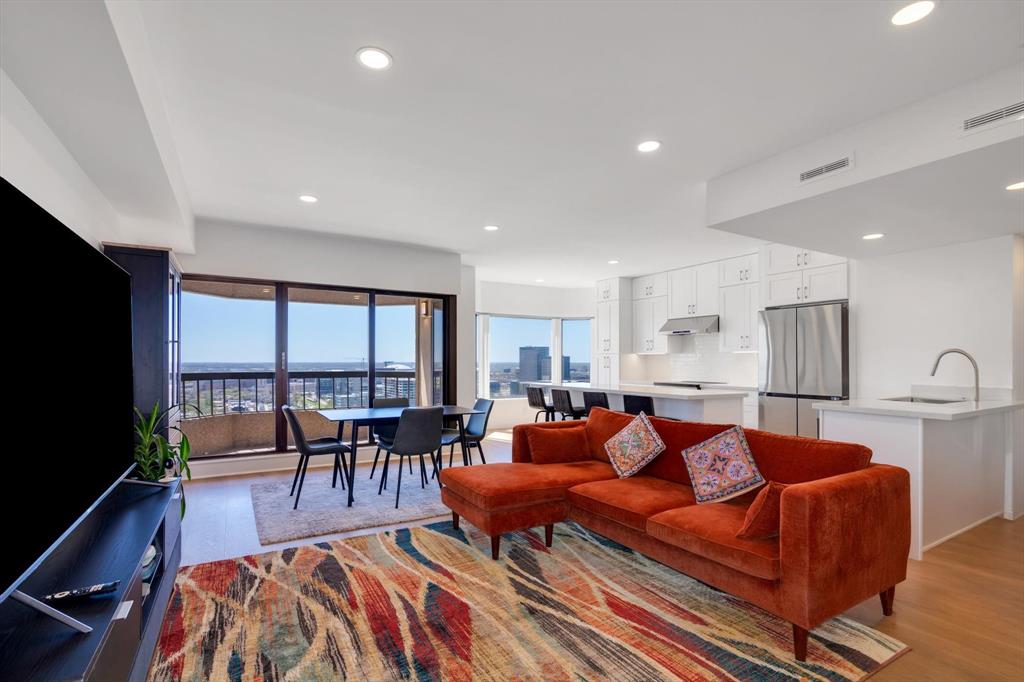
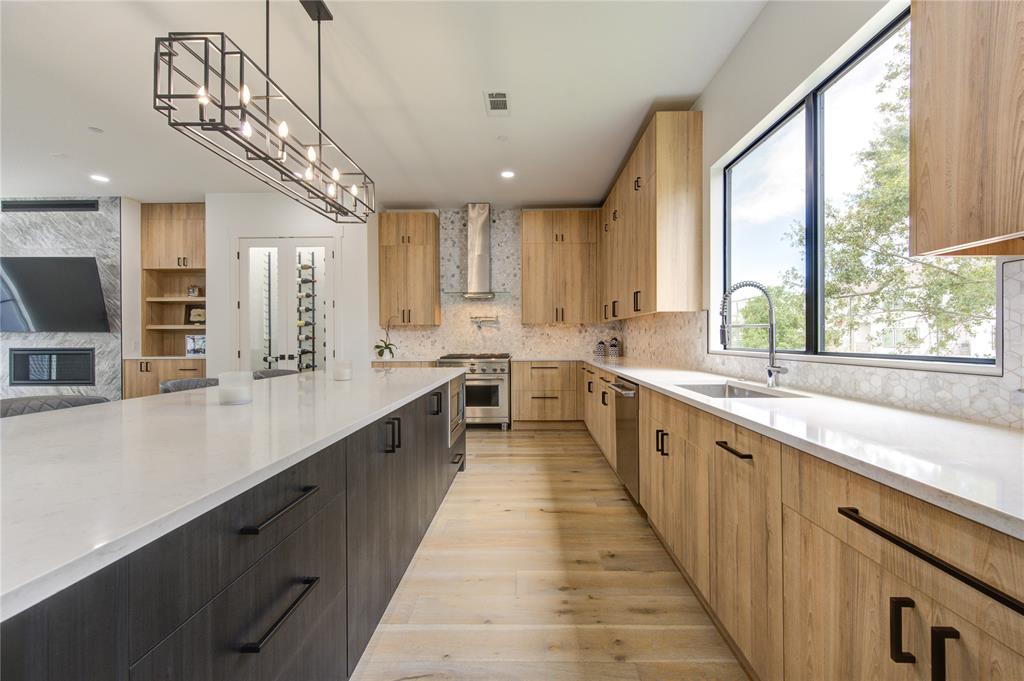
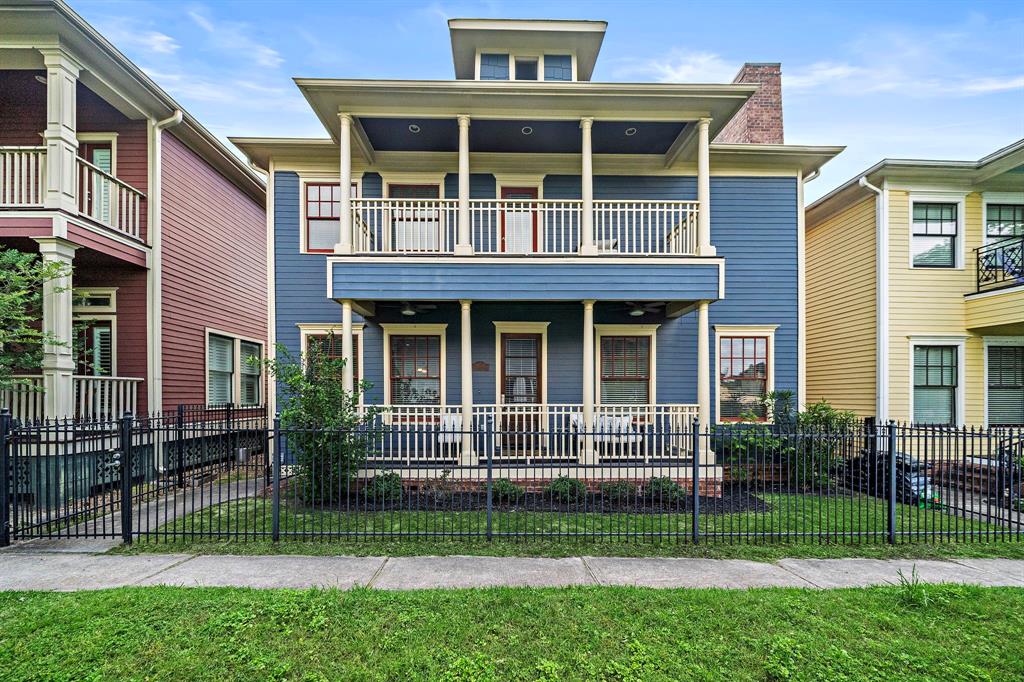
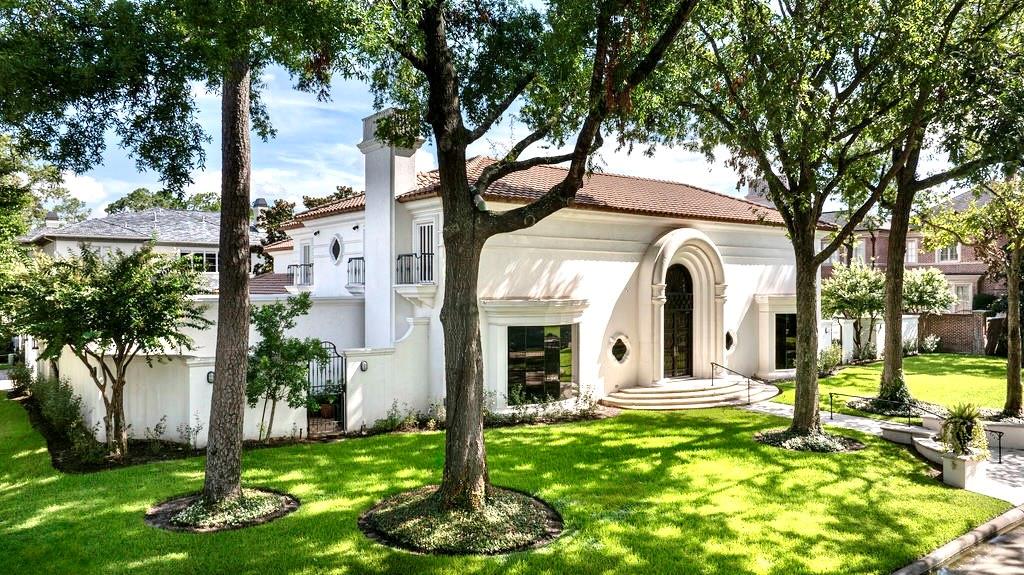
$1,125,000
4
bds
|
0
ba
|
3,055
sqft
|
built
2003
516 W 9th St, Houston, TX 77007
$748
Cash flow
3.5%
Cash-on-Cash Return
6.5%
Cap rate
0.8%
Rent to Value Ratio
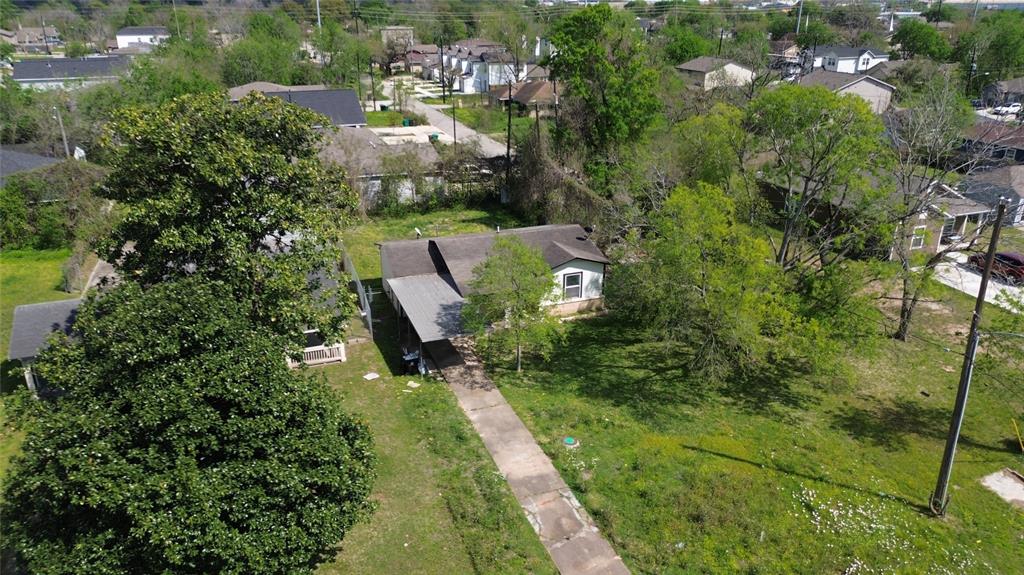
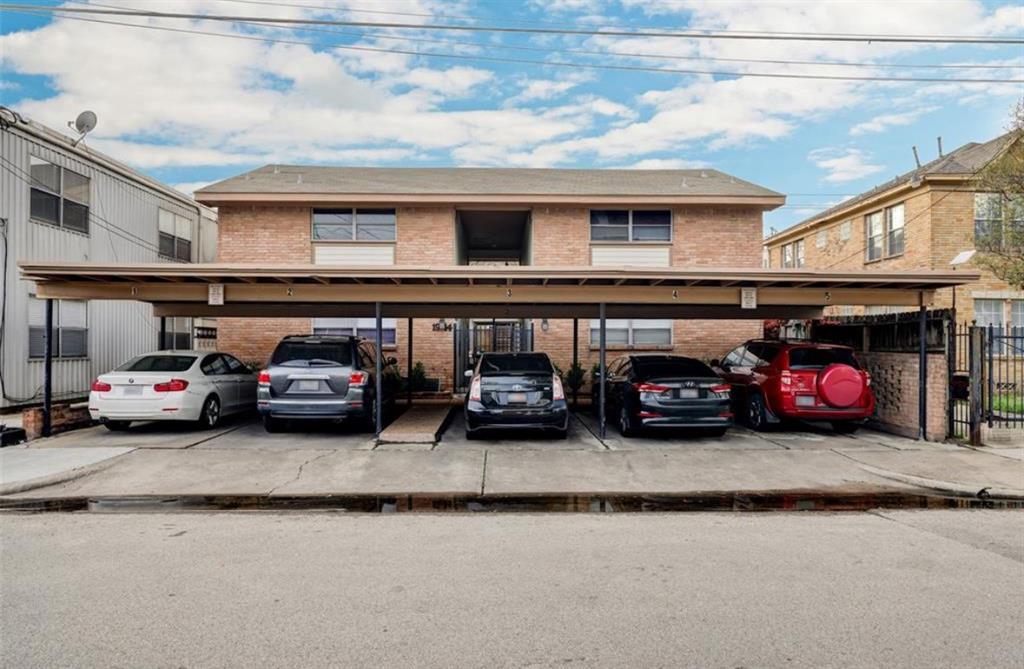
Active
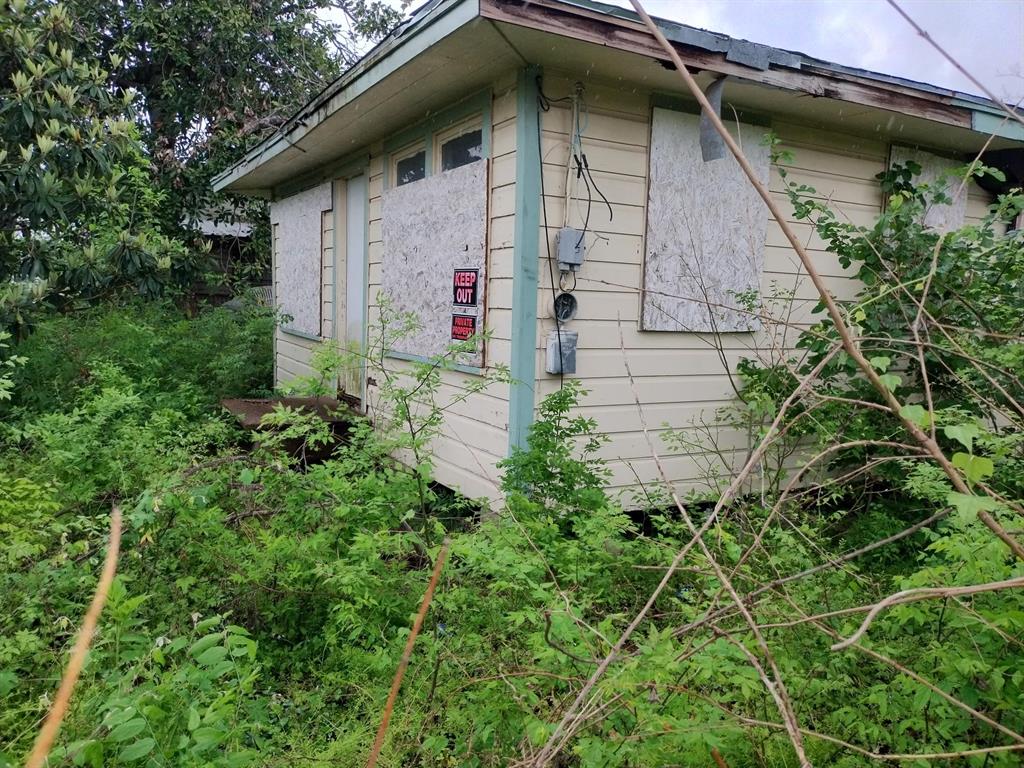
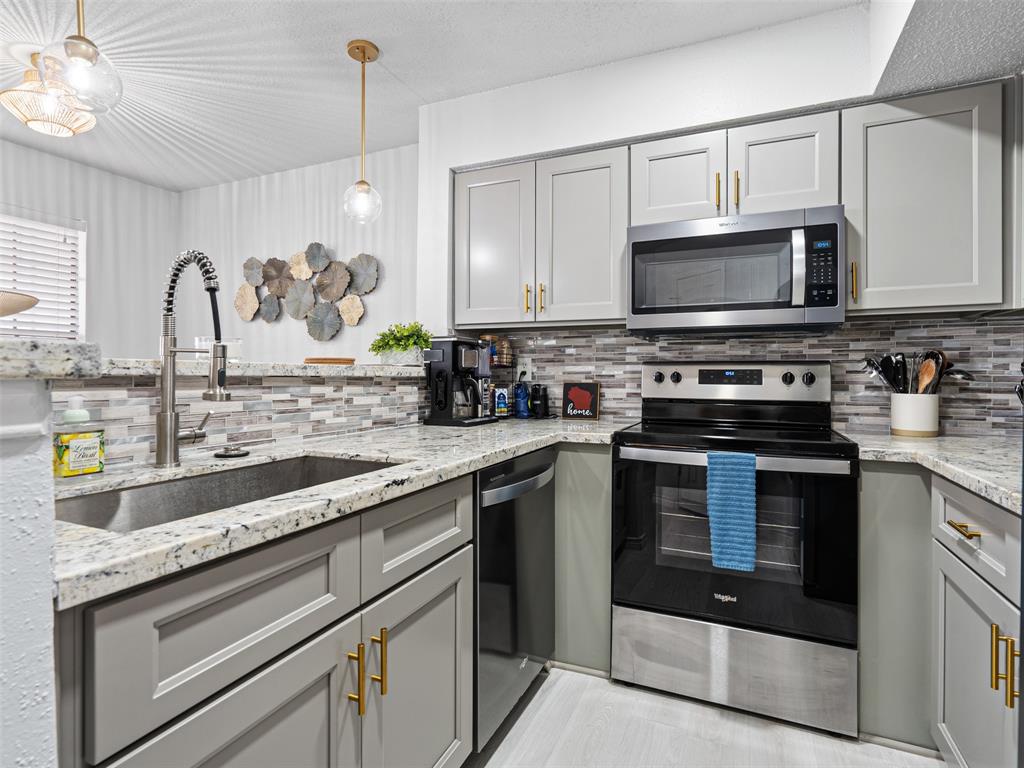
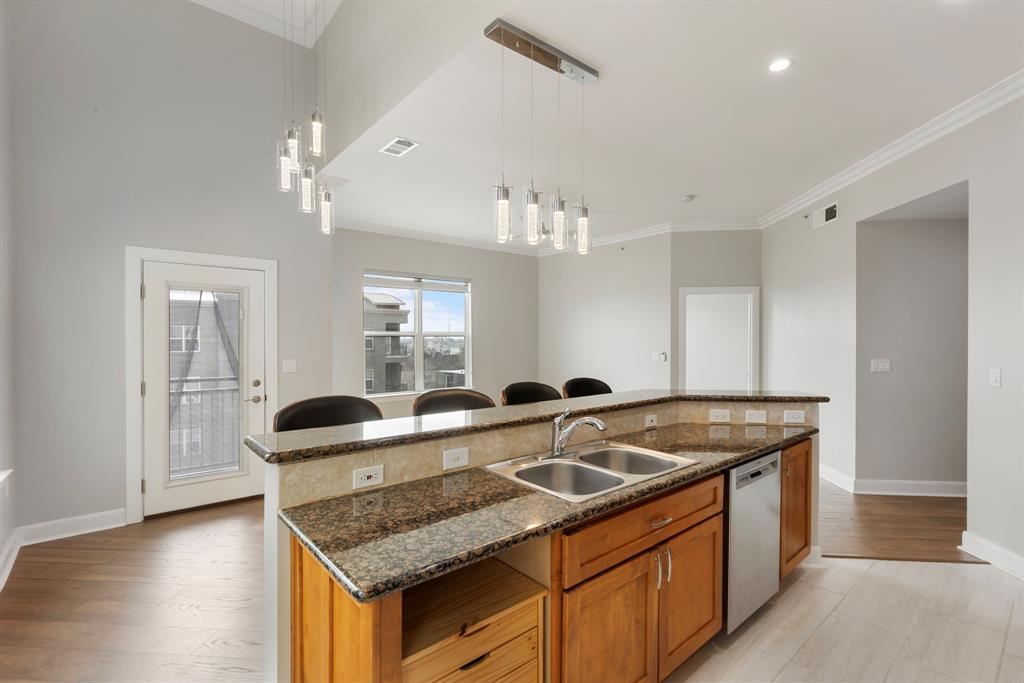
$107,500
2
bds
|
0
ba
|
1,104
sqft
|
built
1950
4708 Engleford St, Houston, TX 77026
$480
Cash flow
23.3%
Cash-on-Cash Return
11.0%
Cap rate
1.5%
Rent to Value Ratio
8,547 out of 8,994 properties for sale in Houston, TX
Limited Results Shown
Create a free account, or log in to reveal all property listings and enjoy the complete experience.
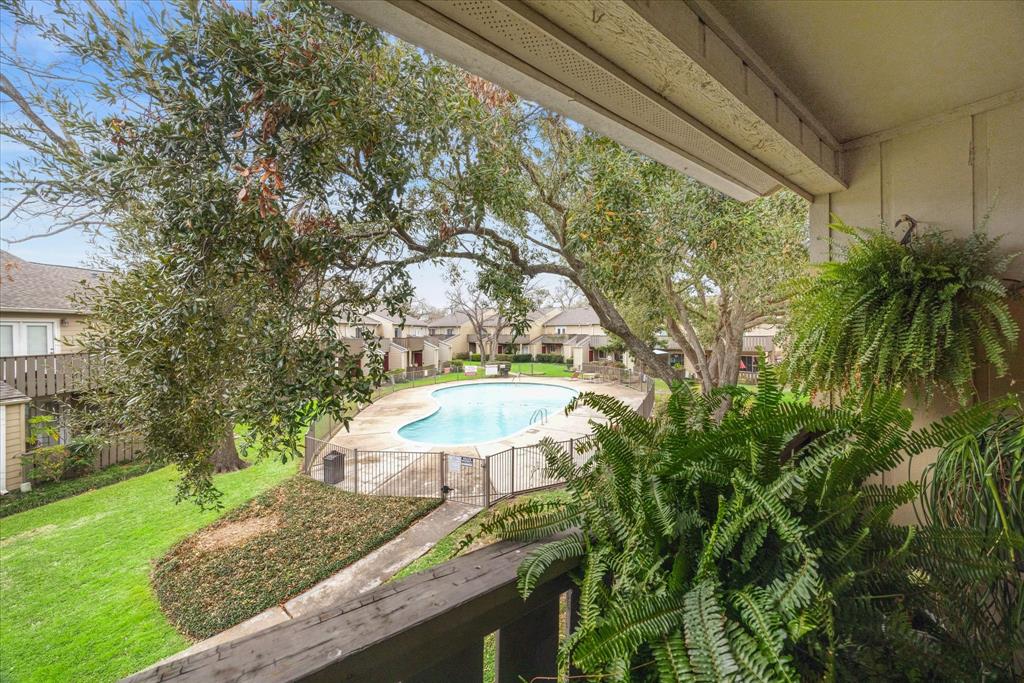
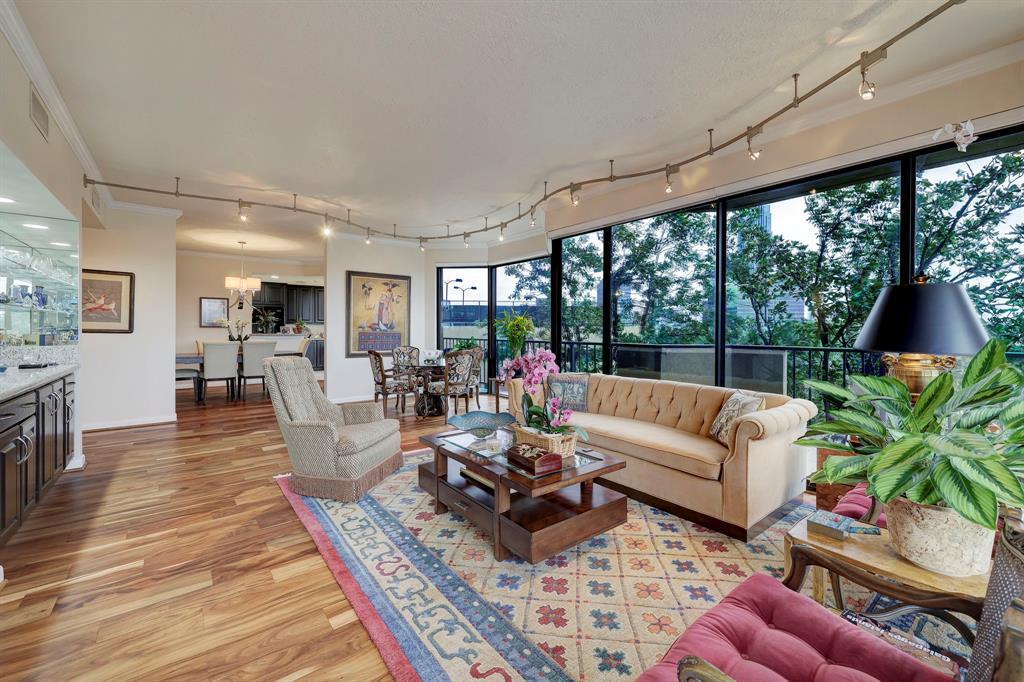
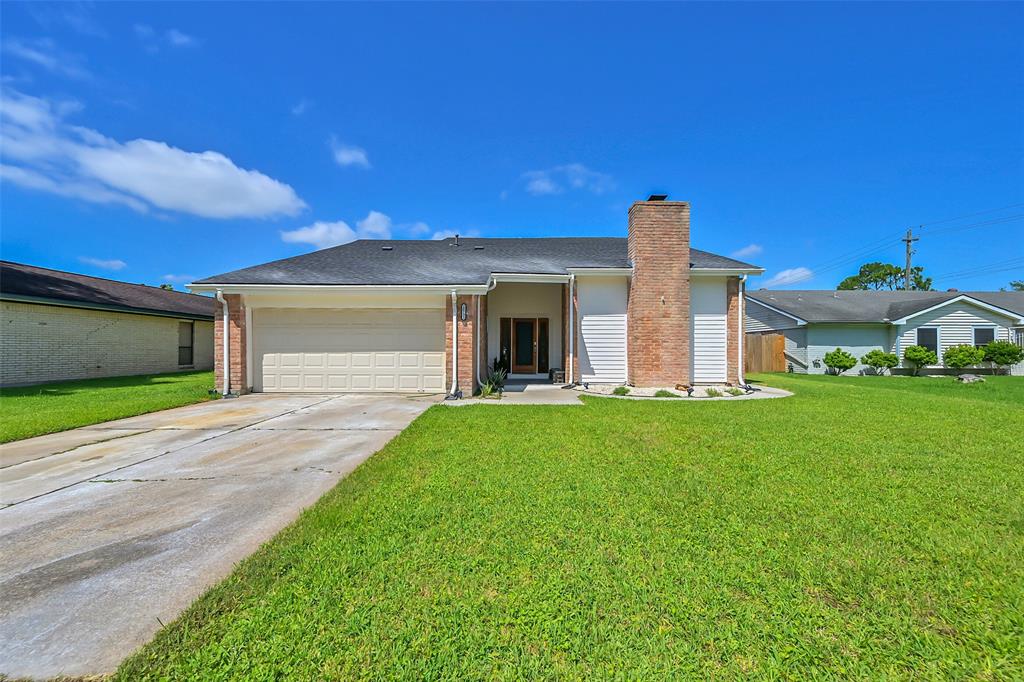
Active
$145,900
2
bds
|
0
ba
|
1,298
sqft
|
built
1974
5005 Georgi Ln, Houston, TX 77092
$-391
Cash flow
-14.0%
Cash-on-Cash Return
2.5%
Cap rate
1.1%
Rent to Value Ratio

Active
$3,950,000
4
bds
|
0
ba
|
4,937
sqft
|
built
2018
4521 San Felipe St, Houston, TX 77027
$-21,698
Cash flow
-28.7%
Cash-on-Cash Return
-0.9%
Cap rate
0.2%
Rent to Value Ratio
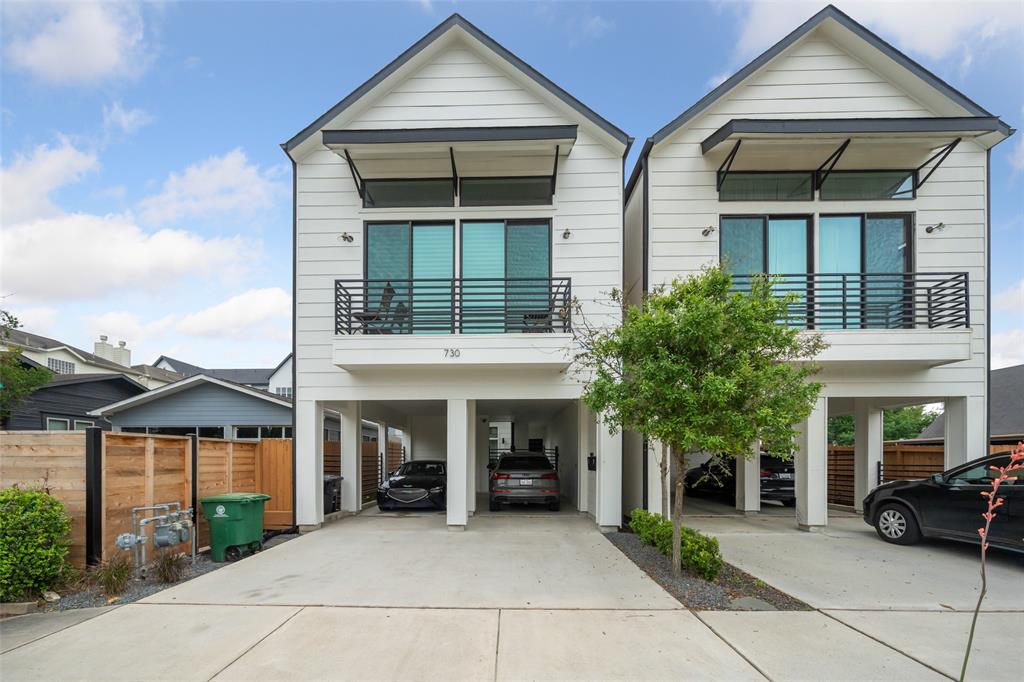
Active
$820,000
4
bds
|
0
ba
|
2,770
sqft
|
built
2018
730 W 22nd St, Houston, TX 77008
$-2,337
Cash flow
-14.9%
Cash-on-Cash Return
2.3%
Cap rate
0.5%
Rent to Value Ratio
Active
$235,000
3
bds
|
0
ba
|
1,428
sqft
|
built
2016
5907 Wedgefield St, Houston, TX 77028
$-908
Cash flow
-20.2%
Cash-on-Cash Return
1.0%
Cap rate
0.3%
Rent to Value Ratio
Active
$259,900
3
bds
|
0
ba
|
1,711
sqft
|
built
1973
19326 Gagelake Ln, Houston, TX 77084
$41
Cash flow
0.8%
Cash-on-Cash Return
5.9%
Cap rate
0.7%
Rent to Value Ratio
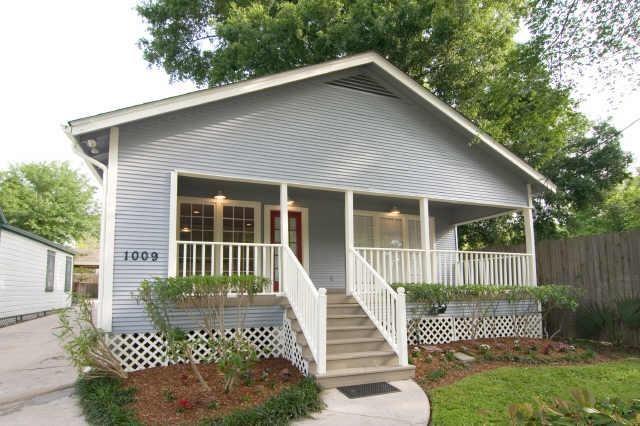
Active
$509,900
2
bds
|
0
ba
|
1,120
sqft
|
built
1940
1009 W 23rd St, Houston, TX 77008
$-1,237
Cash flow
-12.7%
Cash-on-Cash Return
2.8%
Cap rate
0.5%
Rent to Value Ratio
Active
$129,000
1
bds
|
0
ba
|
600
sqft
|
built
1967
3224 Timmons Ln, Houston, TX 77027
$-432
Cash flow
-17.5%
Cash-on-Cash Return
1.7%
Cap rate
0.8%
Rent to Value Ratio
Active
$600,000
2
bds
|
0
ba
|
2,726
sqft
|
built
1946
3607 Anita St, Houston, TX 77004
$-2,140
Cash flow
-18.6%
Cash-on-Cash Return
1.4%
Cap rate
0.3%
Rent to Value Ratio
Active
$89,900
1
bds
|
0
ba
|
728
sqft
|
built
1980
12955 Woodforest Blvd, Houston, TX 77015
$-98
Cash flow
-5.7%
Cash-on-Cash Return
4.4%
Cap rate
1.2%
Rent to Value Ratio
Active
$255,000
4
bds
|
0
ba
|
1,403
sqft
|
built
1955
9118 St Lo Rd, Houston, TX 77033
$11
Cash flow
0.2%
Cash-on-Cash Return
5.7%
Cap rate
0.8%
Rent to Value Ratio
Active
$87,800
2
bds
|
0
ba
|
1,068
sqft
|
built
1983
9797 Leawood Blvd, Houston, TX 77099
$-160
Cash flow
-9.5%
Cash-on-Cash Return
3.5%
Cap rate
1.3%
Rent to Value Ratio
Active
$975,000
4
bds
|
0
ba
|
4,370
sqft
|
built
2011
11722 Montmarte Blvd, Houston, TX 77082
$-4,073
Cash flow
-21.8%
Cash-on-Cash Return
0.7%
Cap rate
0.5%
Rent to Value Ratio
Active
$120,000
2
bds
|
0
ba
|
1,035
sqft
|
built
1978
1500 Bay Area Blvd, Houston, TX 77058
$-236
Cash flow
-10.3%
Cash-on-Cash Return
3.3%
Cap rate
1.2%
Rent to Value Ratio
Active
$405,000
4
bds
|
0
ba
|
3,276
sqft
|
built
2016
15427 Dolan Brook Ln, Houston, TX 77044
$-876
Cash flow
-11.3%
Cash-on-Cash Return
3.1%
Cap rate
0.8%
Rent to Value Ratio
Active
$1,699,900
5
bds
|
0
ba
|
4,274
sqft
|
built
2023
1011 Wynnwood Ln, Houston, TX 77008
$-3,496
Cash flow
-10.7%
Cash-on-Cash Return
3.2%
Cap rate
0.6%
Rent to Value Ratio
Active
$505,000
3
bds
|
0
ba
|
2,073
sqft
|
built
2021
3006 Markle Dr, Houston, TX 77003
$-901
Cash flow
-9.3%
Cash-on-Cash Return
3.5%
Cap rate
0.7%
Rent to Value Ratio
Active
$169,000
3
bds
|
0
ba
|
857
sqft
|
built
1940
410 Clinton Park St, Houston, TX 77029
$-260
Cash flow
-8.0%
Cash-on-Cash Return
3.8%
Cap rate
0.6%
Rent to Value Ratio
Active
$524,000
3
bds
|
0
ba
|
2,223
sqft
|
built
2021
2414 Canal St, Houston, TX 77003
$-273
Cash flow
-2.7%
Cash-on-Cash Return
5.1%
Cap rate
0.7%
Rent to Value Ratio
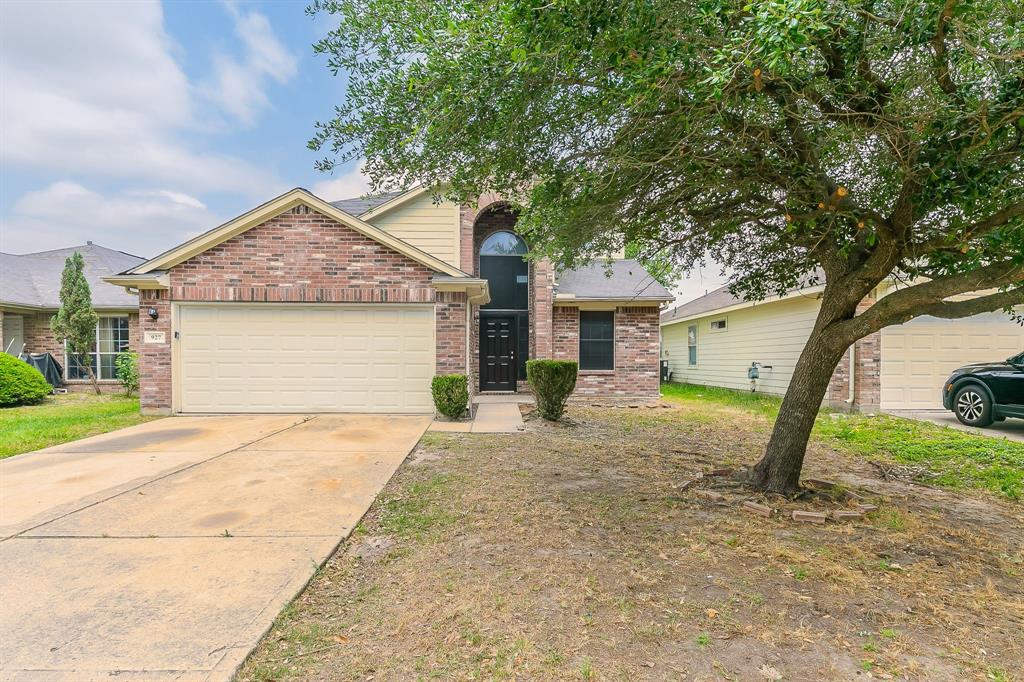
Active
$237,000
3
bds
|
0
ba
|
1,991
sqft
|
built
2006
927 Redcrest Springs Ct, Houston, TX 77073
$-215
Cash flow
-4.7%
Cash-on-Cash Return
4.6%
Cap rate
0.8%
Rent to Value Ratio
Active
$195,000
3
bds
|
0
ba
|
1,533
sqft
|
built
2008
1245 Verde Trails Dr, Houston, TX 77073
$-126
Cash flow
-3.4%
Cash-on-Cash Return
4.9%
Cap rate
0.9%
Rent to Value Ratio
Active
$1,125,000
4
bds
|
0
ba
|
3,055
sqft
|
built
2003
516 W 9th St, Houston, TX 77007
$748
Cash flow
3.5%
Cash-on-Cash Return
6.5%
Cap rate
0.8%
Rent to Value Ratio
Active
$158,000
2
bds
|
0
ba
|
1,020
sqft
|
built
1982
7575 Cambridge St, Houston, TX 77054
$-335
Cash flow
-11.1%
Cash-on-Cash Return
3.1%
Cap rate
1.0%
Rent to Value Ratio

Active
$142,500
2
bds
|
0
ba
|
1,046
sqft
|
built
1983
2121 Hepburn St, Houston, TX 77054
$-181
Cash flow
-6.6%
Cash-on-Cash Return
4.2%
Cap rate
1.0%
Rent to Value Ratio
Active
$119,500
1
bds
|
0
ba
|
729
sqft
|
built
1980
7950 N Stadium Dr, Houston, TX 77030
$-133
Cash flow
-5.8%
Cash-on-Cash Return
4.3%
Cap rate
1.2%
Rent to Value Ratio
Active
$259,000
2
bds
|
0
ba
|
1,427
sqft
|
built
1981
5150 Hidalgo St, Houston, TX 77056
$-1,390
Cash flow
-28.0%
Cash-on-Cash Return
-0.8%
Cap rate
0.9%
Rent to Value Ratio
Active
$485,000
2
bds
|
0
ba
|
1,250
sqft
|
built
1983
2001 Holcombe Blvd, Houston, TX 77030
$-2,282
Cash flow
-24.5%
Cash-on-Cash Return
0.0%
Cap rate
0.5%
Rent to Value Ratio
Active
$210,000
2
bds
|
0
ba
|
1,019
sqft
|
built
1983
2300 Old Spanish Trl, Houston, TX 77054
$-578
Cash flow
-14.4%
Cash-on-Cash Return
2.4%
Cap rate
0.9%
Rent to Value Ratio
Active
$335,000
3
bds
|
0
ba
|
2,178
sqft
|
built
1983
3350 Mc Cue Rd, Houston, TX 77056
$-2,526
Cash flow
-39.3%
Cash-on-Cash Return
-3.4%
Cap rate
0.9%
Rent to Value Ratio
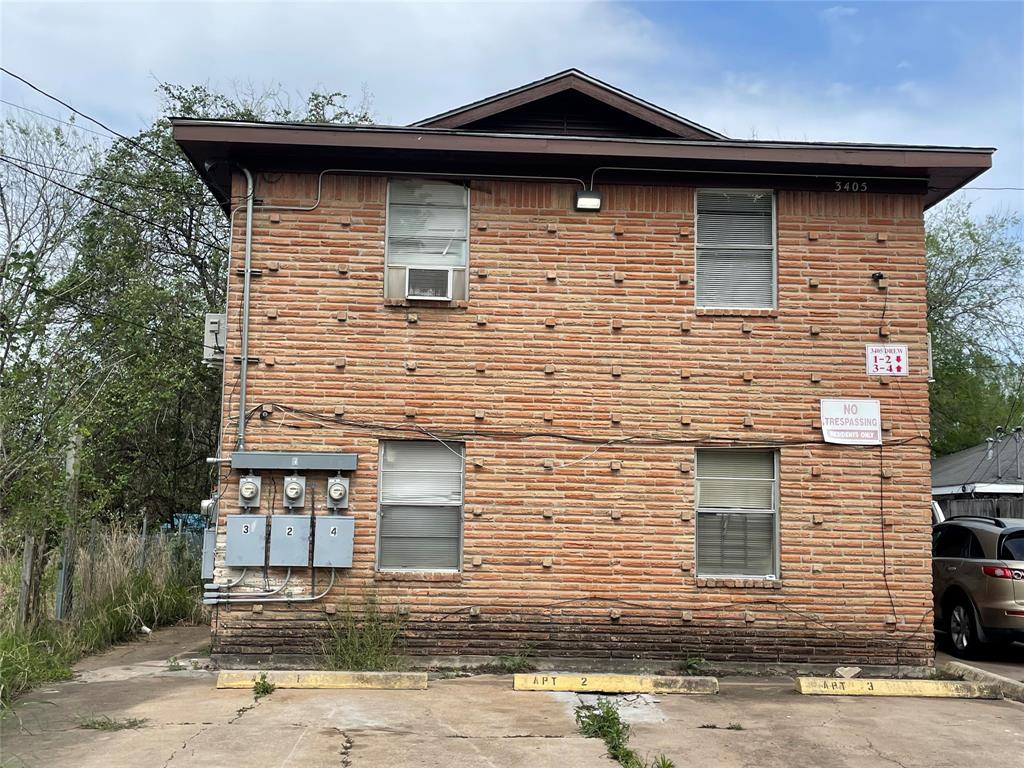
Active
$490,000
2
bds
|
0
ba
|
3,248
sqft
|
built
1964
3405 Drew St, Houston, TX 77004
$-2,256
Cash flow
-24.0%
Cash-on-Cash Return
0.2%
Cap rate
0.2%
Rent to Value Ratio
Active
$730,000
3
bds
|
0
ba
|
3,222
sqft
|
built
2023
1611 W 22nd St, Houston, TX 77008
$-191
Cash flow
-1.4%
Cash-on-Cash Return
5.4%
Cap rate
0.9%
Rent to Value Ratio
Active
$477,000
3
bds
|
0
ba
|
1,973
sqft
|
built
2006
1307 W 25th St, Houston, TX 77008
$-887
Cash flow
-9.7%
Cash-on-Cash Return
3.4%
Cap rate
0.7%
Rent to Value Ratio
Active
$324,900
2
bds
|
0
ba
|
1,129
sqft
|
built
2006
1010 Rosine St, Houston, TX 77019
$-1,345
Cash flow
-21.6%
Cash-on-Cash Return
0.7%
Cap rate
0.7%
Rent to Value Ratio

Pending
$245,000
3
bds
|
0
ba
|
1,203
sqft
|
built
1983
13506 Bridgepath Cv, Houston, TX 77041
$-327
Cash flow
-7.0%
Cash-on-Cash Return
4.1%
Cap rate
0.7%
Rent to Value Ratio
Active
$1,162,000
3
bds
|
0
ba
|
3,880
sqft
|
built
1982
17 Pine Briar Cir, Houston, TX 77056
$-3,305
Cash flow
-14.8%
Cash-on-Cash Return
2.3%
Cap rate
0.5%
Rent to Value Ratio
Active
$2,900,000
5
bds
|
0
ba
|
7,642
sqft
|
built
1993
8618 Stable Crest Blvd, Houston, TX 77024
$-14,312
Cash flow
-25.7%
Cash-on-Cash Return
-0.2%
Cap rate
0.3%
Rent to Value Ratio
Active
$1,595,000
bds
|
0
ba
|
1,280
sqft
|
built
1959
1914 Mc Duffie St, Houston, TX 77019
$-9,047
Cash flow
-29.6%
Cash-on-Cash Return
-1.1%
Cap rate
0.1%
Rent to Value Ratio

Active
$228,000
1
bds
|
0
ba
|
869
sqft
|
built
2003
1901 Post Oak Blvd, Houston, TX 77056
$-667
Cash flow
-15.3%
Cash-on-Cash Return
2.2%
Cap rate
0.9%
Rent to Value Ratio
Active
$107,500
2
bds
|
0
ba
|
1,104
sqft
|
built
1950
4708 Engleford St, Houston, TX 77026
$480
Cash flow
23.3%
Cash-on-Cash Return
11.0%
Cap rate
1.5%
Rent to Value Ratio

Active
$579,000
3
bds
|
0
ba
|
1,372
sqft
|
built
1945
544 W 28th St, Houston, TX 77008
$-2,343
Cash flow
-21.1%
Cash-on-Cash Return
0.8%
Cap rate
0.3%
Rent to Value Ratio
Active
$289,000
3
bds
|
0
ba
|
2,362
sqft
|
built
1977
10731 Sageberry Dr, Houston, TX 77089
$-378
Cash flow
-6.8%
Cash-on-Cash Return
4.1%
Cap rate
0.8%
Rent to Value Ratio