Houston, TX Investment Properties for Sale
Browse homes for sale and investment properties in Houston, TX. Refine your search by price, property type, or more.
Best cash flowing properties in Houston, TX
Active
$121,000
3
bds
|
0
ba
|
1,500
sqft
|
built
1979
8529 Hearth Dr, Houston, TX 77054
$-275
Cash flow
-11.9%
Cash-on-Cash Return
3.6%
Cap rate
1.3%
Rent to Value Ratio
Active
$110,000
2
bds
|
0
ba
|
804
sqft
|
built
1984
2121 El Paseo St, Houston, TX 77054
$-335
Cash flow
-15.9%
Cash-on-Cash Return
2.6%
Cap rate
1.2%
Rent to Value Ratio
8,456 out of 8,896 properties for sale in Houston, TX
Limited Results Shown
Create a free account, or log in to reveal all property listings and enjoy the complete experience.
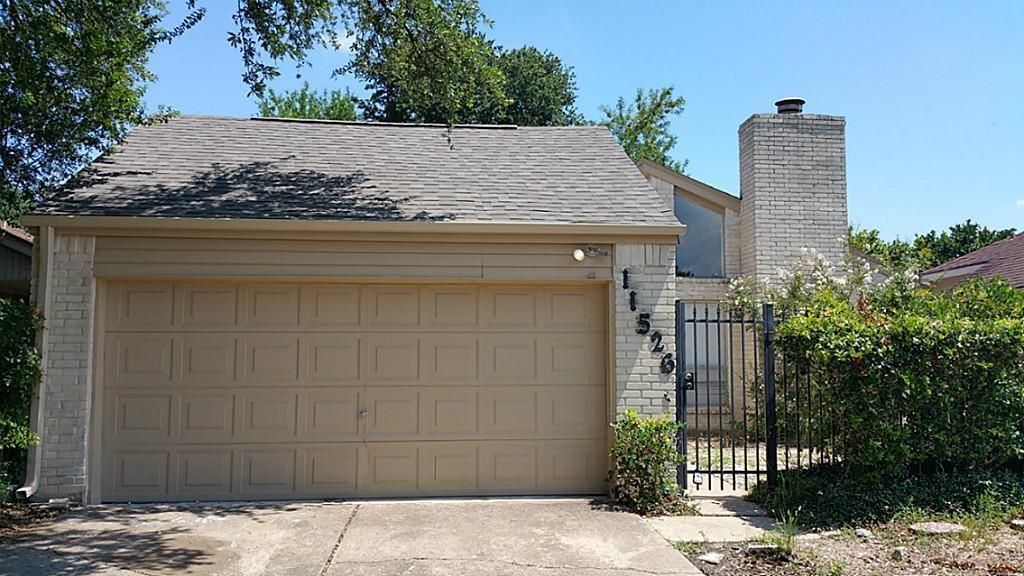
Active
$245,900
3
bds
|
0
ba
|
1,727
sqft
|
built
1976
11526 Sands Point Dr, Houston, TX 77072
$-647
Cash flow
-13.7%
Cash-on-Cash Return
3.1%
Cap rate
0.7%
Rent to Value Ratio
Active
$355,000
3
bds
|
0
ba
|
1,694
sqft
|
built
2023
2911 Paul Quinn St, Houston, TX 77091
$-691
Cash flow
-10.2%
Cash-on-Cash Return
3.9%
Cap rate
0.7%
Rent to Value Ratio
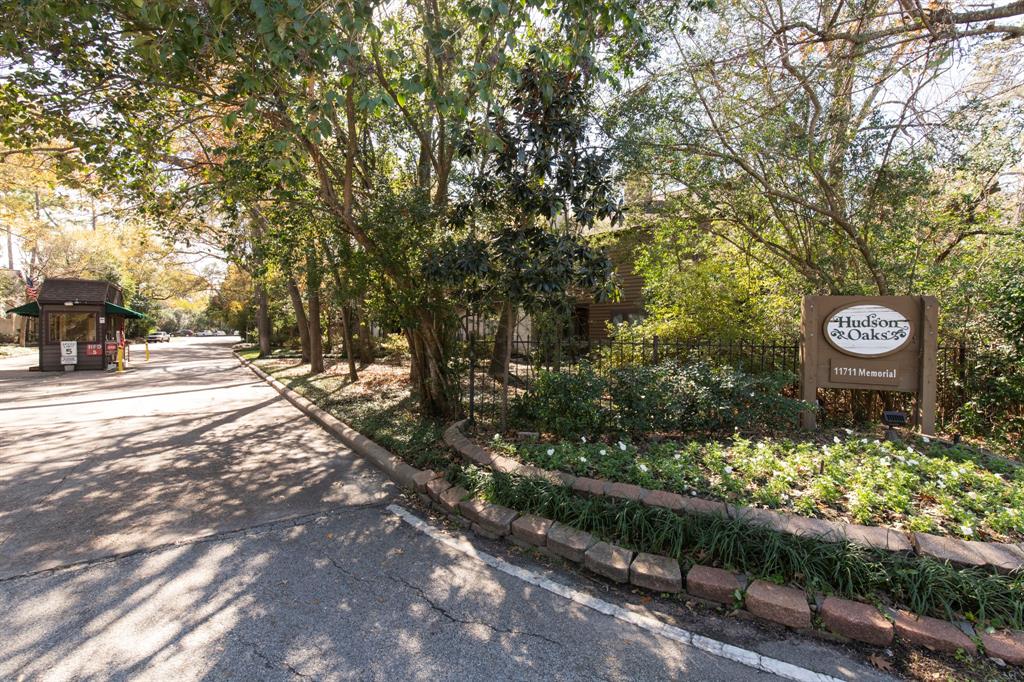
Active
$199,000
1
bds
|
0
ba
|
1,120
sqft
|
built
1977
11711 Memorial Dr, Houston, TX 77024
$-757
Cash flow
-19.8%
Cash-on-Cash Return
1.7%
Cap rate
0.9%
Rent to Value Ratio
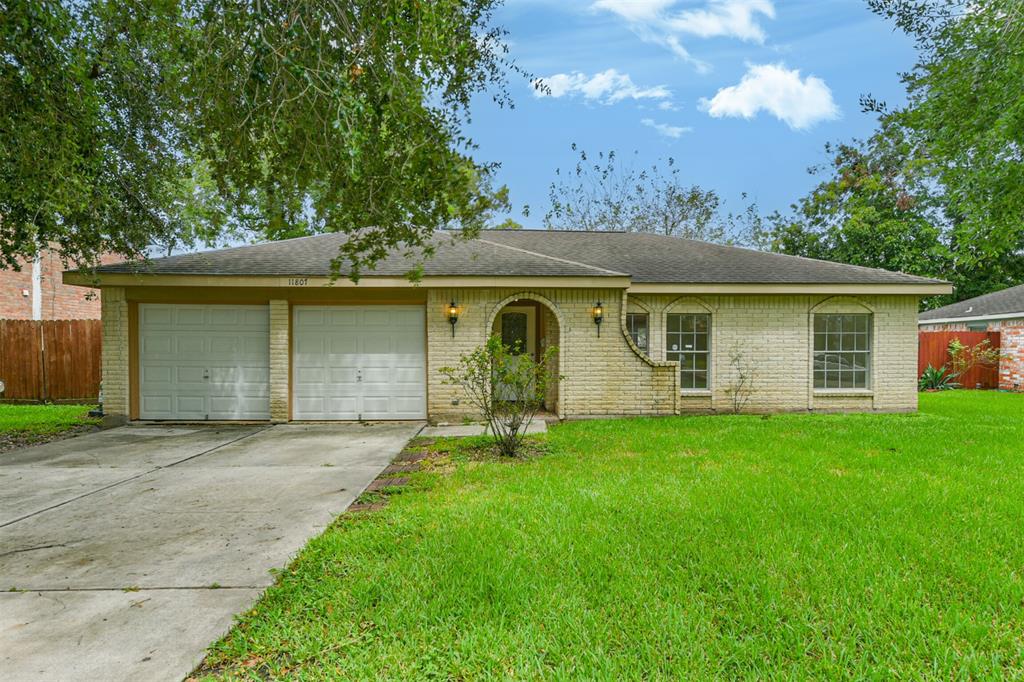
Active
$285,000
4
bds
|
0
ba
|
2,047
sqft
|
built
1973
11807 Sagecliff Dr, Houston, TX 77089
$-404
Cash flow
-7.4%
Cash-on-Cash Return
4.6%
Cap rate
0.8%
Rent to Value Ratio
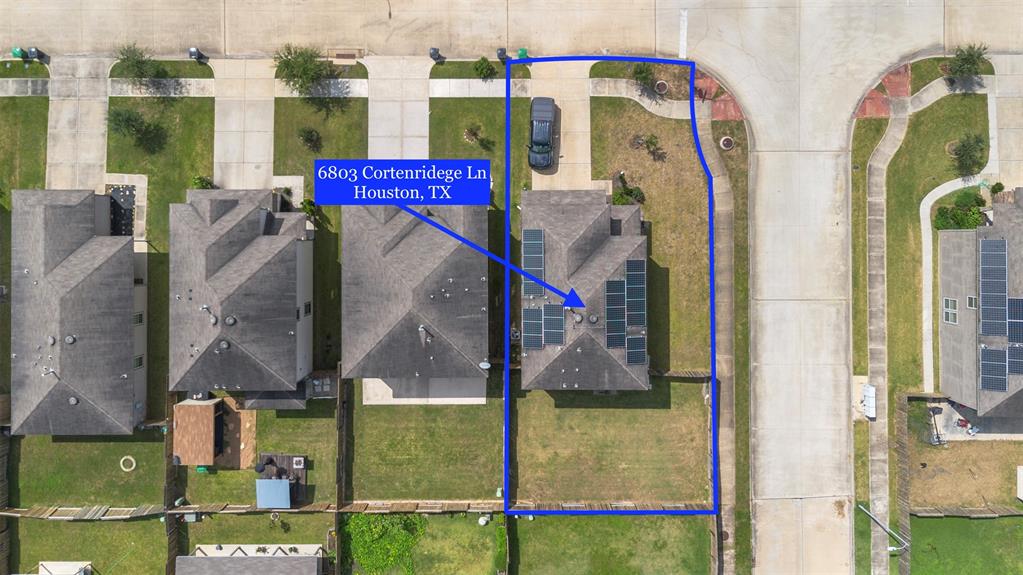
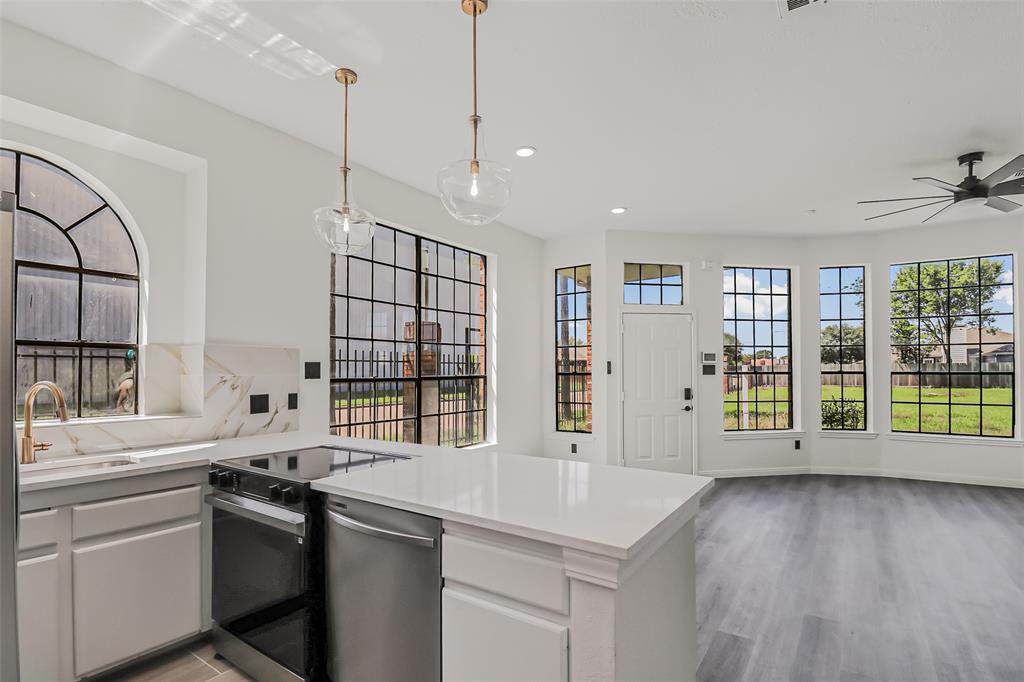
Active
$279,000
3
bds
|
0
ba
|
2,085
sqft
|
built
2017
6803 Cortenridge Ln, Houston, TX 77048
$-591
Cash flow
-11.1%
Cash-on-Cash Return
3.7%
Cap rate
0.8%
Rent to Value Ratio
Active
$121,000
3
bds
|
0
ba
|
1,500
sqft
|
built
1979
8529 Hearth Dr, Houston, TX 77054
$-275
Cash flow
-11.9%
Cash-on-Cash Return
3.6%
Cap rate
1.3%
Rent to Value Ratio
Active
$244,999
3
bds
|
0
ba
|
1,468
sqft
|
built
1984
8888 Benning Dr, Houston, TX 77031
$-680
Cash flow
-14.5%
Cash-on-Cash Return
3.0%
Cap rate
0.7%
Rent to Value Ratio
Active
$699,000
3
bds
|
0
ba
|
3,384
sqft
|
built
1993
2727 S Southern Oaks Dr, Houston, TX 77068
$-1,848
Cash flow
-13.8%
Cash-on-Cash Return
3.1%
Cap rate
0.6%
Rent to Value Ratio
Active
$110,000
2
bds
|
0
ba
|
804
sqft
|
built
1984
2121 El Paseo St, Houston, TX 77054
$-335
Cash flow
-15.9%
Cash-on-Cash Return
2.6%
Cap rate
1.2%
Rent to Value Ratio
Active
$143,000
3
bds
|
0
ba
|
1,208
sqft
|
built
1965
2681 Marilee Ln, Houston, TX 77057
$-489
Cash flow
-17.8%
Cash-on-Cash Return
2.2%
Cap rate
1.3%
Rent to Value Ratio
Active
$269,000
3
bds
|
0
ba
|
1,472
sqft
|
built
2000
13418 Croquet Ln, Houston, TX 77085
$-580
Cash flow
-11.2%
Cash-on-Cash Return
3.7%
Cap rate
0.7%
Rent to Value Ratio
Active
$370,500
4
bds
|
0
ba
|
1,986
sqft
|
built
1990
9714 Arrowgrass Dr, Houston, TX 77064
$-643
Cash flow
-9.1%
Cash-on-Cash Return
4.2%
Cap rate
0.7%
Rent to Value Ratio
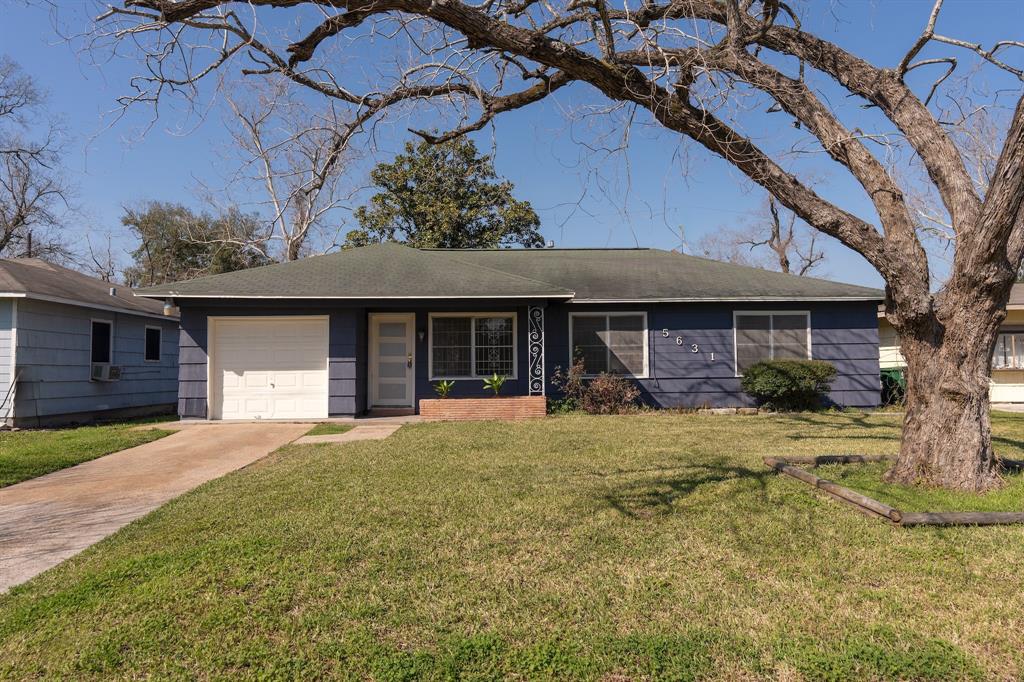
Active
$245,000
3
bds
|
0
ba
|
1,568
sqft
|
built
1955
5631 Westover St, Houston, TX 77033
$-551
Cash flow
-11.7%
Cash-on-Cash Return
3.6%
Cap rate
0.6%
Rent to Value Ratio
Active
$289,000
3
bds
|
0
ba
|
2,007
sqft
|
built
1975
4406 Belle Hollow Dr, Houston, TX 77084
$-502
Cash flow
-9.1%
Cash-on-Cash Return
4.2%
Cap rate
0.8%
Rent to Value Ratio
Active
$1,900,000
2
bds
|
0
ba
|
7,016
sqft
|
built
1950
2011 Binz St, Houston, TX 77004
$-11,953
Cash flow
-32.8%
Cash-on-Cash Return
-1.3%
Cap rate
0.1%
Rent to Value Ratio
Active
$775,000
6
bds
|
0
ba
|
432
sqft
|
built
1930
3706 Delano St, Houston, TX 77004
$-3,854
Cash flow
-25.9%
Cash-on-Cash Return
0.3%
Cap rate
0.1%
Rent to Value Ratio
Active
$165,000
2
bds
|
3
ba
|
1,664
sqft
|
built
1963
3300 Yorktown St, Houston, TX 77056
$-1,198
Cash flow
-37.9%
Cash-on-Cash Return
-2.4%
Cap rate
1.2%
Rent to Value Ratio
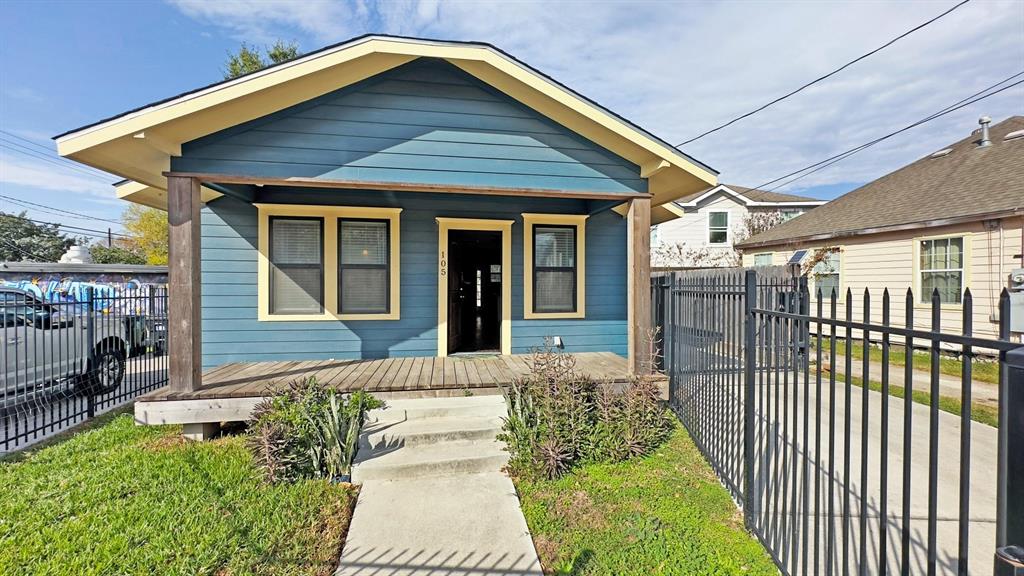
Active
$599,000
2
bds
|
0
ba
|
1,036
sqft
|
built
1938
105 N Eastwood St, Houston, TX 77011
$-2,572
Cash flow
-22.4%
Cash-on-Cash Return
1.1%
Cap rate
0.3%
Rent to Value Ratio
Active
$679,900
5
bds
|
0
ba
|
2,275
sqft
|
built
1947
7610 Almeda Genoa Rd, Houston, TX 77075
$-2,765
Cash flow
-21.2%
Cash-on-Cash Return
1.4%
Cap rate
0.3%
Rent to Value Ratio
Active
$524,999
3
bds
|
0
ba
|
2,209
sqft
|
built
1959
5535 Spellman Rd, Houston, TX 77096
$-1,791
Cash flow
-17.8%
Cash-on-Cash Return
2.2%
Cap rate
0.5%
Rent to Value Ratio
Active
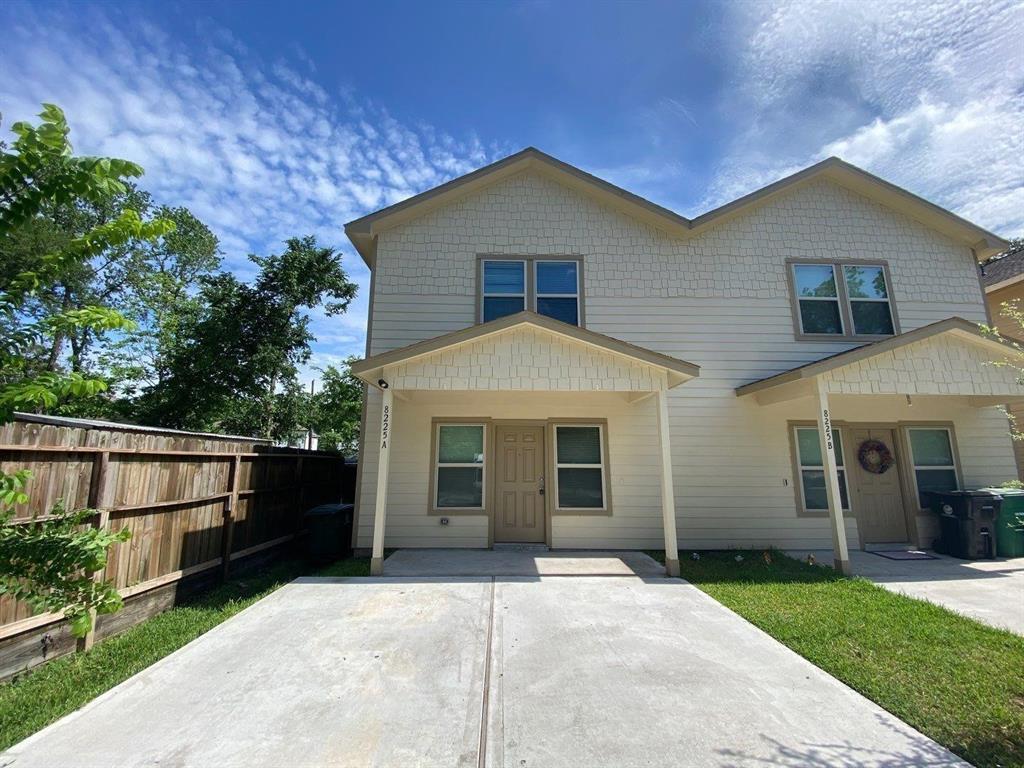
$340,000
3
bds
|
0
ba
|
3,360
sqft
|
built
2020
8225 Madera Rd, Houston, TX 77078
$-1,291
Cash flow
-19.8%
Cash-on-Cash Return
1.7%
Cap rate
0.5%
Rent to Value Ratio
Active
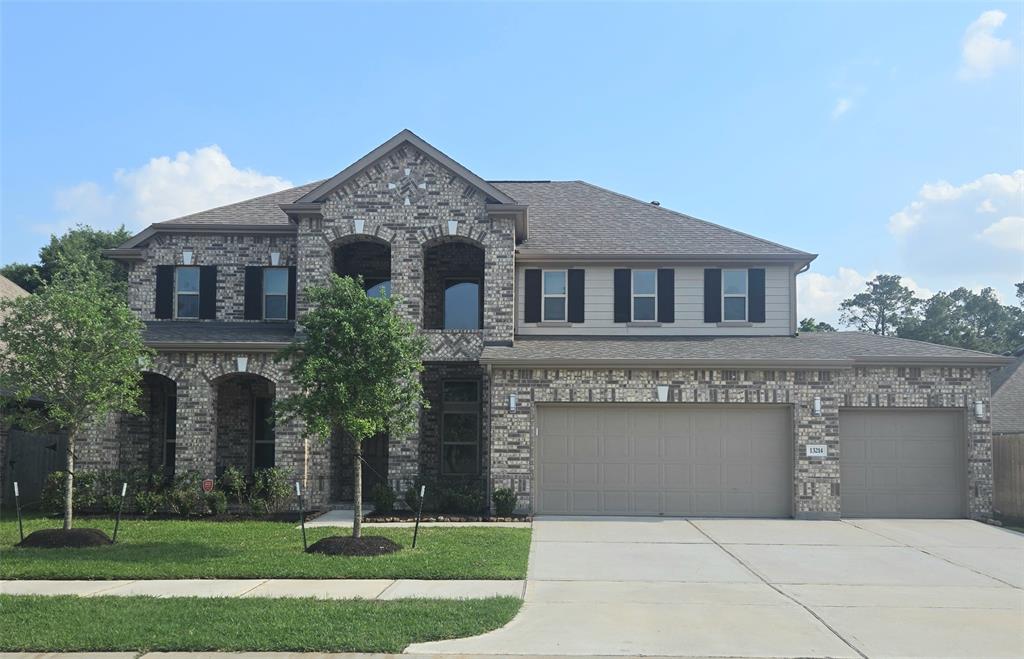
$599,900
5
bds
|
0
ba
|
3,861
sqft
|
built
2020
13214 Westmont Heights Ln, Houston, TX 77044
$-2,254
Cash flow
-19.6%
Cash-on-Cash Return
1.8%
Cap rate
0.6%
Rent to Value Ratio
Active
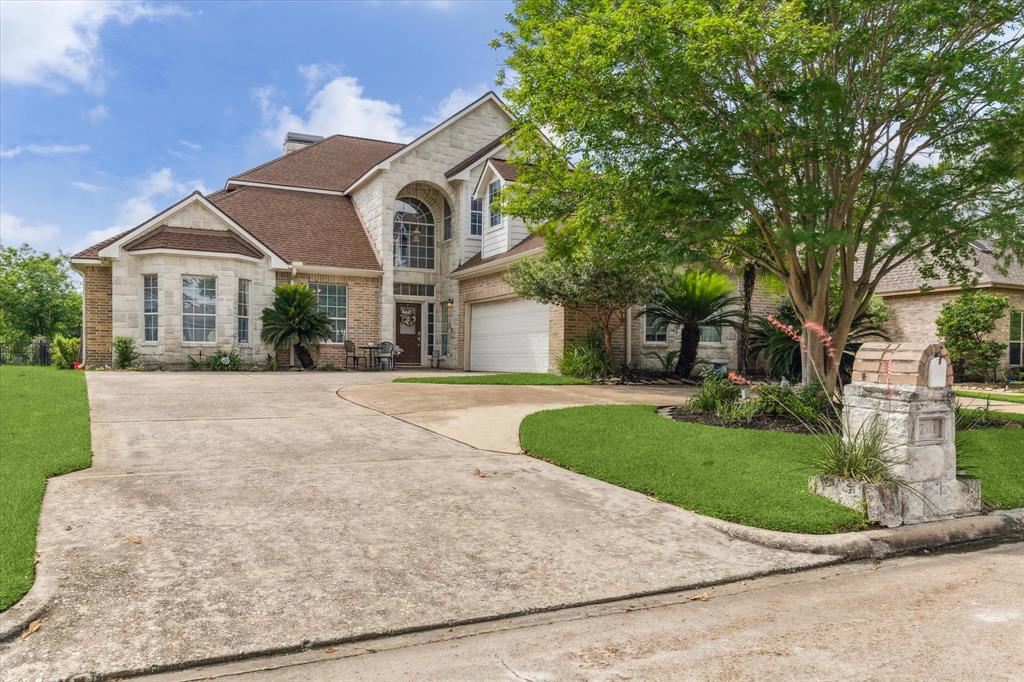
$599,990
4
bds
|
0
ba
|
3,291
sqft
|
built
2004
7511 Cart Gate Dr, Houston, TX 77095
$-2,007
Cash flow
-17.5%
Cash-on-Cash Return
2.3%
Cap rate
0.5%
Rent to Value Ratio
Active
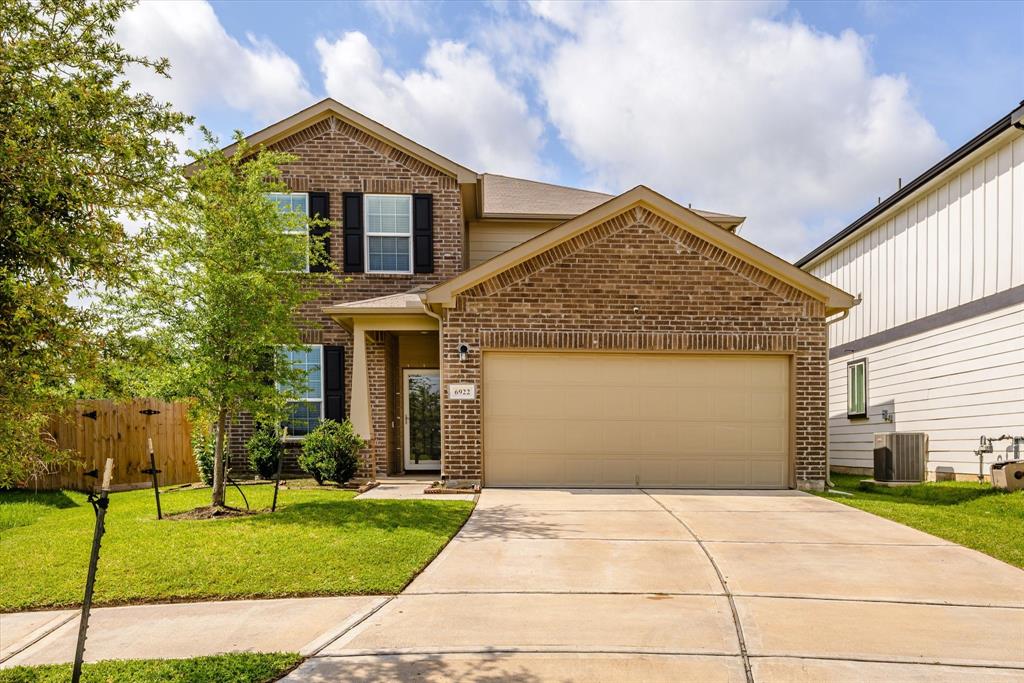
$375,000
4
bds
|
0
ba
|
2,592
sqft
|
built
2021
6922 Telean St, Houston, TX 77075
$-1,106
Cash flow
-15.4%
Cash-on-Cash Return
2.7%
Cap rate
0.7%
Rent to Value Ratio
Active
$1,250,000
1
bds
|
0
ba
|
3,752
sqft
|
built
1930
7124 Avenue F, Houston, TX 77011
$-4,622
Cash flow
-19.3%
Cash-on-Cash Return
1.8%
Cap rate
0.2%
Rent to Value Ratio
Active
$420,000
4
bds
|
0
ba
|
3,037
sqft
|
built
1995
3231 Shadywind Dr, Houston, TX 77082
$-1,099
Cash flow
-13.7%
Cash-on-Cash Return
3.1%
Cap rate
0.7%
Rent to Value Ratio
Active
$289,000
2
bds
|
0
ba
|
1,543
sqft
|
built
1977
336 Litchfield Ln, Houston, TX 77024
$-924
Cash flow
-16.7%
Cash-on-Cash Return
2.4%
Cap rate
0.9%
Rent to Value Ratio
Active
$325,000
6
bds
|
0
ba
|
720
sqft
|
built
1960
1715 New Mexico St, Houston, TX 77029
$-1,331
Cash flow
-21.4%
Cash-on-Cash Return
1.4%
Cap rate
0.3%
Rent to Value Ratio
Active
$239,999
1
bds
|
0
ba
|
869
sqft
|
built
2003
1901 Post Oak Blvd, Houston, TX 77056
$-805
Cash flow
-17.5%
Cash-on-Cash Return
2.3%
Cap rate
0.8%
Rent to Value Ratio
Active
$159,000
1
bds
|
0
ba
|
794
sqft
|
built
1985
3525 Sage Rd, Houston, TX 77056
$-817
Cash flow
-26.8%
Cash-on-Cash Return
0.1%
Cap rate
1.0%
Rent to Value Ratio
Active
$237,750
3
bds
|
0
ba
|
2,339
sqft
|
built
1983
192 Wilcrest Dr, Houston, TX 77042
$-1,012
Cash flow
-22.2%
Cash-on-Cash Return
1.2%
Cap rate
1.0%
Rent to Value Ratio
Active
$2,500,000
8
bds
|
0
ba
|
3,547
sqft
|
built
2007
10405 Gulf Meadows Dr, Houston, TX 77075
$-11,831
Cash flow
-24.7%
Cash-on-Cash Return
0.6%
Cap rate
0.2%
Rent to Value Ratio
Active
$975,000
3
bds
|
0
ba
|
2,734
sqft
|
built
2006
814 Nicholson St, Houston, TX 77007
$-2,650
Cash flow
-14.2%
Cash-on-Cash Return
3.0%
Cap rate
0.6%
Rent to Value Ratio
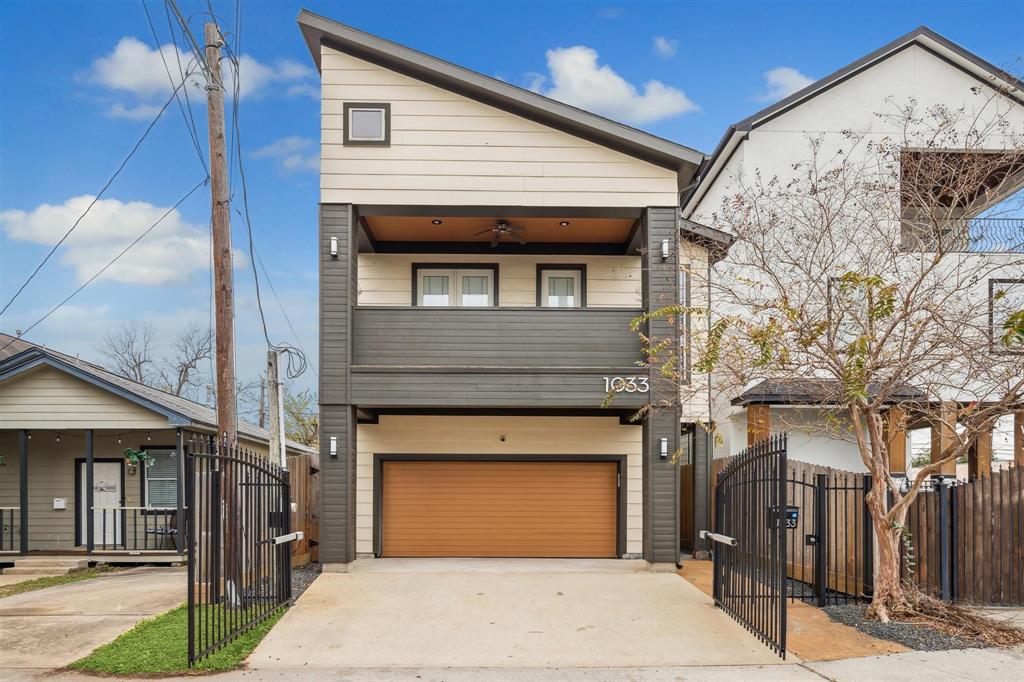
Active
$679,900
3
bds
|
0
ba
|
2,520
sqft
|
built
2008
1033 Herkimer St, Houston, TX 77008
$-1,861
Cash flow
-14.3%
Cash-on-Cash Return
3.0%
Cap rate
0.6%
Rent to Value Ratio
Active
$695,000
3
bds
|
0
ba
|
2,557
sqft
|
built
2004
4303 Blossom St, Houston, TX 77007
$-2,200
Cash flow
-16.5%
Cash-on-Cash Return
2.5%
Cap rate
0.5%
Rent to Value Ratio
Active
$555,000
4
bds
|
0
ba
|
3,182
sqft
|
built
1990
1803 Orchard Country Ln, Houston, TX 77062
$-1,169
Cash flow
-11.0%
Cash-on-Cash Return
3.8%
Cap rate
0.7%
Rent to Value Ratio
Active
$460,000
2
bds
|
0
ba
|
937
sqft
|
built
1976
8100 Creekbend Dr, Houston, TX 77071
$-1,967
Cash flow
-22.3%
Cash-on-Cash Return
1.2%
Cap rate
0.3%
Rent to Value Ratio
Active
$3,350,000
4
bds
|
0
ba
|
6,366
sqft
|
built
1984
2003 Arrowwood Cir N, Houston, TX 77063
$-17,047
Cash flow
-26.5%
Cash-on-Cash Return
0.2%
Cap rate
0.1%
Rent to Value Ratio
Active
$419,900
4
bds
|
0
ba
|
2,851
sqft
|
built
2005
13614 Caney Springs Ln, Houston, TX 77044
$-1,185
Cash flow
-14.7%
Cash-on-Cash Return
2.9%
Cap rate
0.6%
Rent to Value Ratio

Active
$899,000
5
bds
|
0
ba
|
3,616
sqft
|
built
2023
304 Milby St, Houston, TX 77003
$-2,117
Cash flow
-12.3%
Cash-on-Cash Return
3.5%
Cap rate
0.6%
Rent to Value Ratio