Houston, TX Investment Properties for Sale
Browse homes for sale and investment properties in Houston, TX. Refine your search by price, property type, or more.
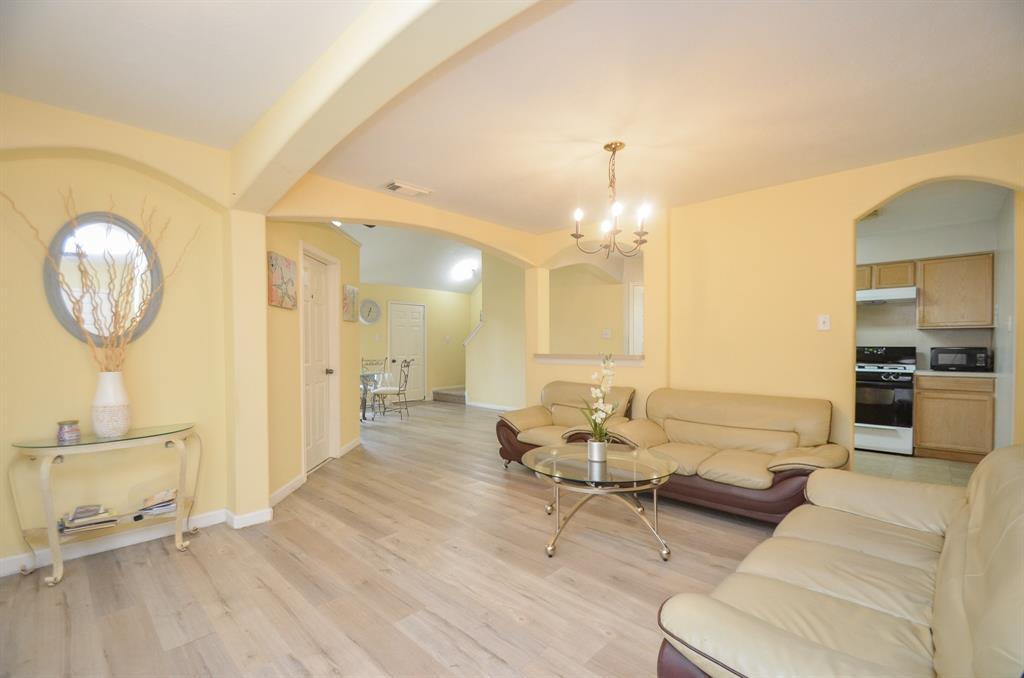
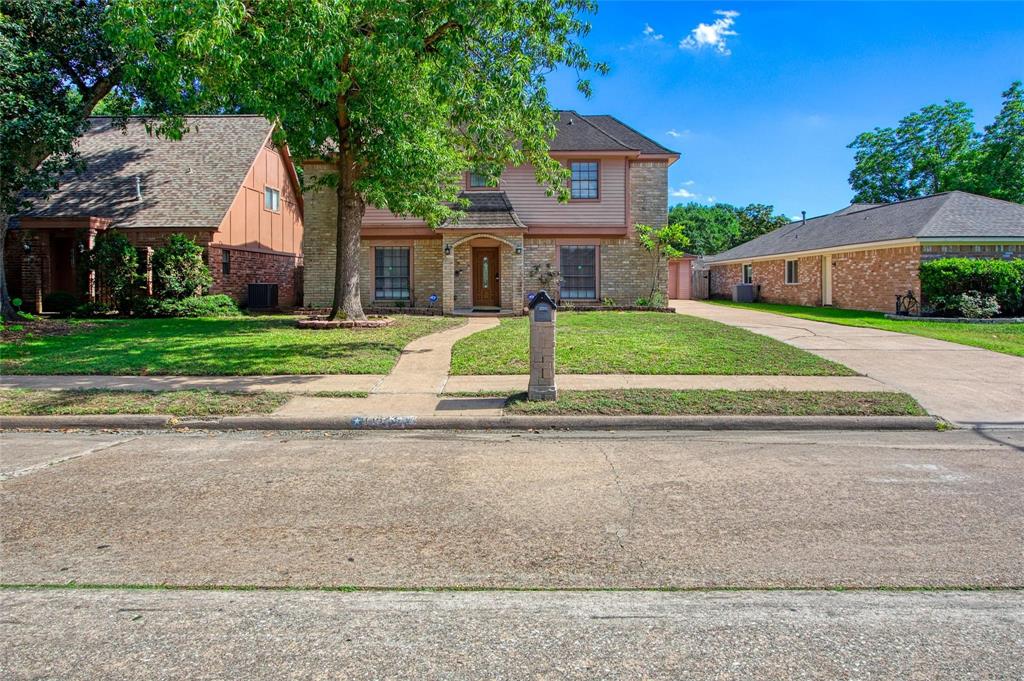
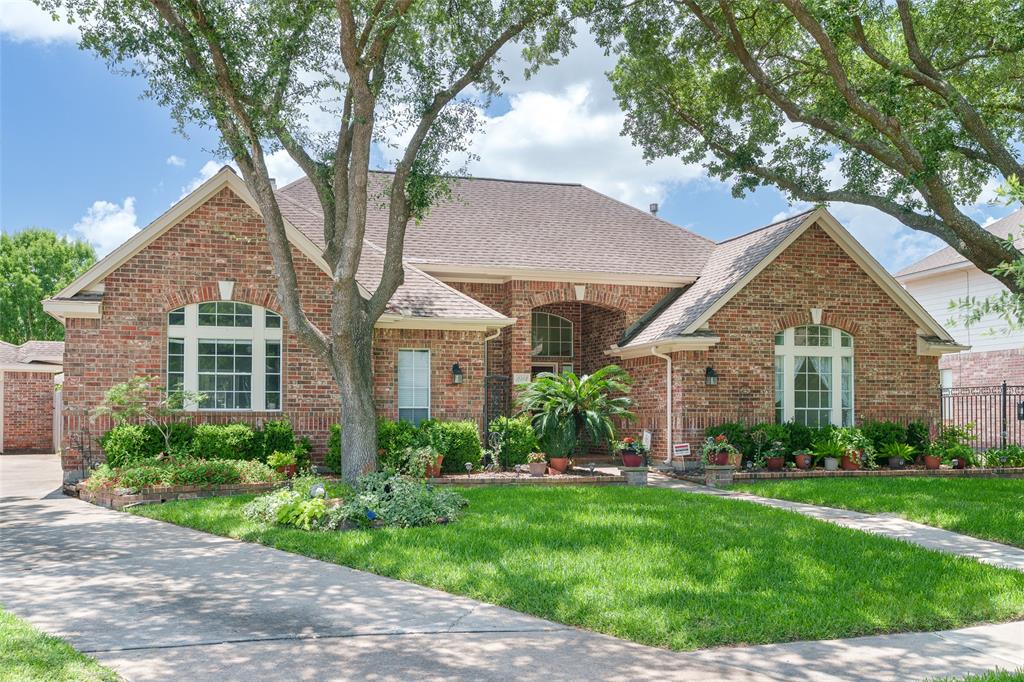
Best cash flowing properties in Houston, TX
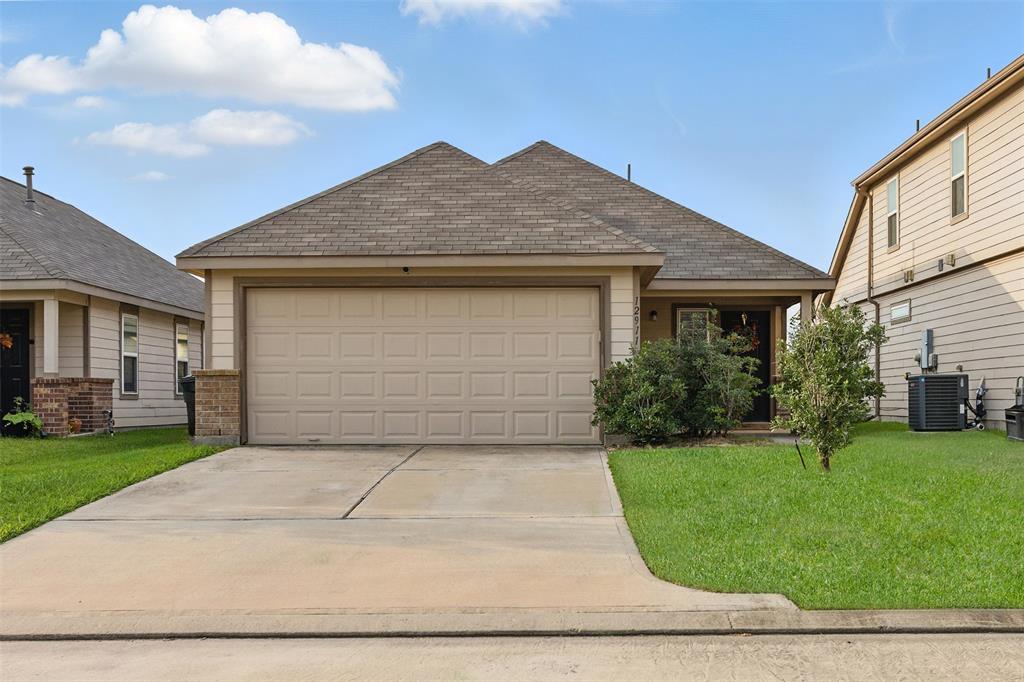
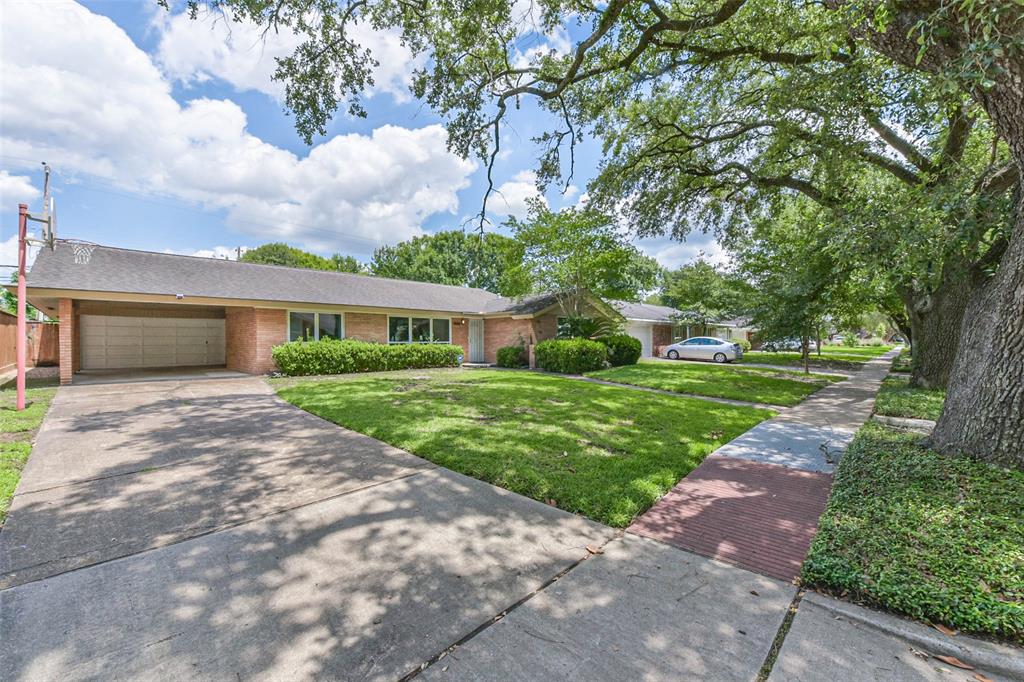
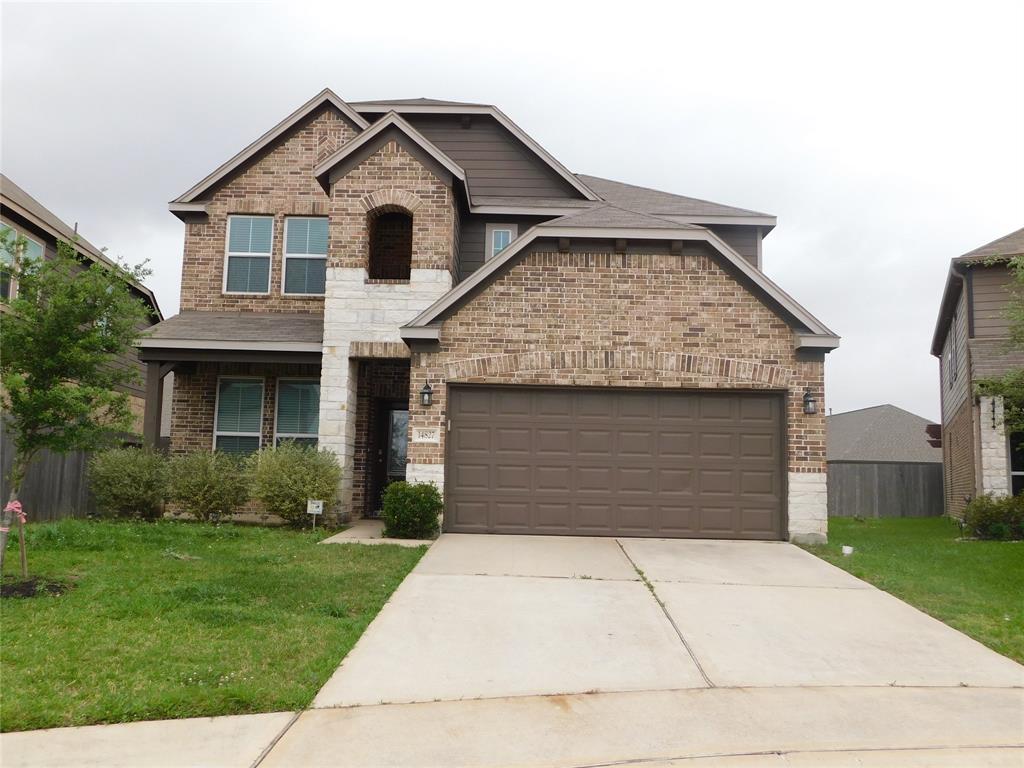
Active
$299,900
3
bds
|
0
ba
|
1,978
sqft
|
built
1979
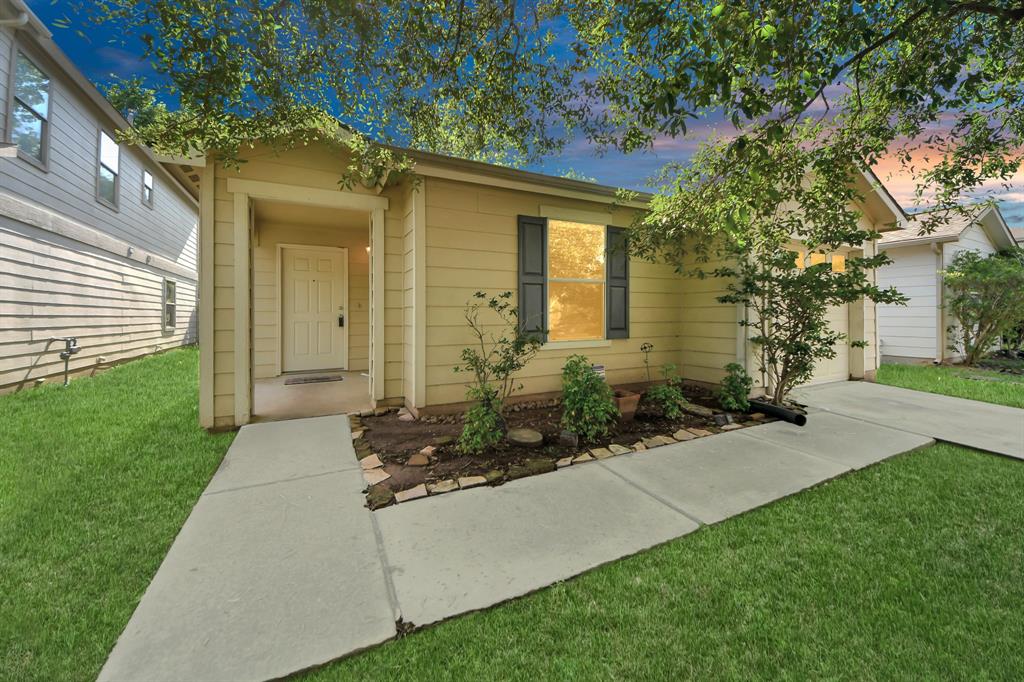
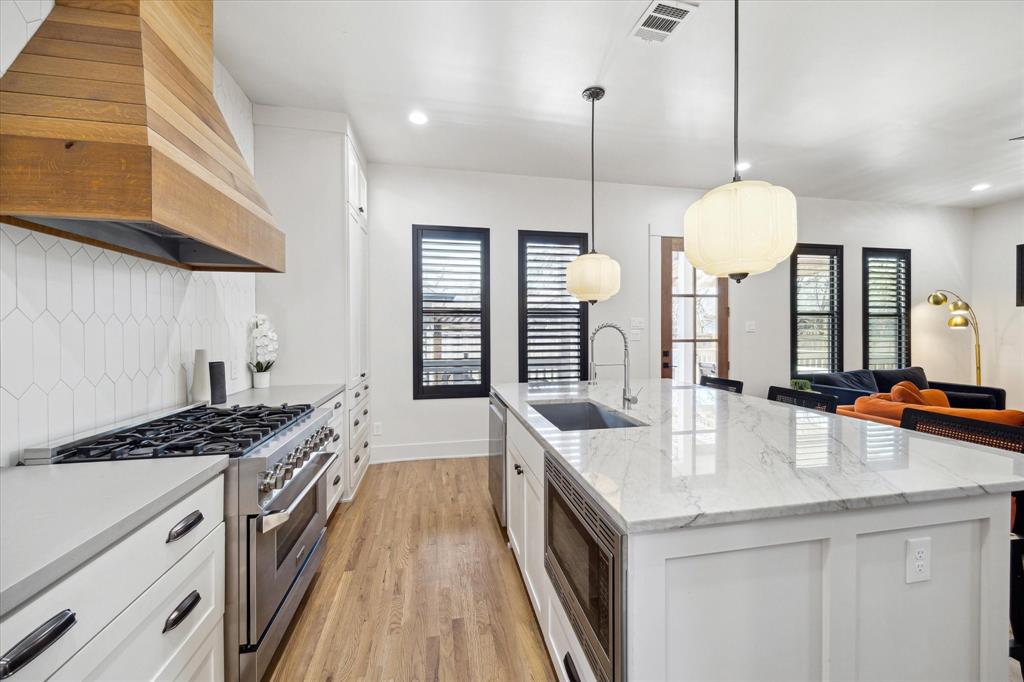
14688 Perthshire Rd, Houston, TX 77079
$596
Cash flow
10.4%
Cash-on-Cash Return
8.1%
Cap rate
1.2%
Rent to Value Ratio
Active
$63,900
1
bds
|
0
ba
|
784
sqft
|
built
1981
10211 Sugar Branch Dr, Houston, TX 77036
$435
Cash flow
7.9%
Cash-on-Cash Return
8.2%
Cap rate
1.7%
Rent to Value Ratio
8,456 out of 8,896 properties for sale in Houston, TX
Limited Results Shown
Create a free account, or log in to reveal all property listings and enjoy the complete experience.
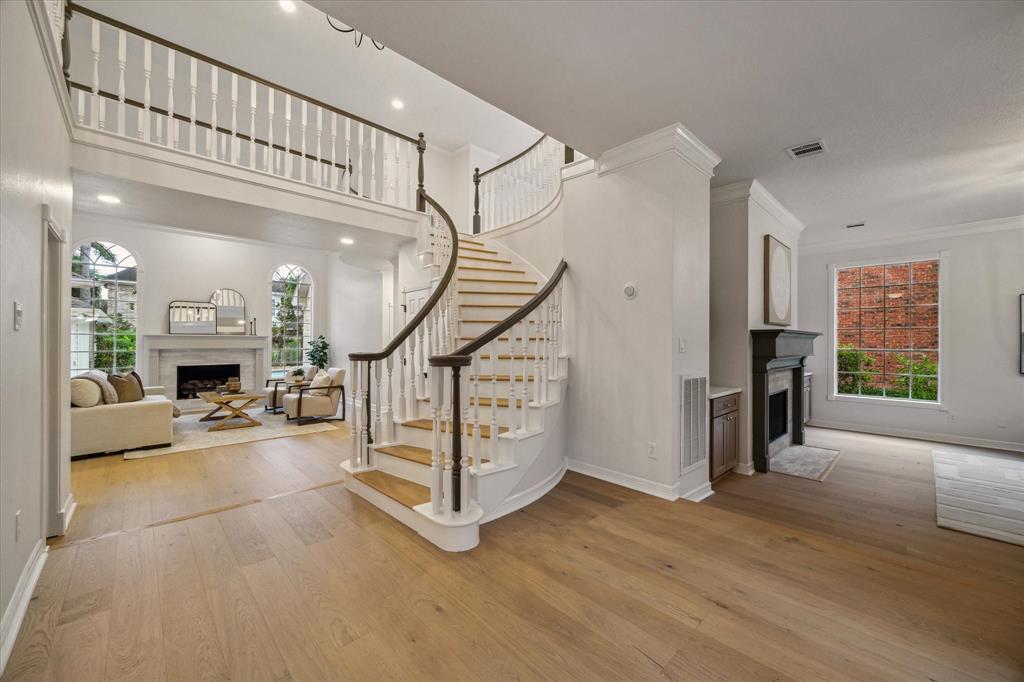
Active
$1,645,000
4
bds
|
0
ba
|
3,913
sqft
|
built
2008
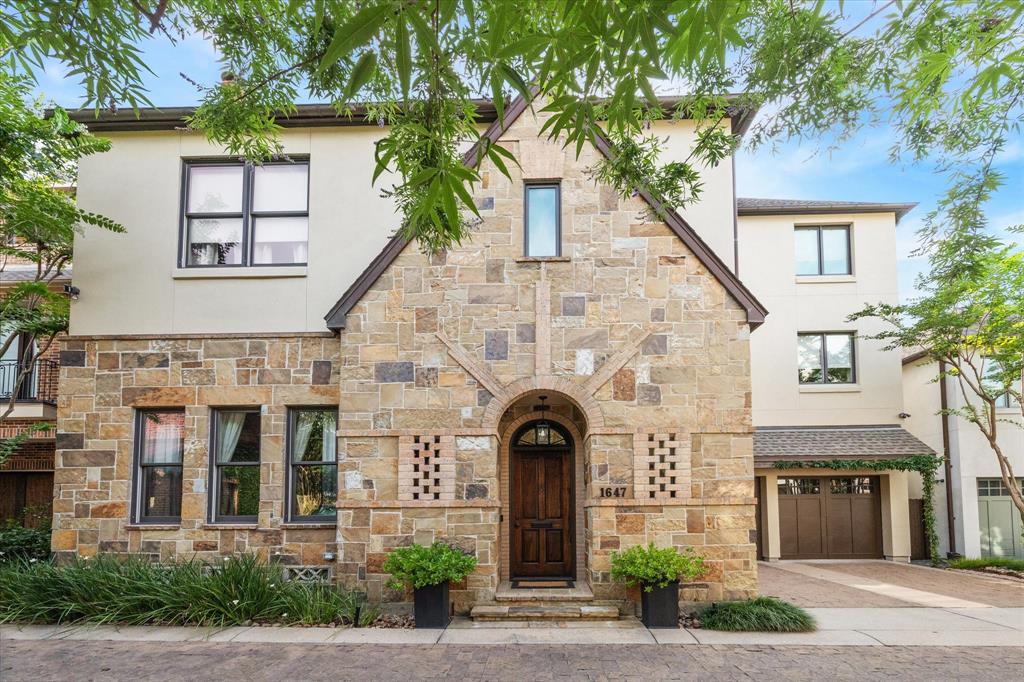
1647 Bissonnet St, Houston, TX 77005
$-4,737
Cash flow
-15.0%
Cash-on-Cash Return
2.2%
Cap rate
0.5%
Rent to Value Ratio
Active
$109,000
1
bds
|
0
ba
|
702
sqft
|
built
1970
4649 Wild Indigo St, Houston, TX 77027
$-255
Cash flow
-12.2%
Cash-on-Cash Return
2.9%
Cap rate
1.3%
Rent to Value Ratio
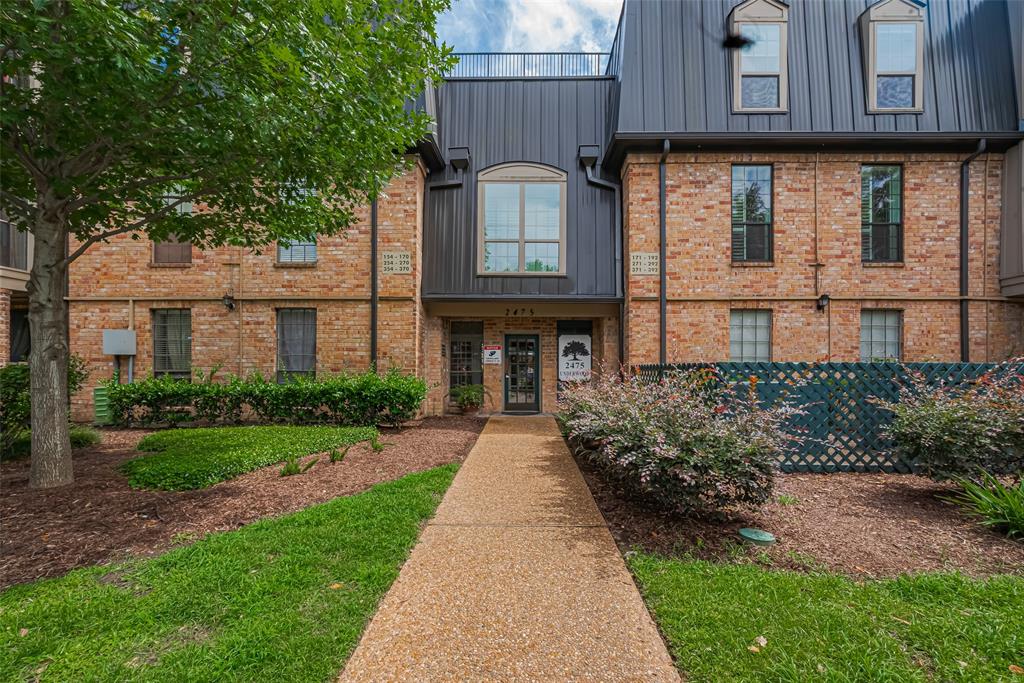
Active
$220,000
2
bds
|
0
ba
|
1,224
sqft
|
built
1977
2475 Underwood St, Houston, TX 77030
$-904
Cash flow
-21.4%
Cash-on-Cash Return
0.7%
Cap rate
0.7%
Rent to Value Ratio
Active
$295,000
3
bds
|
0
ba
|
2,191
sqft
|
built
2005
10807 Tobar Falls Cir, Houston, TX 77064
$-506
Cash flow
-8.9%
Cash-on-Cash Return
3.6%
Cap rate
0.7%
Rent to Value Ratio
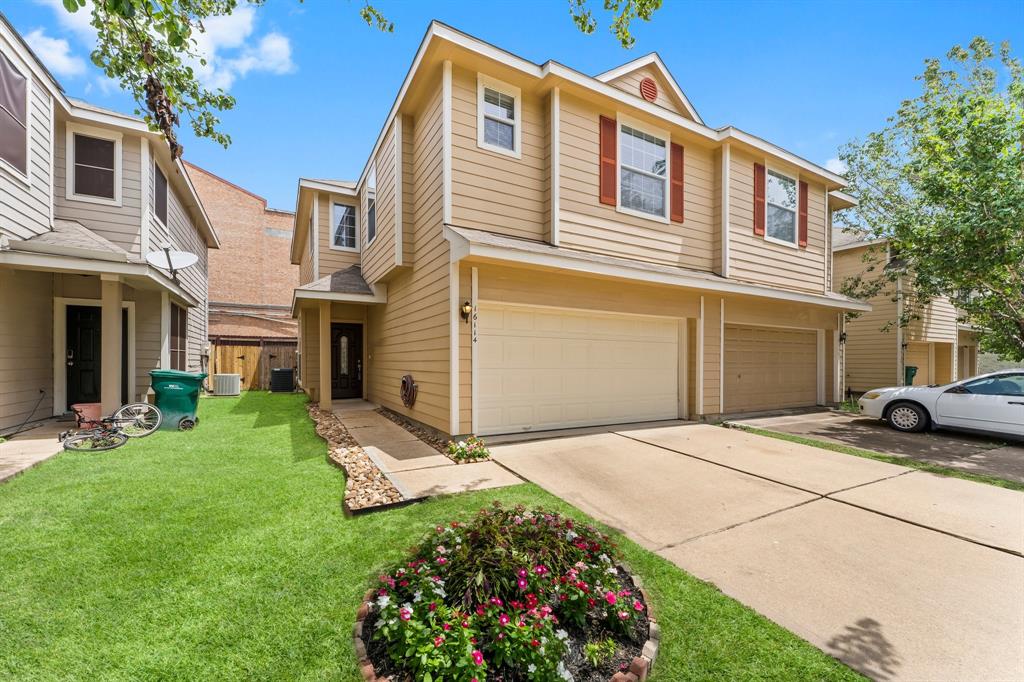
Active
$215,000
3
bds
|
0
ba
|
1,619
sqft
|
built
2004
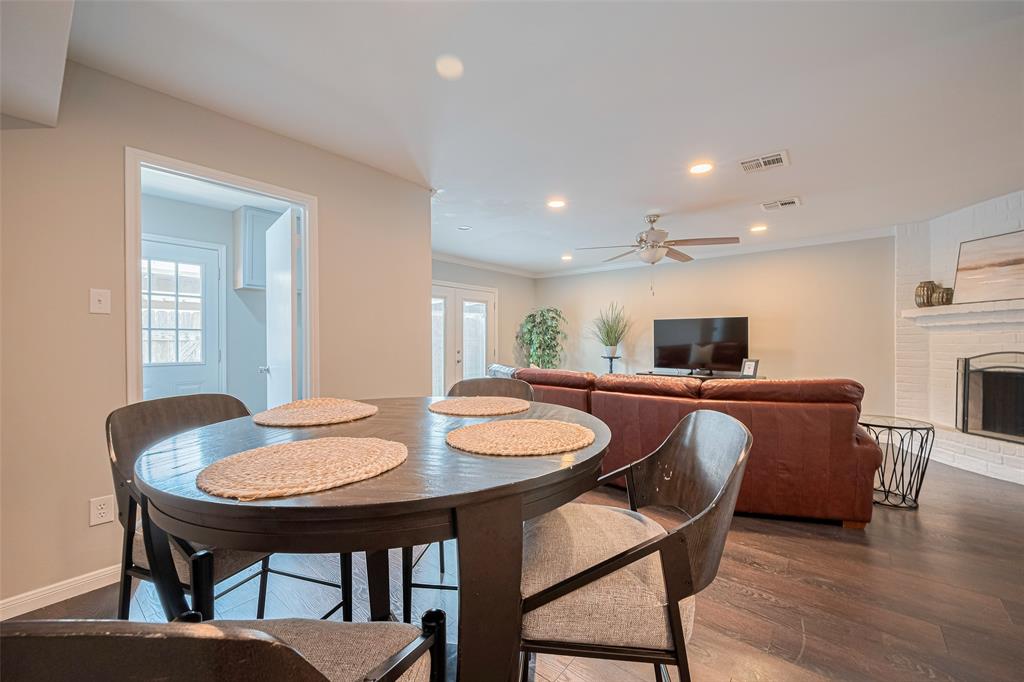
16114 Market Garden Ln, Houston, TX 77084
$163
Cash flow
4.0%
Cash-on-Cash Return
6.6%
Cap rate
0.9%
Rent to Value Ratio
Active
$599,000
3
bds
|
0
ba
|
2,538
sqft
|
built
2021
10914 Brambling Wood Dr, Houston, TX 77043
$122
Cash flow
1.1%
Cash-on-Cash Return
5.9%
Cap rate
0.8%
Rent to Value Ratio
Active
$240,000
3
bds
|
0
ba
|
1,600
sqft
|
built
2018
12911 Italian Cypress Trl, Houston, TX 77044
$-509
Cash flow
-11.1%
Cash-on-Cash Return
3.1%
Cap rate
0.8%
Rent to Value Ratio
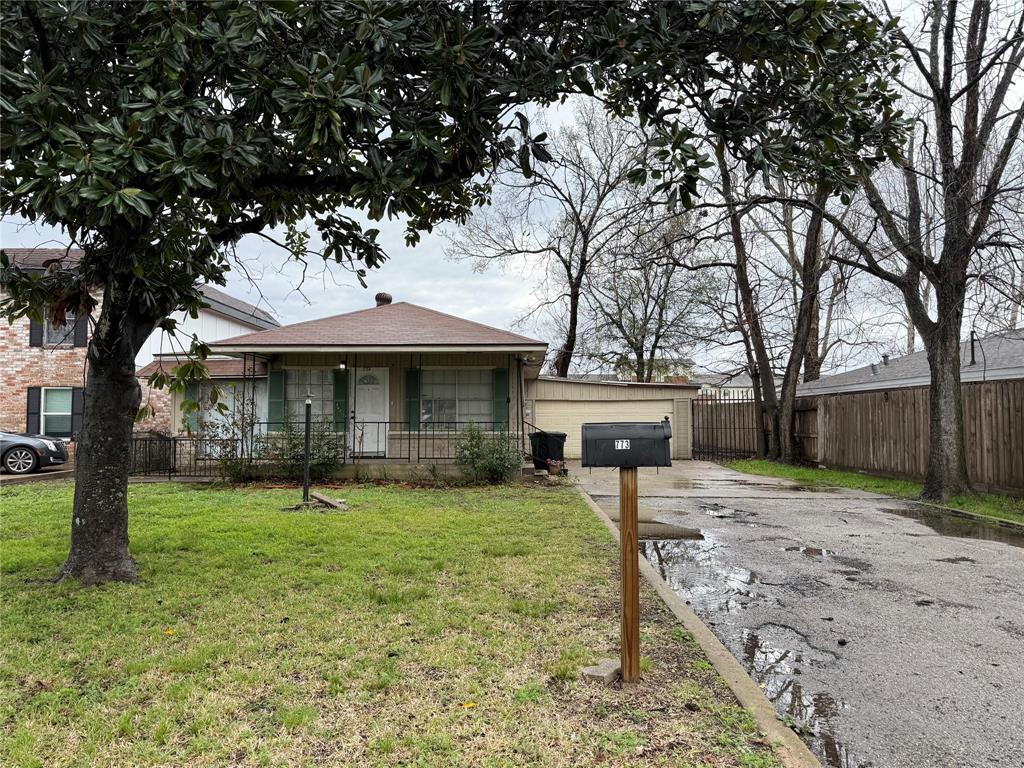
Active
$171,000
4
bds
|
0
ba
|
1,660
sqft
|
built
1965
773 Lucky St, Houston, TX 77088
$295
Cash flow
9.0%
Cash-on-Cash Return
7.7%
Cap rate
0.9%
Rent to Value Ratio
Active
$330,000
4
bds
|
0
ba
|
2,020
sqft
|
built
1960
5814 Fontenelle Dr, Houston, TX 77035
$-663
Cash flow
-10.5%
Cash-on-Cash Return
3.3%
Cap rate
0.6%
Rent to Value Ratio
Active
$95,000
2
bds
|
0
ba
|
1,312
sqft
|
built
1979
9350 Country Creek Dr, Houston, TX 77036
$-234
Cash flow
-12.9%
Cash-on-Cash Return
2.7%
Cap rate
1.3%
Rent to Value Ratio
Active
$295,000
4
bds
|
0
ba
|
1,774
sqft
|
built
2005
7102 Biton Dr, Houston, TX 77083
$-537
Cash flow
-9.5%
Cash-on-Cash Return
3.5%
Cap rate
0.7%
Rent to Value Ratio
Active
$215,000
3
bds
|
0
ba
|
1,343
sqft
|
built
2006
12047 Madison Oak St, Houston, TX 77038
$49
Cash flow
1.2%
Cash-on-Cash Return
5.9%
Cap rate
0.7%
Rent to Value Ratio
Active
$299,900
3
bds
|
0
ba
|
1,978
sqft
|
built
1979
14688 Perthshire Rd, Houston, TX 77079
$596
Cash flow
10.4%
Cash-on-Cash Return
8.1%
Cap rate
1.2%
Rent to Value Ratio
Active
$490,000
6
bds
|
0
ba
|
2,585
sqft
|
built
1938
8209 Howard Dr, Houston, TX 77017
$-1,585
Cash flow
-16.9%
Cash-on-Cash Return
1.8%
Cap rate
0.3%
Rent to Value Ratio
Active
$455,000
3
bds
|
0
ba
|
2,099
sqft
|
built
2020
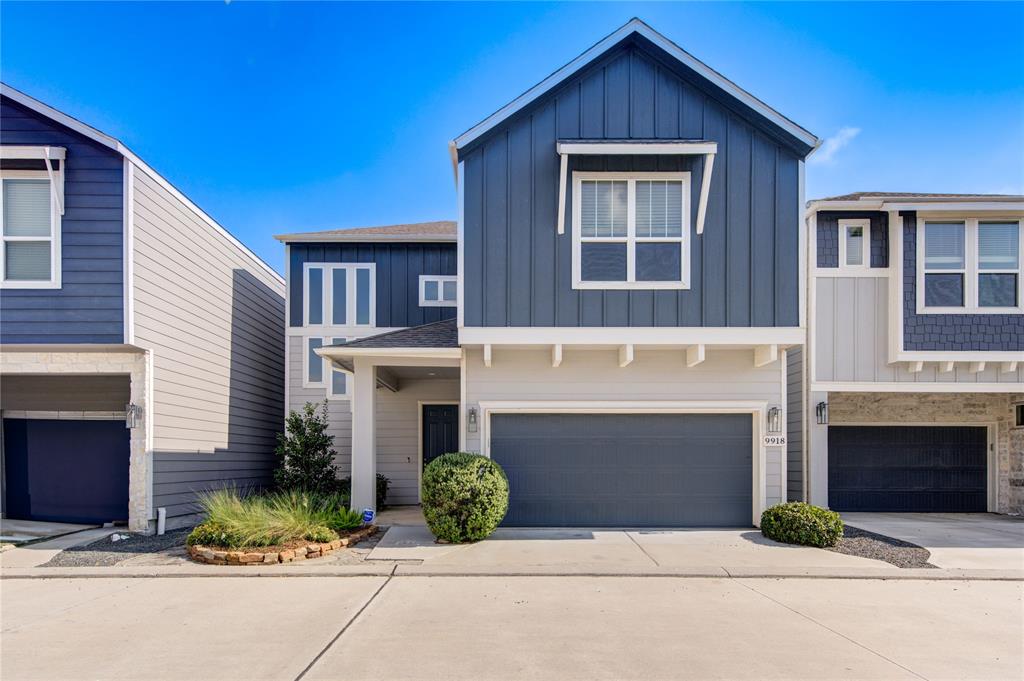
9918 Buckwheat Ln, Houston, TX 77080
$-1,375
Cash flow
-15.8%
Cash-on-Cash Return
2.1%
Cap rate
0.6%
Rent to Value Ratio
Active
$529,000
3
bds
|
0
ba
|
2,002
sqft
|
built
1957
9207 Timberside Dr, Houston, TX 77025
$-1,521
Cash flow
-15.0%
Cash-on-Cash Return
2.2%
Cap rate
0.5%
Rent to Value Ratio
Active
$324,900
3
bds
|
0
ba
|
1,692
sqft
|
built
1978
2513 Bering Dr, Houston, TX 77057
$-771
Cash flow
-12.4%
Cash-on-Cash Return
2.8%
Cap rate
0.8%
Rent to Value Ratio
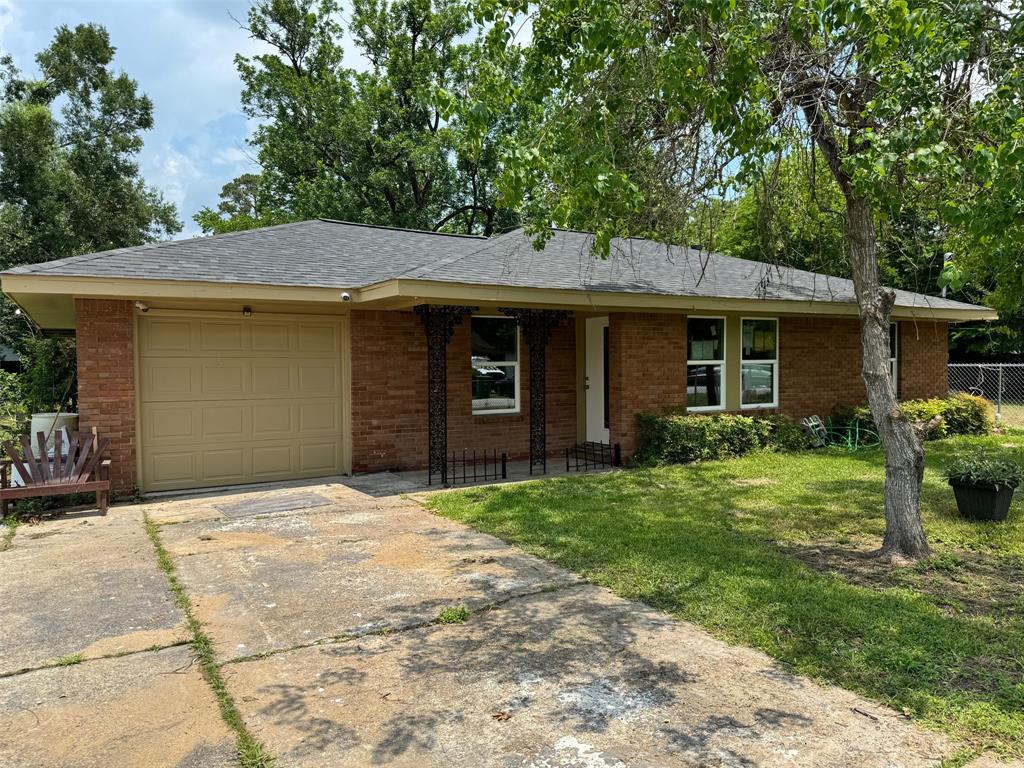
Active under contract
$200,000
3
bds
|
0
ba
|
1,201
sqft
|
built
1950
8117 Snowden St, Houston, TX 77028
$1
Cash flow
0.0%
Cash-on-Cash Return
5.7%
Cap rate
0.8%
Rent to Value Ratio
Active
$428,990
3
bds
|
0
ba
|
2,101
sqft
|
built
2020
1266 N Post Oak Rd, Houston, TX 77055
$-694
Cash flow
-8.4%
Cash-on-Cash Return
3.7%
Cap rate
0.7%
Rent to Value Ratio
Active
$784,900
4
bds
|
0
ba
|
3,566
sqft
|
built
1989
19507 Laurel Park Ln, Houston, TX 77094
$-2,183
Cash flow
-14.5%
Cash-on-Cash Return
2.3%
Cap rate
0.5%
Rent to Value Ratio
Pending
$525,000
2
bds
|
0
ba
|
972
sqft
|
built
1920
404 E 28th St, Houston, TX 77008
$-1,441
Cash flow
-14.3%
Cash-on-Cash Return
2.4%
Cap rate
0.5%
Rent to Value Ratio
Active
$275,000
2
bds
|
0
ba
|
1,872
sqft
|
built
1981
8028 Oakwood Forest Dr, Houston, TX 77040
$-482
Cash flow
-9.1%
Cash-on-Cash Return
3.6%
Cap rate
0.7%
Rent to Value Ratio
Active
$169,000
2
bds
|
0
ba
|
870
sqft
|
built
1968
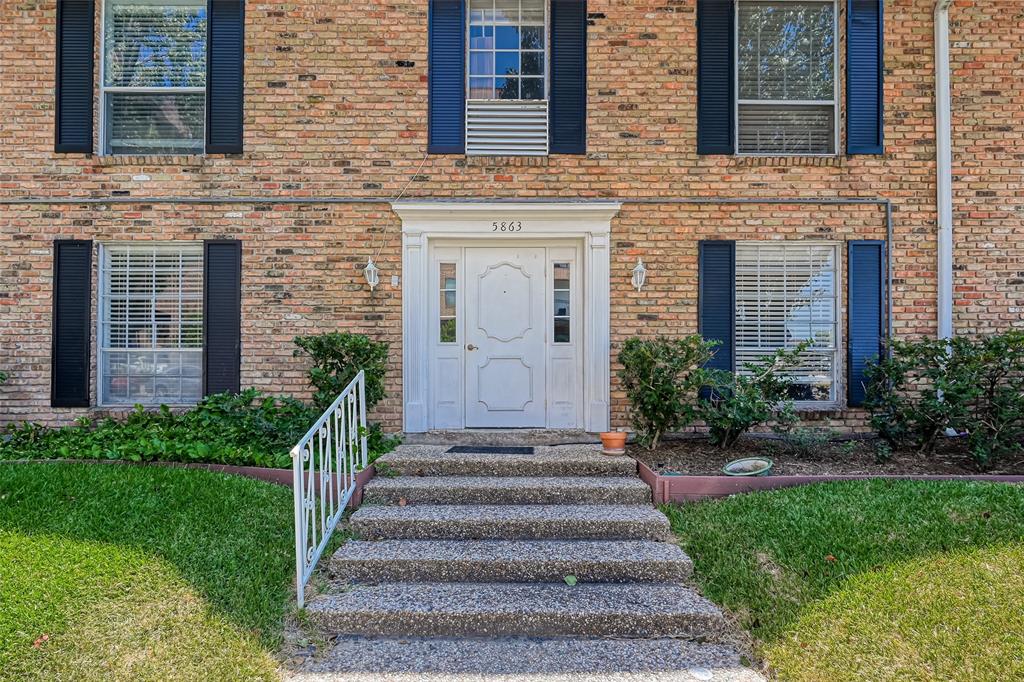
5863 Inwood Dr, Houston, TX 77057
$-492
Cash flow
-15.2%
Cash-on-Cash Return
2.2%
Cap rate
0.8%
Rent to Value Ratio
Active
$1,275,000
4
bds
|
0
ba
|
4,476
sqft
|
built
1984
3224 Alabama Ct, Houston, TX 77027
$-2,426
Cash flow
-9.9%
Cash-on-Cash Return
3.4%
Cap rate
0.6%
Rent to Value Ratio
Active
$310,000
2
bds
|
0
ba
|
1,252
sqft
|
built
1992
2111 Welch St, Houston, TX 77019
$-700
Cash flow
-11.8%
Cash-on-Cash Return
3.0%
Cap rate
0.7%
Rent to Value Ratio
Active
$63,900
1
bds
|
0
ba
|
784
sqft
|
built
1981
10211 Sugar Branch Dr, Houston, TX 77036
$435
Cash flow
7.9%
Cash-on-Cash Return
8.2%
Cap rate
1.7%
Rent to Value Ratio
Active
$325,000
4
bds
|
0
ba
|
2,328
sqft
|
built
1970
5638 Long Creek Ln, Houston, TX 77088
$-428
Cash flow
-6.9%
Cash-on-Cash Return
4.1%
Cap rate
0.8%
Rent to Value Ratio
Active
$699,000
4
bds
|
0
ba
|
2,033
sqft
|
built
1953
2111 Nina Lee Ln, Houston, TX 77018
$-824
Cash flow
-6.2%
Cash-on-Cash Return
4.3%
Cap rate
0.5%
Rent to Value Ratio
Active
$365,000
4
bds
|
0
ba
|
2,879
sqft
|
built
2021
14827 Fairy Tern Ln, Houston, TX 77049
$-766
Cash flow
-10.9%
Cash-on-Cash Return
3.2%
Cap rate
0.8%
Rent to Value Ratio
Active
$275,000
4
bds
|
0
ba
|
2,096
sqft
|
built
1978
15623 Ensenada Dr, Houston, TX 77083
$-118
Cash flow
-2.2%
Cash-on-Cash Return
5.2%
Cap rate
0.9%
Rent to Value Ratio
Active
$145,000
3
bds
|
0
ba
|
1,122
sqft
|
built
1972
6201 Ranchester Dr, Houston, TX 77036
$-296
Cash flow
-10.7%
Cash-on-Cash Return
3.2%
Cap rate
1.0%
Rent to Value Ratio
Active
$179,000
3
bds
|
0
ba
|
1,418
sqft
|
built
1965
5206 Fairgreen Ln, Houston, TX 77048
$-1
Cash flow
0.0%
Cash-on-Cash Return
5.7%
Cap rate
0.9%
Rent to Value Ratio
Active
$880,000
4
bds
|
0
ba
|
2,438
sqft
|
built
1938
4731 Park Dr, Houston, TX 77023
$-3,019
Cash flow
-17.9%
Cash-on-Cash Return
1.6%
Cap rate
0.4%
Rent to Value Ratio
Active
$1,150,000
3
bds
|
0
ba
|
3,750
sqft
|
built
2015
1705 Michigan St, Houston, TX 77006
$-2,751
Cash flow
-12.5%
Cash-on-Cash Return
2.8%
Cap rate
0.3%
Rent to Value Ratio

Active
$180,000
2
bds
|
0
ba
|
928
sqft
|
built
1982
7855 Winehill Ln, Houston, TX 77040
$-87
Cash flow
-2.5%
Cash-on-Cash Return
5.1%
Cap rate
0.9%
Rent to Value Ratio
Active
$500,000
3
bds
|
0
ba
|
2,280
sqft
|
built
2002
641 Hartman St, Houston, TX 77007
$-1,189
Cash flow
-12.4%
Cash-on-Cash Return
2.8%
Cap rate
0.6%
Rent to Value Ratio

Active
$258,000
3
bds
|
0
ba
|
1,844
sqft
|
built
1980
2710 Hazy Creek Dr, Houston, TX 77084
$-383
Cash flow
-7.7%
Cash-on-Cash Return
3.9%
Cap rate
0.8%
Rent to Value Ratio
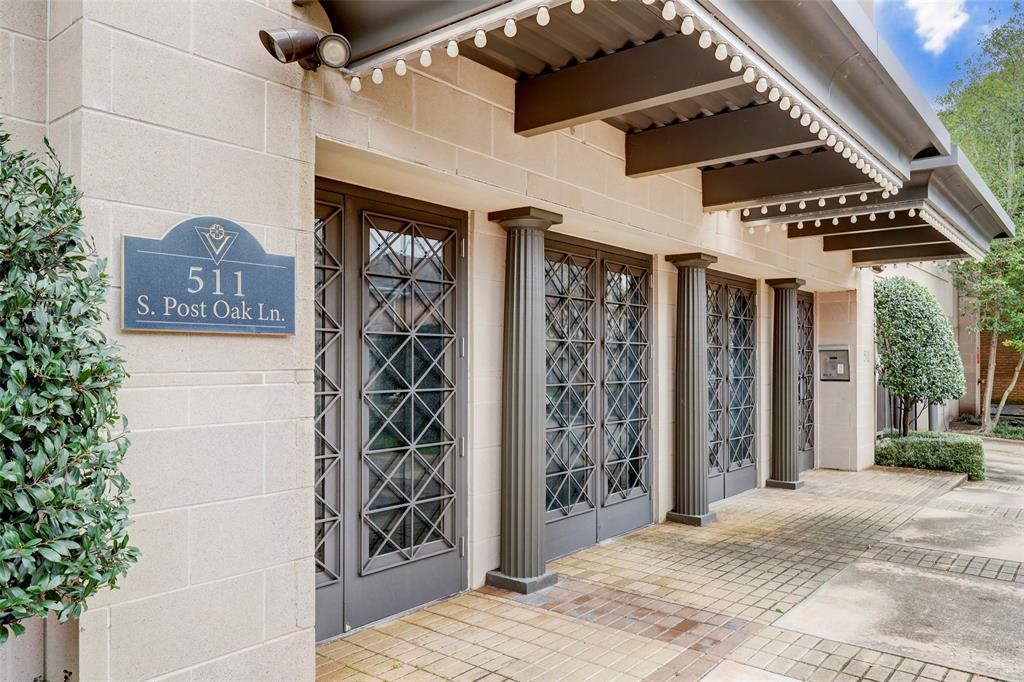
Active
$1,374,000
4
bds
|
0
ba
|
4,390
sqft
|
built
2003
511 S Post Oak Ln, Houston, TX 77056
$-7,242
Cash flow
-27.5%
Cash-on-Cash Return
-0.6%
Cap rate
0.5%
Rent to Value Ratio
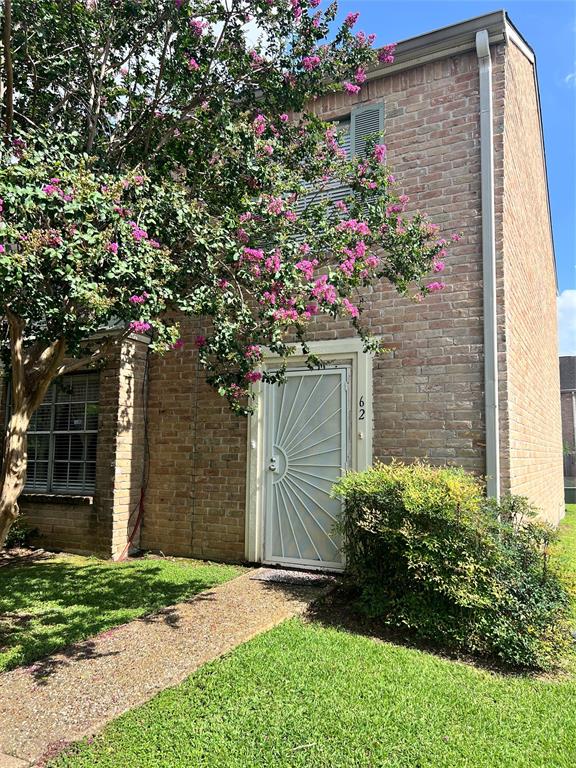
Active
$199,000
3
bds
|
0
ba
|
1,664
sqft
|
built
1976
62 W Park West Dr, Houston, TX 77072
$-316
Cash flow
-8.3%
Cash-on-Cash Return
3.8%
Cap rate
0.9%
Rent to Value Ratio
Active
$425,000
3
bds
|
0
ba
|
2,534
sqft
|
built
1997
17503 Whispering Star Ct, Houston, TX 77095
$-869
Cash flow
-10.7%
Cash-on-Cash Return
3.2%
Cap rate
0.7%
Rent to Value Ratio