Houston, TX Investment Properties for Sale
Browse homes for sale and investment properties in Houston, TX. Refine your search by price, property type, or more.
Best cash flowing properties in Houston, TX
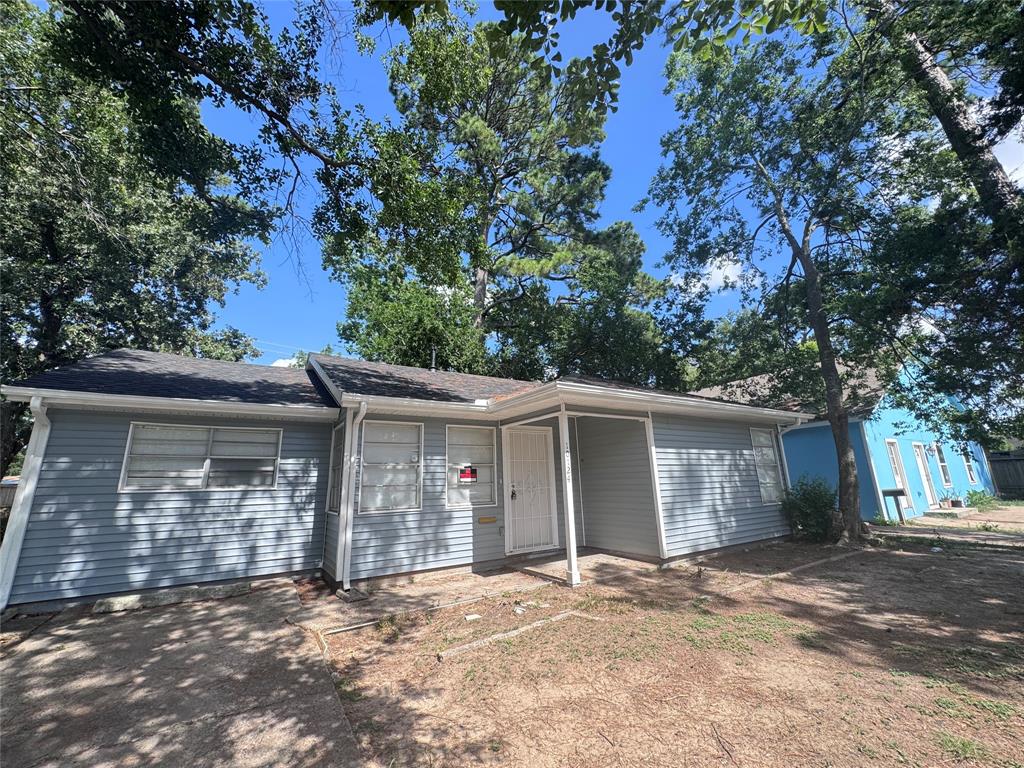
Active
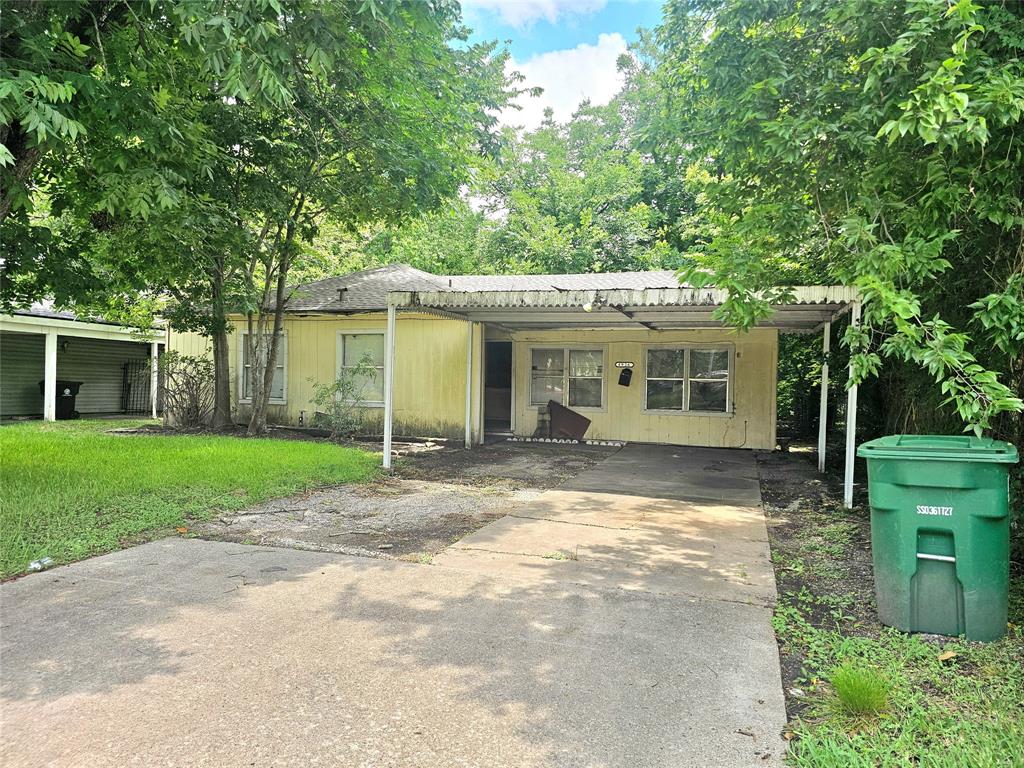
$128,400
3
bds
|
0
ba
|
1,337
sqft
|
built
1955
4926 Idaho St, Houston, TX 77021
$373
Cash flow
15.2%
Cash-on-Cash Return
9.8%
Cap rate
1.4%
Rent to Value Ratio
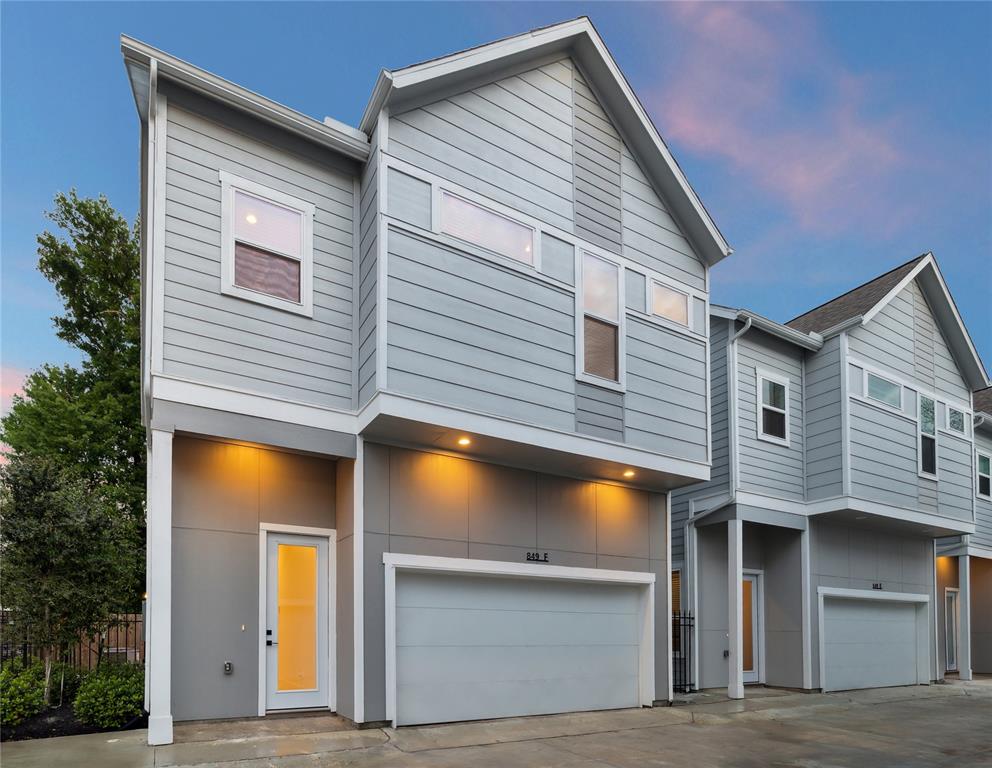
Active
$325,000
3
bds
|
0
ba
|
1,490
sqft
|
built
2023
853 Mansfield St, Houston, TX 77091
$130
Cash flow
2.1%
Cash-on-Cash Return
6.8%
Cap rate
0.9%
Rent to Value Ratio
8,456 out of 8,896 properties for sale in Houston, TX
Limited Results Shown
Create a free account, or log in to reveal all property listings and enjoy the complete experience.

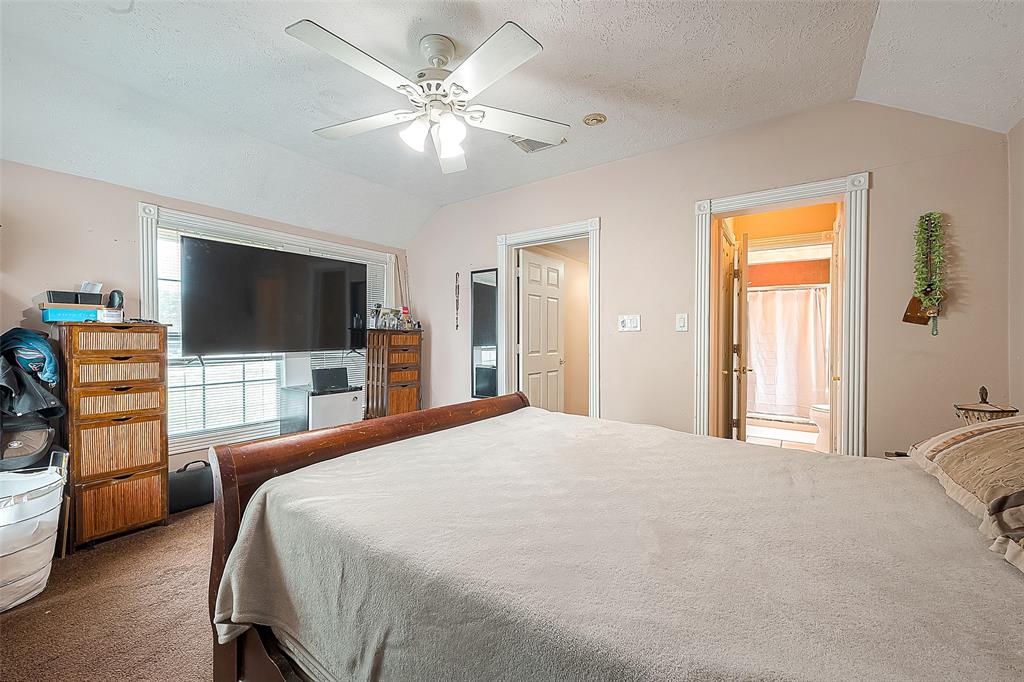
Active
$319,900
4
bds
|
0
ba
|
1,600
sqft
|
built
1960
3808 Cochran St, Houston, TX 77009
$-705
Cash flow
-11.5%
Cash-on-Cash Return
3.6%
Cap rate
0.6%
Rent to Value Ratio

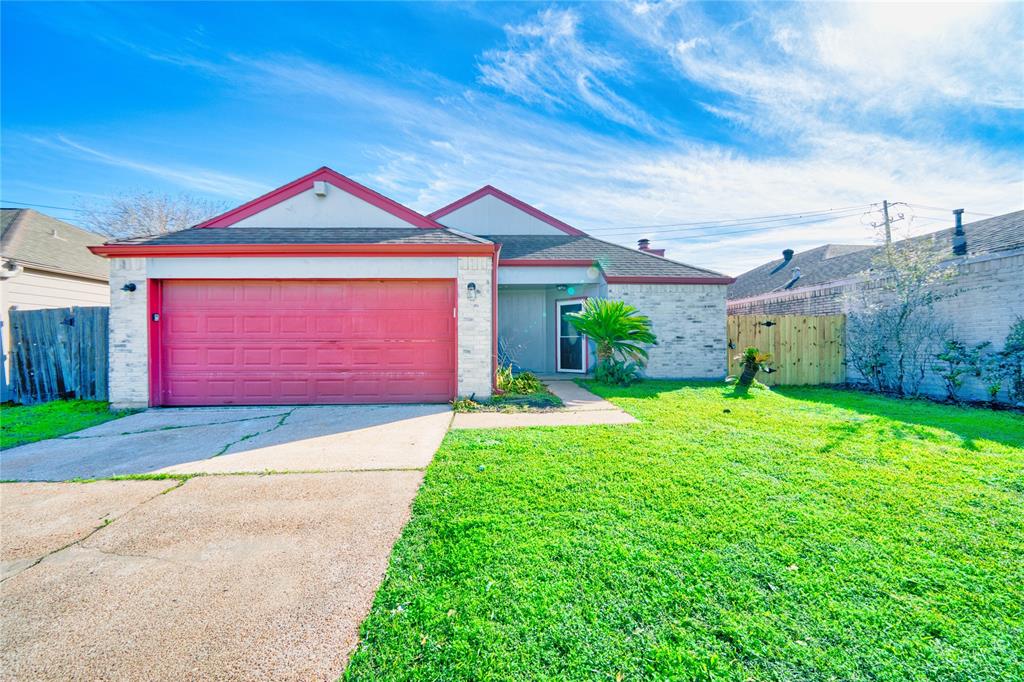
Active
$159,000
1
bds
|
0
ba
|
858
sqft
|
built
2003
9200 Westheimer Rd, Houston, TX 77063
$-562
Cash flow
-18.4%
Cash-on-Cash Return
2.0%
Cap rate
0.9%
Rent to Value Ratio
Active
$375,000
4
bds
|
0
ba
|
2,145
sqft
|
built
1936
1401 Scharpe St, Houston, TX 77023
$-758
Cash flow
-10.5%
Cash-on-Cash Return
3.9%
Cap rate
0.7%
Rent to Value Ratio
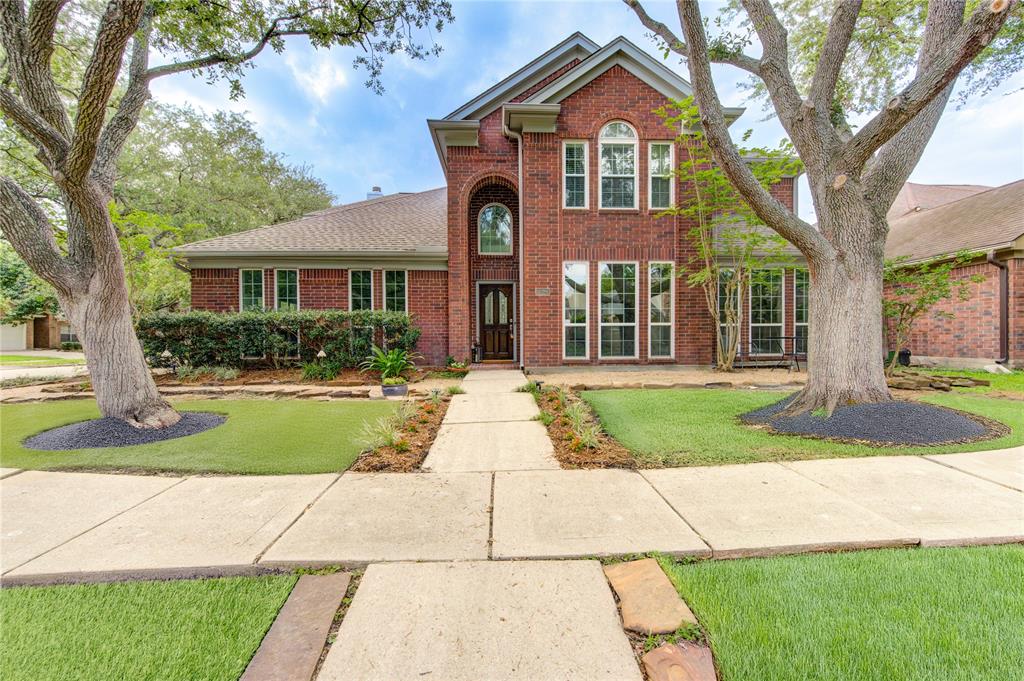
Active
$354,900
3
bds
|
0
ba
|
1,862
sqft
|
built
1978
11415 Pepperdine Ln, Houston, TX 77071
$-805
Cash flow
-11.8%
Cash-on-Cash Return
3.6%
Cap rate
0.6%
Rent to Value Ratio
Active
$627,000
4
bds
|
0
ba
|
3,466
sqft
|
built
1990
14226 Townshire Dr, Houston, TX 77077
$-1,867
Cash flow
-15.5%
Cash-on-Cash Return
2.7%
Cap rate
0.6%
Rent to Value Ratio
Active
$510,000
3
bds
|
0
ba
|
2,037
sqft
|
built
2012
506 Knox St, Houston, TX 77007
$-1,180
Cash flow
-12.1%
Cash-on-Cash Return
3.5%
Cap rate
0.7%
Rent to Value Ratio
Active
$439,000
3
bds
|
0
ba
|
2,139
sqft
|
built
2015
3309 Jefferson St, Houston, TX 77003
$-1,021
Cash flow
-12.1%
Cash-on-Cash Return
3.5%
Cap rate
0.7%
Rent to Value Ratio
Active
$230,000
3
bds
|
0
ba
|
1,227
sqft
|
built
1968
3906 Simsbrook Dr, Houston, TX 77045
$-441
Cash flow
-10.0%
Cash-on-Cash Return
4.0%
Cap rate
0.6%
Rent to Value Ratio
Active
$260,000
3
bds
|
0
ba
|
1,880
sqft
|
built
2004
19826 Imperial Stone Dr, Houston, TX 77073
$-523
Cash flow
-10.5%
Cash-on-Cash Return
3.9%
Cap rate
0.8%
Rent to Value Ratio
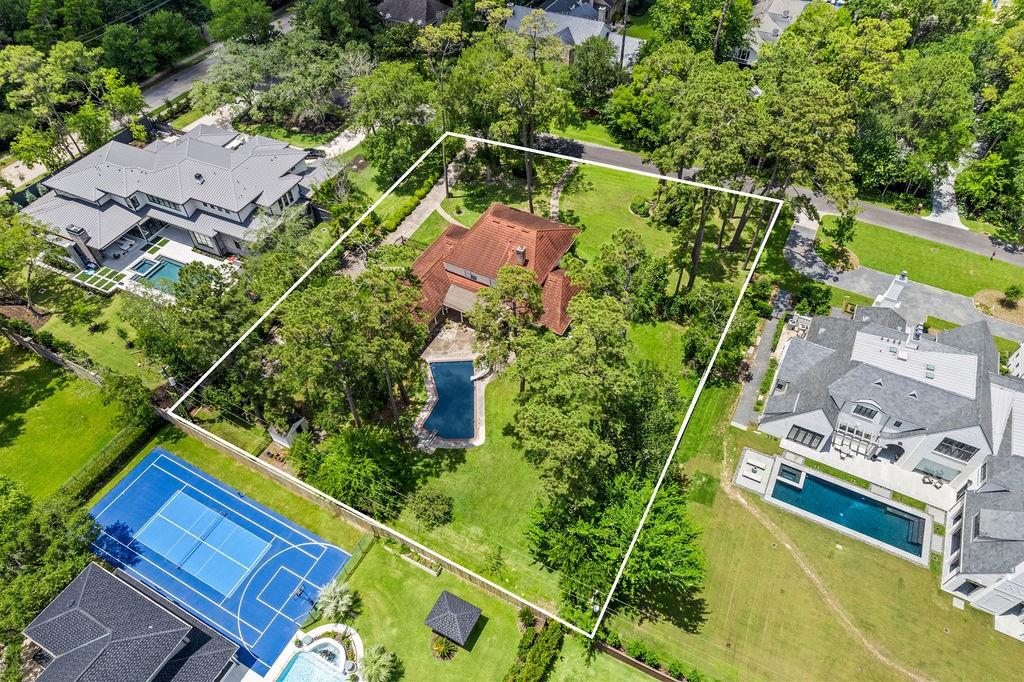
Pending
$2,999,000
5
bds
|
0
ba
|
4,984
sqft
|
built
1972
7 Tokeneke Trl, Houston, TX 77024
$-14,650
Cash flow
-25.5%
Cash-on-Cash Return
0.4%
Cap rate
0.2%
Rent to Value Ratio
Active
$179,000
3
bds
|
0
ba
|
1,231
sqft
|
built
1953
10124 Homestead Rd, Houston, TX 77016
$14
Cash flow
0.4%
Cash-on-Cash Return
6.4%
Cap rate
0.9%
Rent to Value Ratio

Active
$600,000
3
bds
|
0
ba
|
1,581
sqft
|
built
1920
1032 Algregg St, Houston, TX 77009
$-1,927
Cash flow
-16.8%
Cash-on-Cash Return
2.4%
Cap rate
0.5%
Rent to Value Ratio
Active under contract
$492,500
4
bds
|
0
ba
|
2,948
sqft
|
built
2000
11607 Ruby Canyon Ln, Houston, TX 77095
$-1,254
Cash flow
-13.3%
Cash-on-Cash Return
3.2%
Cap rate
0.6%
Rent to Value Ratio
Active
$239,850
4
bds
|
0
ba
|
1,832
sqft
|
built
1955
505 Marleen St, Houston, TX 77034
$-97
Cash flow
-2.1%
Cash-on-Cash Return
5.8%
Cap rate
0.9%
Rent to Value Ratio
Active
$495,000
3
bds
|
0
ba
|
2,094
sqft
|
built
1974
12114 Sugar Springs Dr, Houston, TX 77077
$-1,377
Cash flow
-14.5%
Cash-on-Cash Return
2.9%
Cap rate
0.6%
Rent to Value Ratio
Active
$218,900
3
bds
|
0
ba
|
1,308
sqft
|
built
1974
9627 Crooked Wood Ln, Houston, TX 77086
$-472
Cash flow
-11.2%
Cash-on-Cash Return
3.7%
Cap rate
0.7%
Rent to Value Ratio
Active
$374,000
2
bds
|
0
ba
|
1,754
sqft
|
built
1998
1601 W Webster St, Houston, TX 77019
$-1,294
Cash flow
-18.1%
Cash-on-Cash Return
2.1%
Cap rate
0.8%
Rent to Value Ratio
Active
$310,000
2
bds
|
0
ba
|
1,390
sqft
|
built
1992
2111 Welch St, Houston, TX 77019
$-1,524
Cash flow
-25.6%
Cash-on-Cash Return
0.4%
Cap rate
0.7%
Rent to Value Ratio
Active
$345,000
4
bds
|
0
ba
|
2,696
sqft
|
built
1975
11727 Quail Creek Dr, Houston, TX 77070
$-680
Cash flow
-10.3%
Cash-on-Cash Return
3.9%
Cap rate
0.7%
Rent to Value Ratio
Active
$460,000
3
bds
|
0
ba
|
1,496
sqft
|
built
2022
728 Carriage Knolls Dr, Houston, TX 77008
$-1,232
Cash flow
-14.0%
Cash-on-Cash Return
3.1%
Cap rate
0.7%
Rent to Value Ratio
Active
$625,000
4
bds
|
0
ba
|
2,982
sqft
|
built
1936
1218 Des Jardines St, Houston, TX 77023
$-2,185
Cash flow
-18.2%
Cash-on-Cash Return
2.1%
Cap rate
0.4%
Rent to Value Ratio
Active
$449,900
5
bds
|
0
ba
|
3,570
sqft
|
built
1999
14723 Belterraza Dr, Houston, TX 77083
$-1,218
Cash flow
-14.1%
Cash-on-Cash Return
3.0%
Cap rate
0.6%
Rent to Value Ratio
Pending
$235,000
2
bds
|
0
ba
|
1,376
sqft
|
built
1978
12410 Wellington Park Dr, Houston, TX 77072
$-408
Cash flow
-9.1%
Cash-on-Cash Return
4.2%
Cap rate
0.8%
Rent to Value Ratio
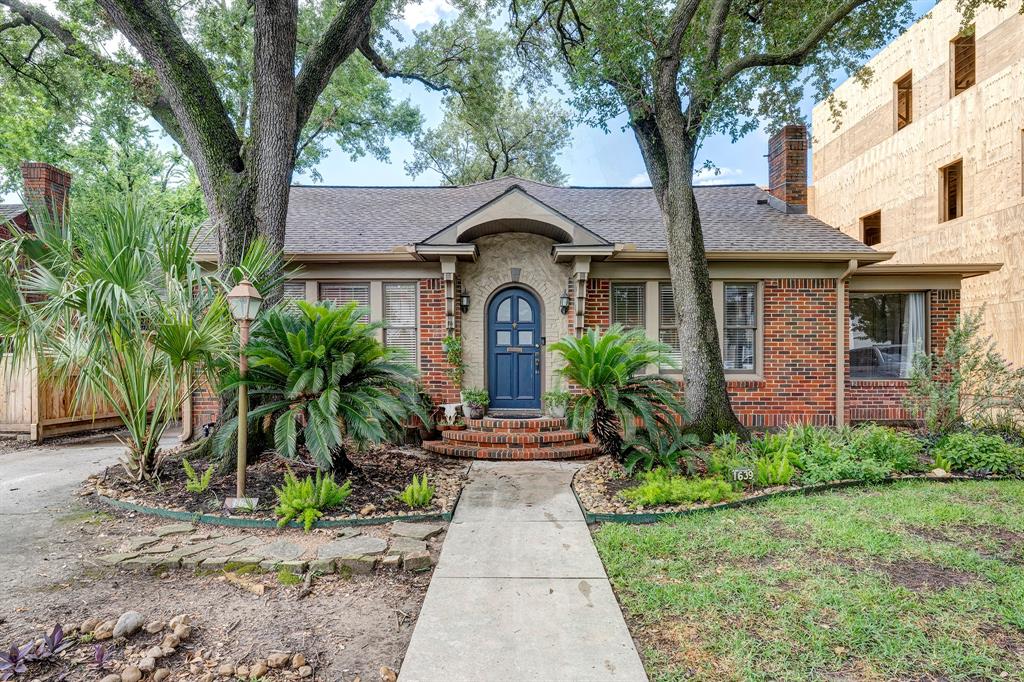
Active under contract
$795,000
3
bds
|
0
ba
|
2,173
sqft
|
built
1930
1639 Hawthorne St, Houston, TX 77006
$-2,747
Cash flow
-18.0%
Cash-on-Cash Return
2.1%
Cap rate
0.5%
Rent to Value Ratio
Active
$128,400
3
bds
|
0
ba
|
1,337
sqft
|
built
1955
4926 Idaho St, Houston, TX 77021
$373
Cash flow
15.2%
Cash-on-Cash Return
9.8%
Cap rate
1.4%
Rent to Value Ratio
Active
$849,900
3
bds
|
0
ba
|
1,546
sqft
|
built
1950
3510 Las Palmas St, Houston, TX 77027
$-3,316
Cash flow
-20.4%
Cash-on-Cash Return
1.6%
Cap rate
0.4%
Rent to Value Ratio
Active
$675,000
3
bds
|
0
ba
|
2,780
sqft
|
built
2013
1509 Colorado St, Houston, TX 77007
$-1,463
Cash flow
-11.3%
Cash-on-Cash Return
3.7%
Cap rate
0.7%
Rent to Value Ratio
Active
$243,900
3
bds
|
0
ba
|
1,622
sqft
|
built
1971
11006 Sagehill Dr, Houston, TX 77089
$-384
Cash flow
-8.2%
Cash-on-Cash Return
4.4%
Cap rate
0.8%
Rent to Value Ratio
Active
$365,000
4
bds
|
0
ba
|
2,428
sqft
|
built
1977
15514 Pebble Bend Dr, Houston, TX 77068
$-510
Cash flow
-7.3%
Cash-on-Cash Return
4.6%
Cap rate
0.8%
Rent to Value Ratio
Active
$389,000
4
bds
|
0
ba
|
2,989
sqft
|
built
2000
8034 High Hollow Ln, Houston, TX 77070
$-911
Cash flow
-12.2%
Cash-on-Cash Return
3.5%
Cap rate
0.6%
Rent to Value Ratio
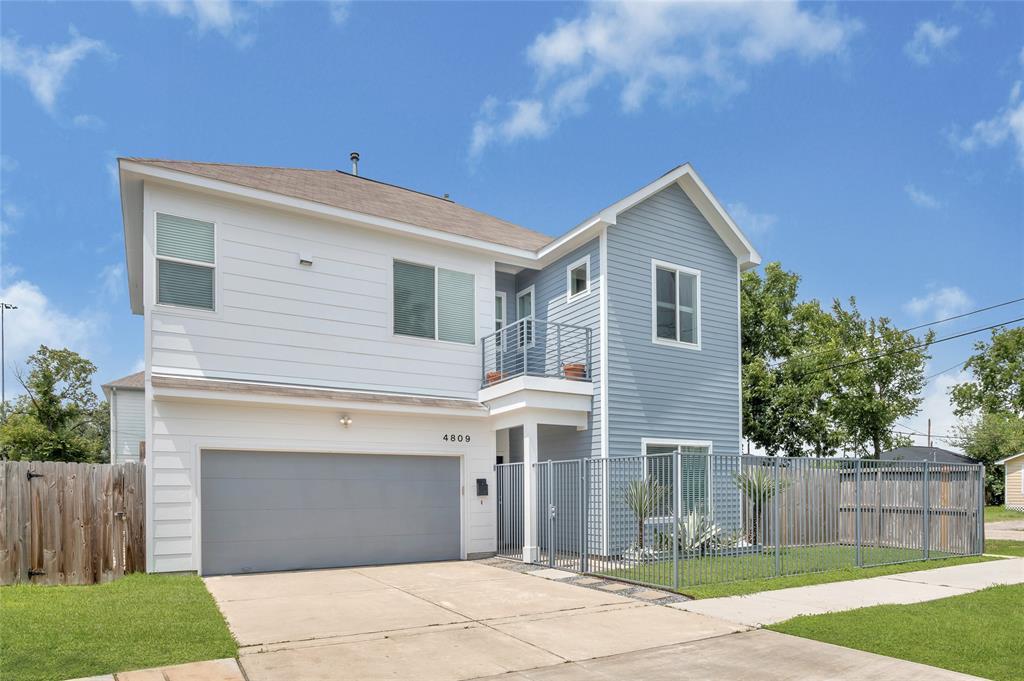
Active
$290,000
3
bds
|
0
ba
|
1,581
sqft
|
built
2016
4809 Nichols St, Houston, TX 77020
$-477
Cash flow
-8.6%
Cash-on-Cash Return
4.3%
Cap rate
0.8%
Rent to Value Ratio
Active
$399,000
3
bds
|
0
ba
|
1,533
sqft
|
built
1952
6625 Fairfield St, Houston, TX 77023
$-1,269
Cash flow
-16.6%
Cash-on-Cash Return
2.5%
Cap rate
0.5%
Rent to Value Ratio
Active
$335,000
3
bds
|
0
ba
|
2,188
sqft
|
built
2003
16610 Mc Cormick Dr, Houston, TX 77095
$-884
Cash flow
-13.8%
Cash-on-Cash Return
3.1%
Cap rate
0.7%
Rent to Value Ratio
Active
$269,999
3
bds
|
0
ba
|
1,926
sqft
|
built
2005
2714 Windy Thicket Ln, Houston, TX 77082
$-879
Cash flow
-17.0%
Cash-on-Cash Return
2.4%
Cap rate
0.7%
Rent to Value Ratio
Active
$310,000
4
bds
|
0
ba
|
2,040
sqft
|
built
1982
15511 Glenwood Park Dr, Houston, TX 77095
$-593
Cash flow
-10.0%
Cash-on-Cash Return
4.0%
Cap rate
0.7%
Rent to Value Ratio
Active
$1,599,000
4
bds
|
0
ba
|
3,560
sqft
|
built
1915
1543 Columbia St, Houston, TX 77008
$-6,184
Cash flow
-20.2%
Cash-on-Cash Return
1.6%
Cap rate
0.3%
Rent to Value Ratio
Active
$289,950
4
bds
|
0
ba
|
1,868
sqft
|
built
1981
15806 Pfeiffer Dr, Houston, TX 77082
$-532
Cash flow
-9.6%
Cash-on-Cash Return
4.1%
Cap rate
0.7%
Rent to Value Ratio
Active
$105,000
1
bds
|
0
ba
|
767
sqft
|
built
1970
4637 Wild Indigo St, Houston, TX 77027
$-106
Cash flow
-5.3%
Cash-on-Cash Return
5.1%
Cap rate
1.5%
Rent to Value Ratio
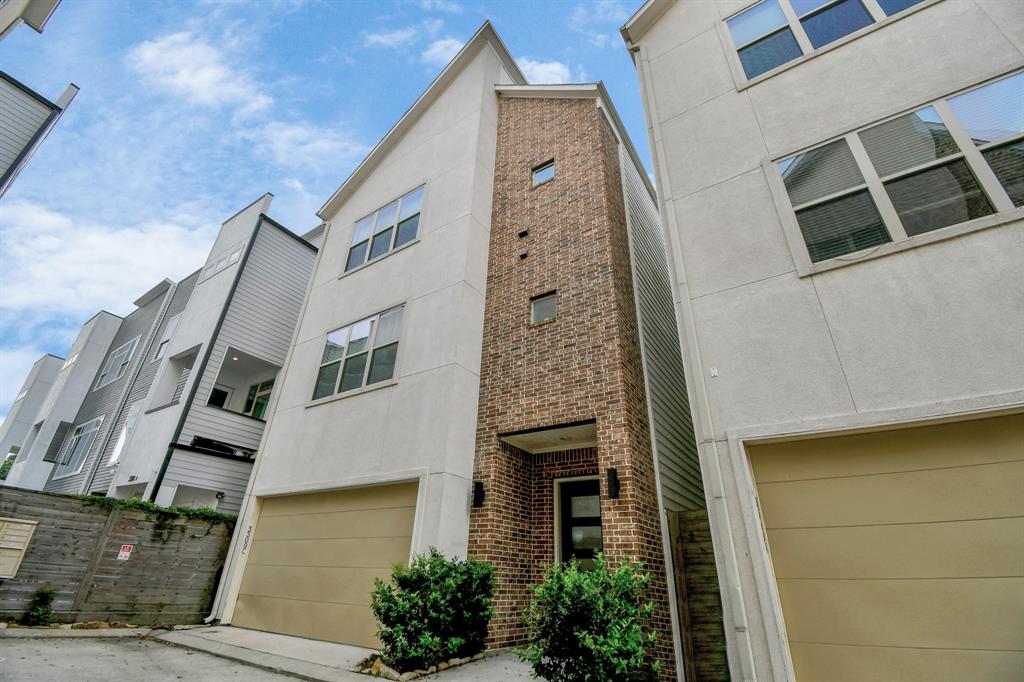
Active
$325,000
3
bds
|
0
ba
|
1,490
sqft
|
built
2023
853 Mansfield St, Houston, TX 77091
$130
Cash flow
2.1%
Cash-on-Cash Return
6.8%
Cap rate
0.9%
Rent to Value Ratio
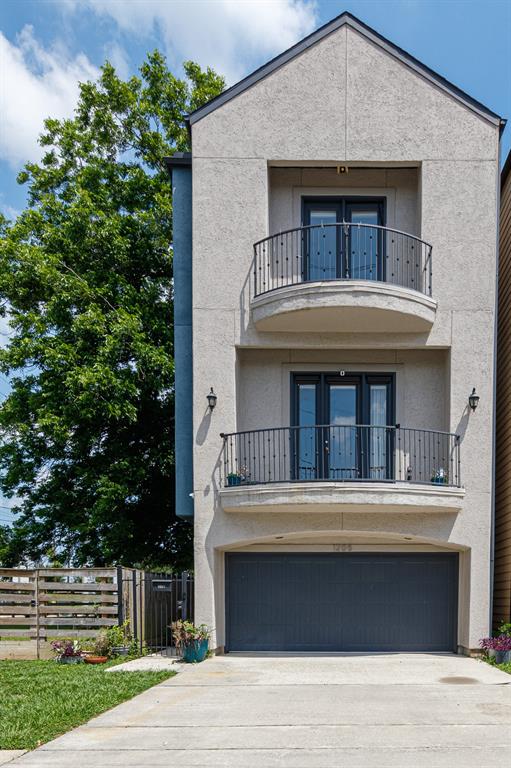
Active
$425,000
3
bds
|
0
ba
|
2,240
sqft
|
built
2008
1205 Sampson St, Houston, TX 77003
$-915
Cash flow
-11.2%
Cash-on-Cash Return
3.7%
Cap rate
0.7%
Rent to Value Ratio