Houston, TX Investment Properties for Sale
Browse homes for sale and investment properties in Houston, TX. Refine your search by price, property type, or more.
Best cash flowing properties in Houston, TX
Active
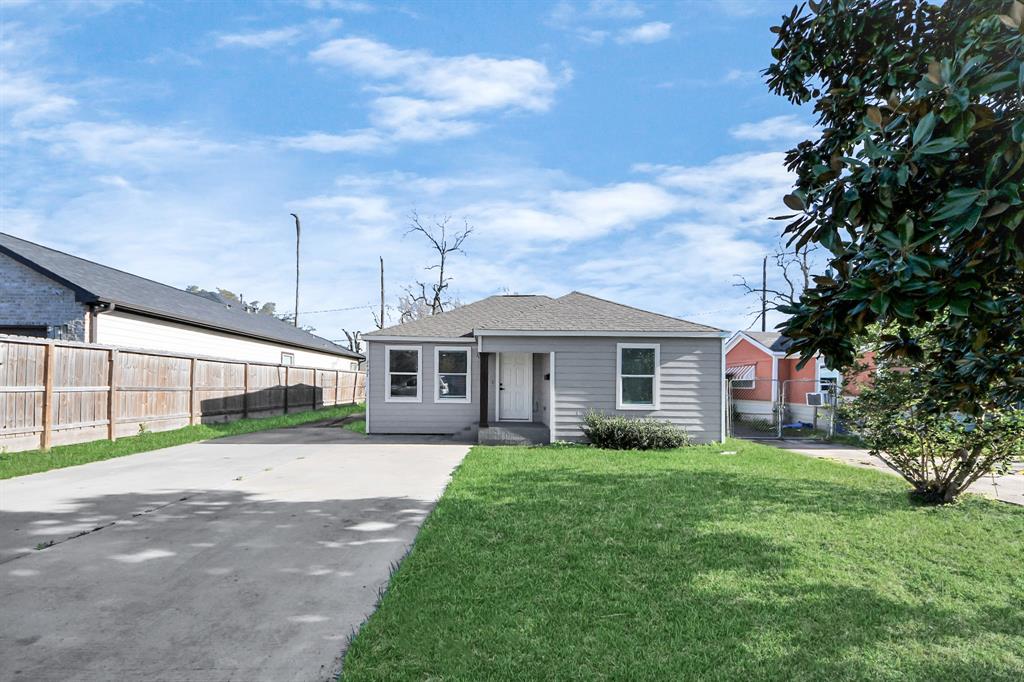
$212,000
3
bds
|
0
ba
|
1,298
sqft
|
built
1945
3437 Seabrook St, Houston, TX 77021
$132
Cash flow
3.2%
Cash-on-Cash Return
7.0%
Cap rate
0.8%
Rent to Value Ratio
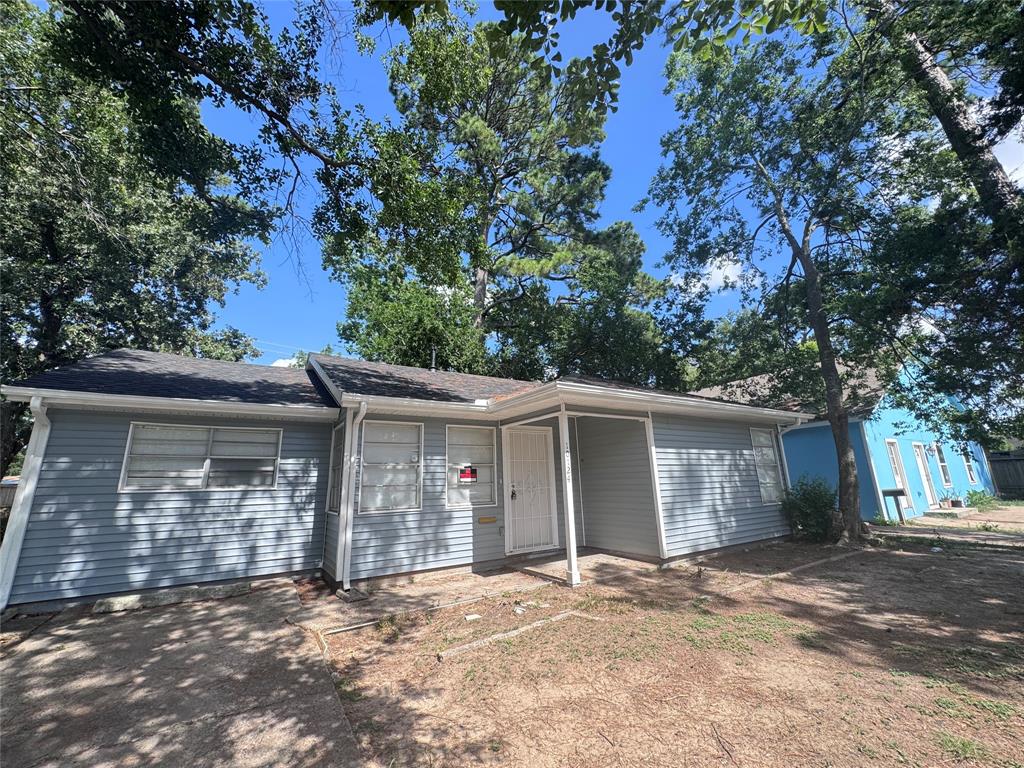
Active
$179,000
3
bds
|
0
ba
|
1,231
sqft
|
built
1953
10124 Homestead Rd, Houston, TX 77016
$14
Cash flow
0.4%
Cash-on-Cash Return
6.4%
Cap rate
0.9%
Rent to Value Ratio
8,516 out of 8,960 properties for sale in Houston, TX
Limited Results Shown
Create a free account, or log in to reveal all property listings and enjoy the complete experience.
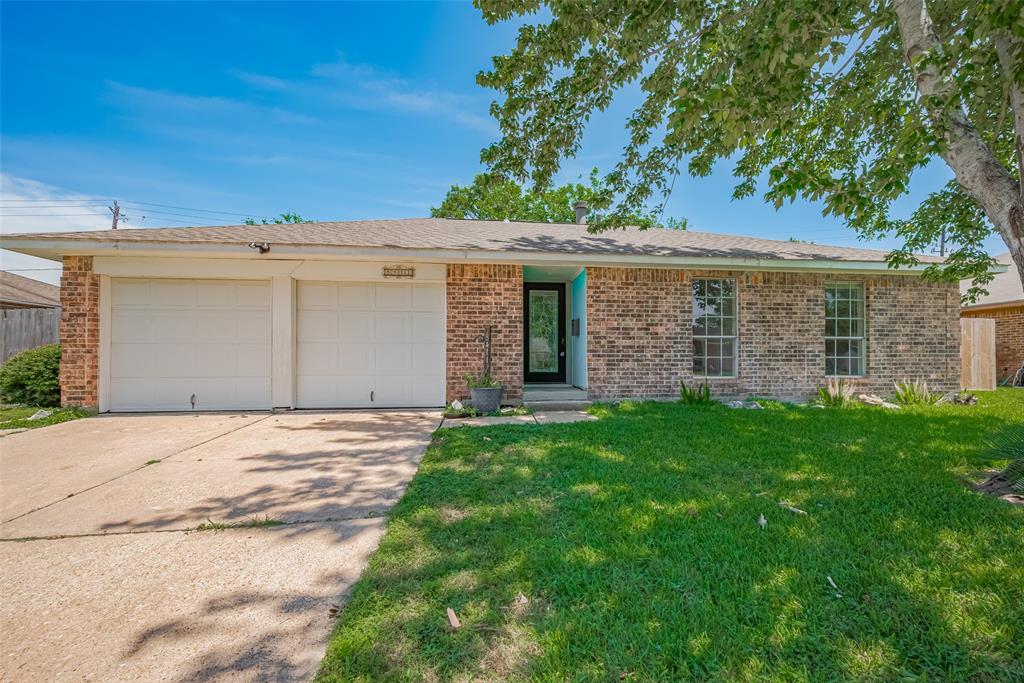
Active
$285,000
4
bds
|
0
ba
|
2,089
sqft
|
built
1976
8411 Misty Vale Ln, Houston, TX 77075
$-557
Cash flow
-10.2%
Cash-on-Cash Return
3.9%
Cap rate
0.7%
Rent to Value Ratio
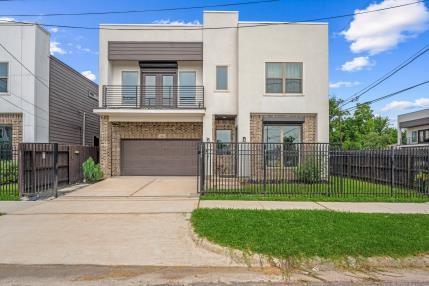
Active
$370,000
3
bds
|
0
ba
|
1,992
sqft
|
built
2019
1804 Schweikhardt St, Houston, TX 77020
$-665
Cash flow
-9.4%
Cash-on-Cash Return
4.1%
Cap rate
0.7%
Rent to Value Ratio
Active
$355,000
4
bds
|
0
ba
|
2,145
sqft
|
built
1980
3707 Kingston Vale Dr, Houston, TX 77082
$-397
Cash flow
-5.8%
Cash-on-Cash Return
4.9%
Cap rate
0.7%
Rent to Value Ratio

Active
$760,000
3
bds
|
0
ba
|
3,503
sqft
|
built
2005
227 Westheimer Rd, Houston, TX 77006
$-2,051
Cash flow
-14.1%
Cash-on-Cash Return
3.0%
Cap rate
0.6%
Rent to Value Ratio
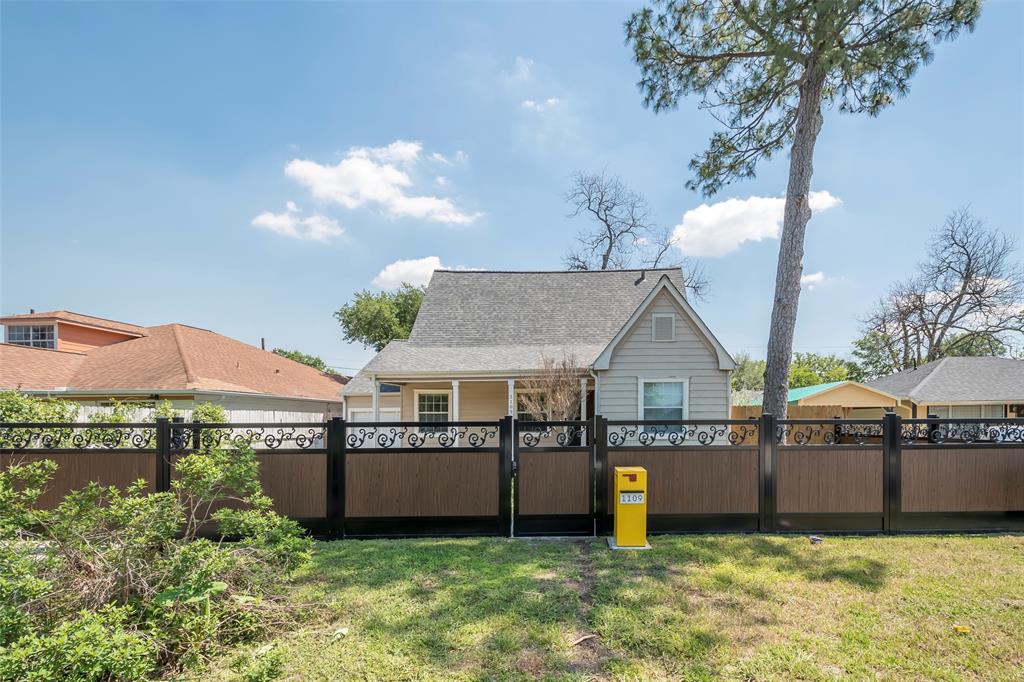
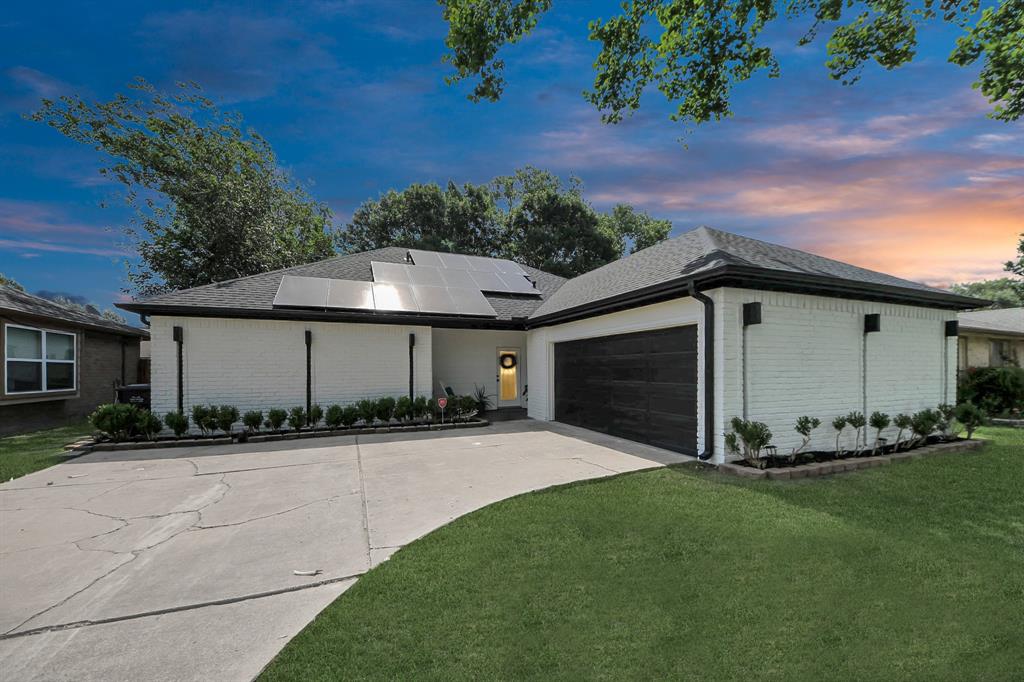
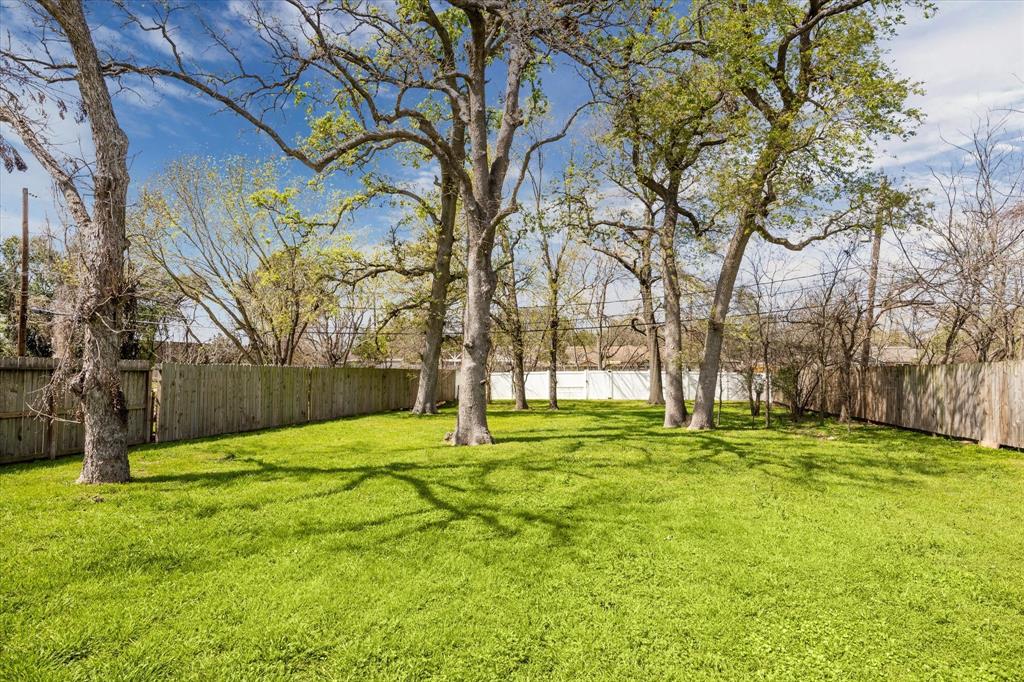
Active
$379,900
4
bds
|
0
ba
|
2,104
sqft
|
built
1938
1109 Dismuke St, Houston, TX 77023
$-1,088
Cash flow
-14.9%
Cash-on-Cash Return
2.8%
Cap rate
0.6%
Rent to Value Ratio
Active under contract
$350,000
3
bds
|
0
ba
|
1,483
sqft
|
built
1961
5702 Saxon Dr, Houston, TX 77092
$-597
Cash flow
-8.9%
Cash-on-Cash Return
4.2%
Cap rate
0.7%
Rent to Value Ratio
Active
$210,000
2
bds
|
0
ba
|
1,219
sqft
|
built
2008
13600 Breton Ridge St, Houston, TX 77070
$-714
Cash flow
-17.7%
Cash-on-Cash Return
2.2%
Cap rate
0.9%
Rent to Value Ratio
Active
$150,000
1
bds
|
0
ba
|
860
sqft
|
built
1977
2425 Underwood St, Houston, TX 77030
$-512
Cash flow
-17.8%
Cash-on-Cash Return
2.2%
Cap rate
0.9%
Rent to Value Ratio
Active
$625,000
3
bds
|
0
ba
|
1,769
sqft
|
built
2000
236 Mc Farland Rd, Houston, TX 77060
$-2,077
Cash flow
-17.3%
Cash-on-Cash Return
2.3%
Cap rate
0.4%
Rent to Value Ratio
Active
$125,000
2
bds
|
0
ba
|
1,252
sqft
|
built
1983
6103 Ludington Dr, Houston, TX 77035
$-104
Cash flow
-4.3%
Cash-on-Cash Return
5.3%
Cap rate
1.1%
Rent to Value Ratio
Active
$695,000
4
bds
|
0
ba
|
2,571
sqft
|
built
2018
1026 Adele St, Houston, TX 77009
$-1,728
Cash flow
-13.0%
Cash-on-Cash Return
3.3%
Cap rate
0.6%
Rent to Value Ratio
Active
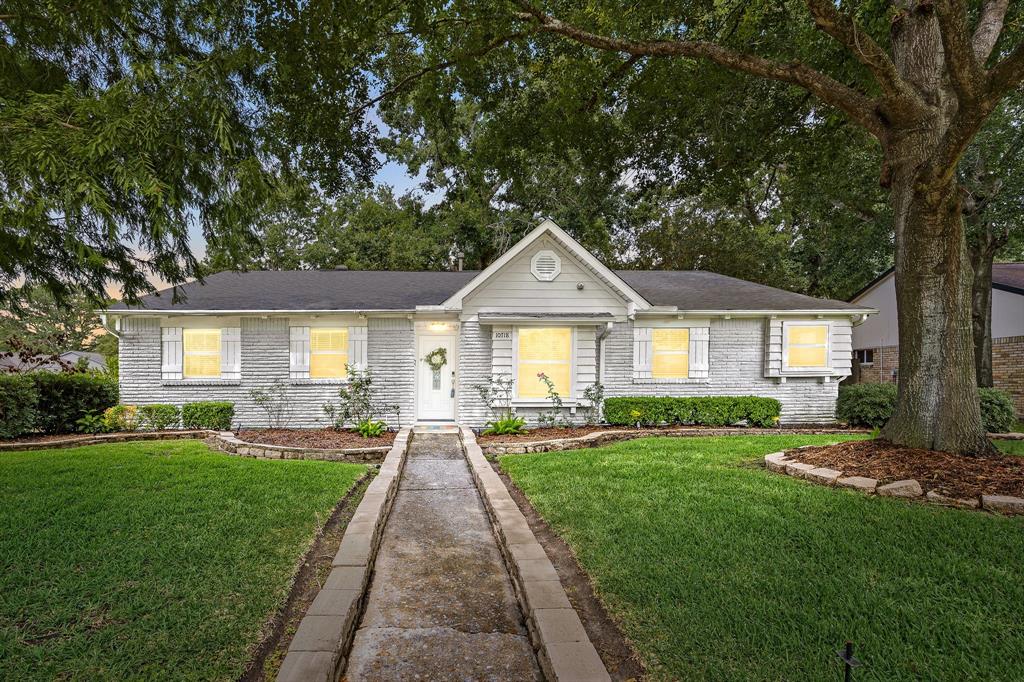
$449,999
3
bds
|
0
ba
|
2,331
sqft
|
built
1963
10718 Dunlap St, Houston, TX 77096
$-975
Cash flow
-11.3%
Cash-on-Cash Return
3.7%
Cap rate
0.7%
Rent to Value Ratio
Active
$440,000
4
bds
|
0
ba
|
3,173
sqft
|
built
2012
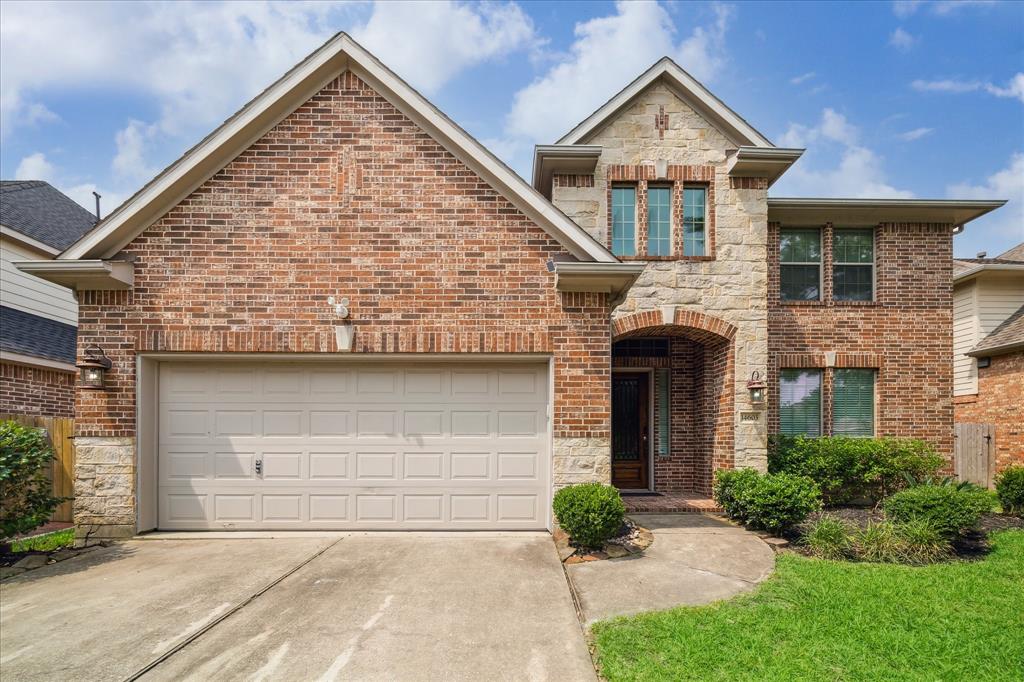
14603 Hampton Green Ln, Houston, TX 77044
$-1,117
Cash flow
-13.2%
Cash-on-Cash Return
3.2%
Cap rate
0.7%
Rent to Value Ratio
Active
$425,000
3
bds
|
0
ba
|
1,500
sqft
|
built
1954
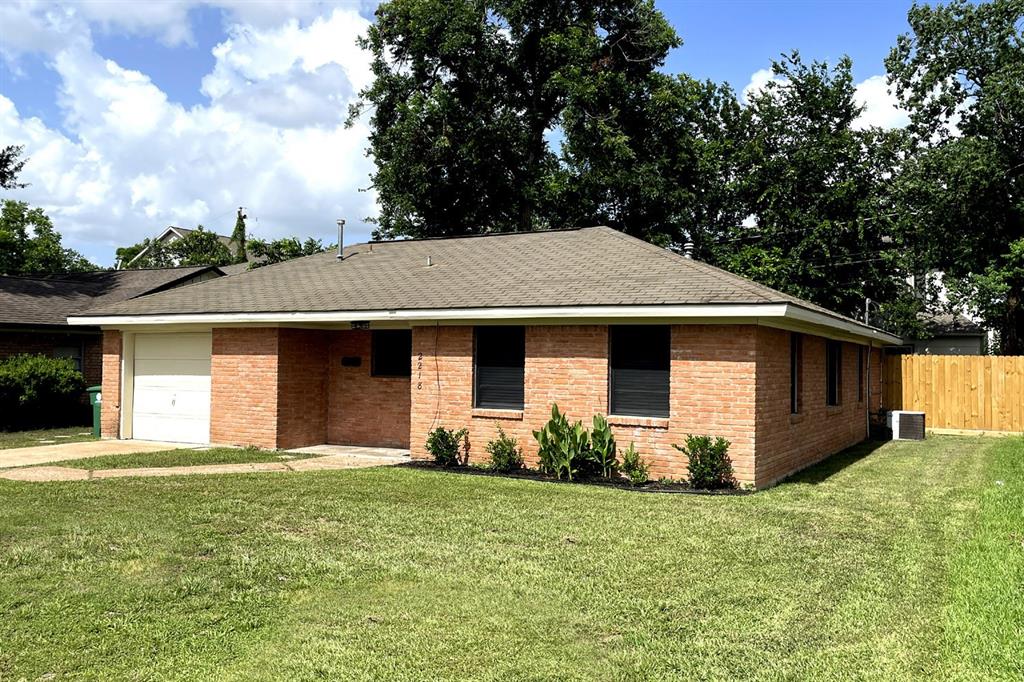
2218 Silverbonnet St, Houston, TX 77055
$-1,480
Cash flow
-18.2%
Cash-on-Cash Return
2.1%
Cap rate
0.4%
Rent to Value Ratio
Active
$379,900
3
bds
|
0
ba
|
2,123
sqft
|
built
2020
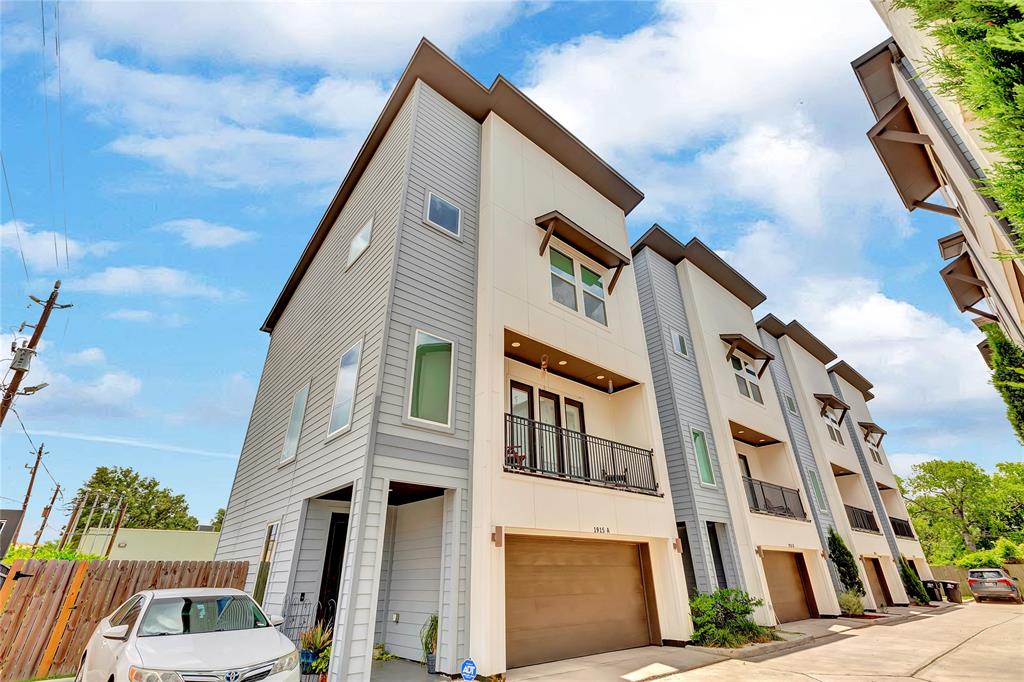
1915 Kolfahl St, Houston, TX 77023
$-532
Cash flow
-7.3%
Cash-on-Cash Return
4.6%
Cap rate
0.7%
Rent to Value Ratio
Active
$548,000
3
bds
|
0
ba
|
2,341
sqft
|
built
1975
201 Vanderpool Ln, Houston, TX 77024
$-2,127
Cash flow
-20.3%
Cash-on-Cash Return
1.6%
Cap rate
0.6%
Rent to Value Ratio
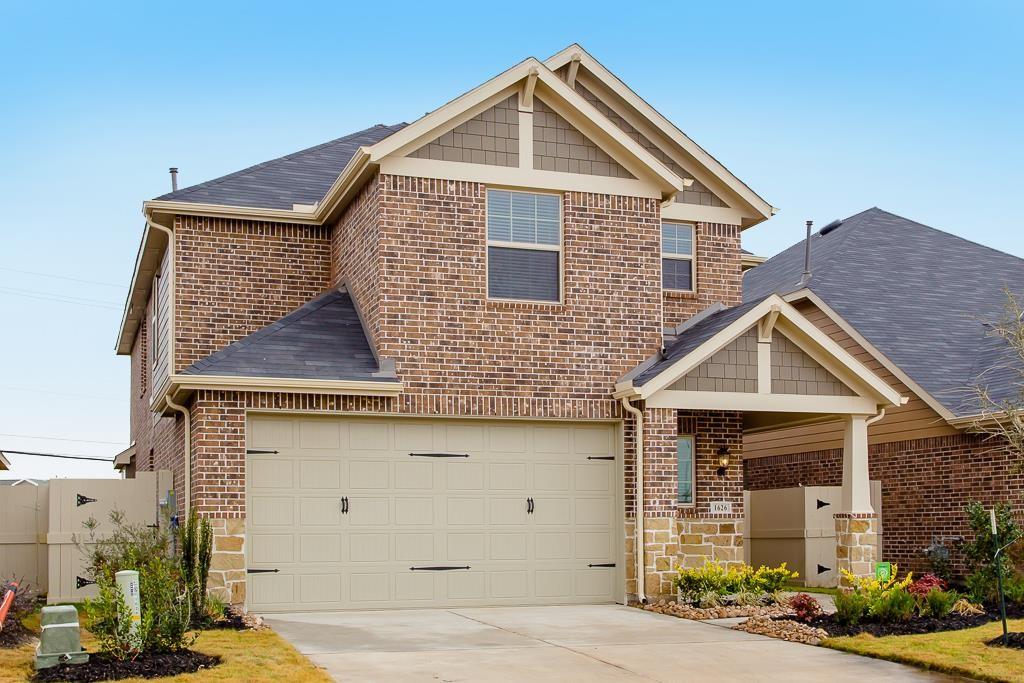
Active
$360,000
4
bds
|
0
ba
|
2,813
sqft
|
built
2016
1626 Summer City Dr, Houston, TX 77047
$-152
Cash flow
-2.2%
Cash-on-Cash Return
5.8%
Cap rate
0.7%
Rent to Value Ratio
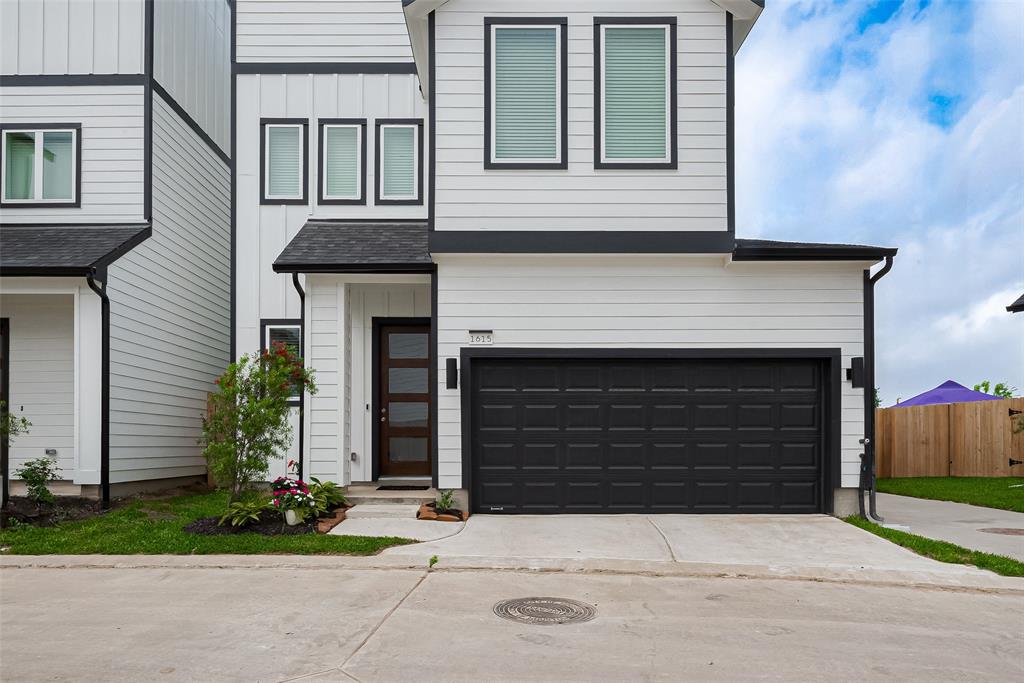
Active
$479,990
3
bds
|
0
ba
|
2,369
sqft
|
built
2025
1615 Regents Gate Rd, Houston, TX 77055
$-1,397
Cash flow
-15.2%
Cash-on-Cash Return
2.8%
Cap rate
0.4%
Rent to Value Ratio
Active
$279,900
3
bds
|
0
ba
|
1,488
sqft
|
built
1982
15410 Lindita Dr, Houston, TX 77083
$-601
Cash flow
-11.2%
Cash-on-Cash Return
3.7%
Cap rate
0.6%
Rent to Value Ratio
Active
$212,000
3
bds
|
0
ba
|
1,298
sqft
|
built
1945
3437 Seabrook St, Houston, TX 77021
$132
Cash flow
3.2%
Cash-on-Cash Return
7.0%
Cap rate
0.8%
Rent to Value Ratio
Active
$97,800
1
bds
|
0
ba
|
909
sqft
|
built
1983
3770 Lovers Wood Ln, Houston, TX 77014
$-274
Cash flow
-14.6%
Cash-on-Cash Return
2.9%
Cap rate
1.3%
Rent to Value Ratio
Active
$325,000
2
bds
|
0
ba
|
1,300
sqft
|
built
2006
1010 Rosine St, Houston, TX 77019
$-1,439
Cash flow
-23.1%
Cash-on-Cash Return
1.0%
Cap rate
0.8%
Rent to Value Ratio
Active
$248,500
2
bds
|
0
ba
|
1,583
sqft
|
built
1969
45 Champions Colony E, Houston, TX 77069
$-672
Cash flow
-14.1%
Cash-on-Cash Return
3.0%
Cap rate
0.7%
Rent to Value Ratio
Active
$217,000
3
bds
|
0
ba
|
1,437
sqft
|
built
1955
5130 Enyart St, Houston, TX 77021
$-32
Cash flow
-0.8%
Cash-on-Cash Return
6.1%
Cap rate
0.7%
Rent to Value Ratio
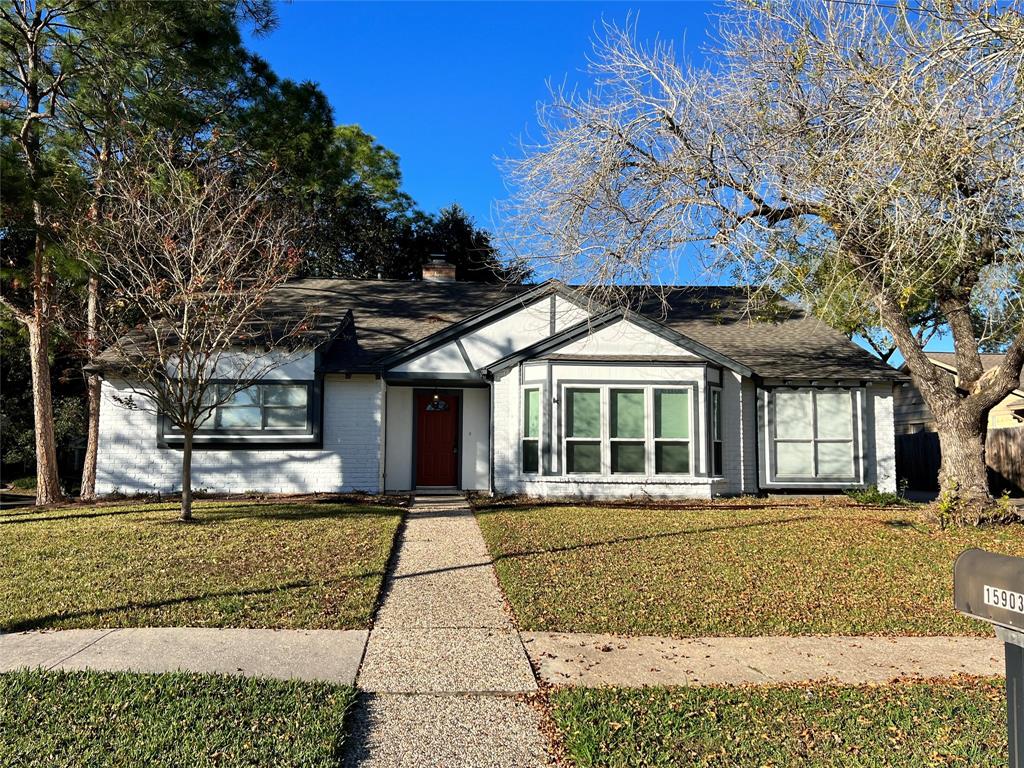
Active
$299,800
3
bds
|
0
ba
|
2,233
sqft
|
built
1978
15903 Brookvilla Dr, Houston, TX 77059
$-479
Cash flow
-8.3%
Cash-on-Cash Return
4.4%
Cap rate
0.8%
Rent to Value Ratio
Active
$249,000
3
bds
|
0
ba
|
2,584
sqft
|
built
1950
7751 Greenstone St, Houston, TX 77087
$-277
Cash flow
-5.8%
Cash-on-Cash Return
4.9%
Cap rate
0.8%
Rent to Value Ratio

Active
$319,900
4
bds
|
0
ba
|
1,600
sqft
|
built
1960
3808 Cochran St, Houston, TX 77009
$-705
Cash flow
-11.5%
Cash-on-Cash Return
3.6%
Cap rate
0.6%
Rent to Value Ratio

Active
$159,000
1
bds
|
0
ba
|
858
sqft
|
built
2003
9200 Westheimer Rd, Houston, TX 77063
$-562
Cash flow
-18.4%
Cash-on-Cash Return
2.0%
Cap rate
0.9%
Rent to Value Ratio
Active
$375,000
4
bds
|
0
ba
|
2,145
sqft
|
built
1936
1401 Scharpe St, Houston, TX 77023
$-758
Cash flow
-10.5%
Cash-on-Cash Return
3.9%
Cap rate
0.7%
Rent to Value Ratio
Active
$354,900
3
bds
|
0
ba
|
1,862
sqft
|
built
1978
11415 Pepperdine Ln, Houston, TX 77071
$-805
Cash flow
-11.8%
Cash-on-Cash Return
3.6%
Cap rate
0.6%
Rent to Value Ratio
Active
$627,000
4
bds
|
0
ba
|
3,466
sqft
|
built
1990
14226 Townshire Dr, Houston, TX 77077
$-1,867
Cash flow
-15.5%
Cash-on-Cash Return
2.7%
Cap rate
0.6%
Rent to Value Ratio
Active
$525,000
3
bds
|
0
ba
|
2,037
sqft
|
built
2012
506 Knox St, Houston, TX 77007
$-1,258
Cash flow
-12.5%
Cash-on-Cash Return
3.4%
Cap rate
0.7%
Rent to Value Ratio
Active
$439,000
3
bds
|
0
ba
|
2,139
sqft
|
built
2015
3309 Jefferson St, Houston, TX 77003
$-1,021
Cash flow
-12.1%
Cash-on-Cash Return
3.5%
Cap rate
0.7%
Rent to Value Ratio
Active
$230,000
3
bds
|
0
ba
|
1,227
sqft
|
built
1968
3906 Simsbrook Dr, Houston, TX 77045
$-441
Cash flow
-10.0%
Cash-on-Cash Return
4.0%
Cap rate
0.6%
Rent to Value Ratio
Active
$260,000
3
bds
|
0
ba
|
1,880
sqft
|
built
2004
19826 Imperial Stone Dr, Houston, TX 77073
$-523
Cash flow
-10.5%
Cash-on-Cash Return
3.9%
Cap rate
0.8%
Rent to Value Ratio
Pending
$2,999,000
5
bds
|
0
ba
|
4,984
sqft
|
built
1972
7 Tokeneke Trl, Houston, TX 77024
$-14,650
Cash flow
-25.5%
Cash-on-Cash Return
0.4%
Cap rate
0.2%
Rent to Value Ratio
Active
$179,000
3
bds
|
0
ba
|
1,231
sqft
|
built
1953
10124 Homestead Rd, Houston, TX 77016
$14
Cash flow
0.4%
Cash-on-Cash Return
6.4%
Cap rate
0.9%
Rent to Value Ratio

Active
$600,000
3
bds
|
0
ba
|
1,581
sqft
|
built
1920
1032 Algregg St, Houston, TX 77009
$-1,927
Cash flow
-16.8%
Cash-on-Cash Return
2.4%
Cap rate
0.5%
Rent to Value Ratio
Active under contract
$492,500
4
bds
|
0
ba
|
2,948
sqft
|
built
2000
11607 Ruby Canyon Ln, Houston, TX 77095
$-1,254
Cash flow
-13.3%
Cash-on-Cash Return
3.2%
Cap rate
0.6%
Rent to Value Ratio
Active
$239,850
4
bds
|
0
ba
|
1,832
sqft
|
built
1955
505 Marleen St, Houston, TX 77034
$-97
Cash flow
-2.1%
Cash-on-Cash Return
5.8%
Cap rate
0.9%
Rent to Value Ratio