Houston, TX Investment Properties for Sale
Browse homes for sale and investment properties in Houston, TX. Refine your search by price, property type, or more.
Best cash flowing properties in Houston, TX
Active
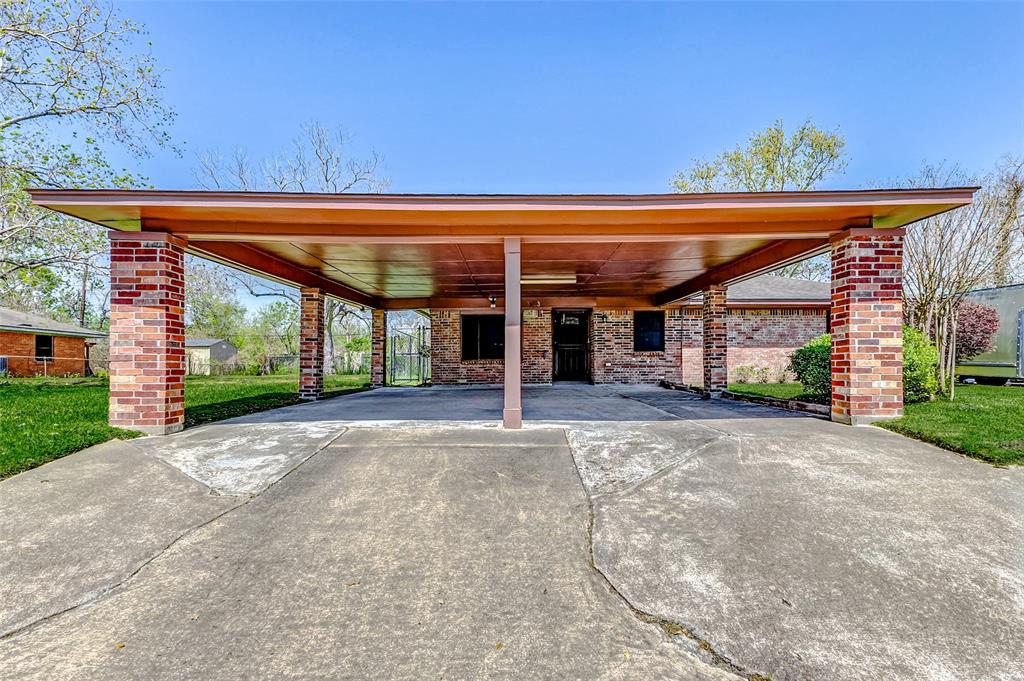
$145,000
3
bds
|
0
ba
|
1,896
sqft
|
built
1955
3023 Sunnydale Dr, Houston, TX 77051
$355
Cash flow
12.8%
Cash-on-Cash Return
8.6%
Cap rate
1.2%
Rent to Value Ratio
Active
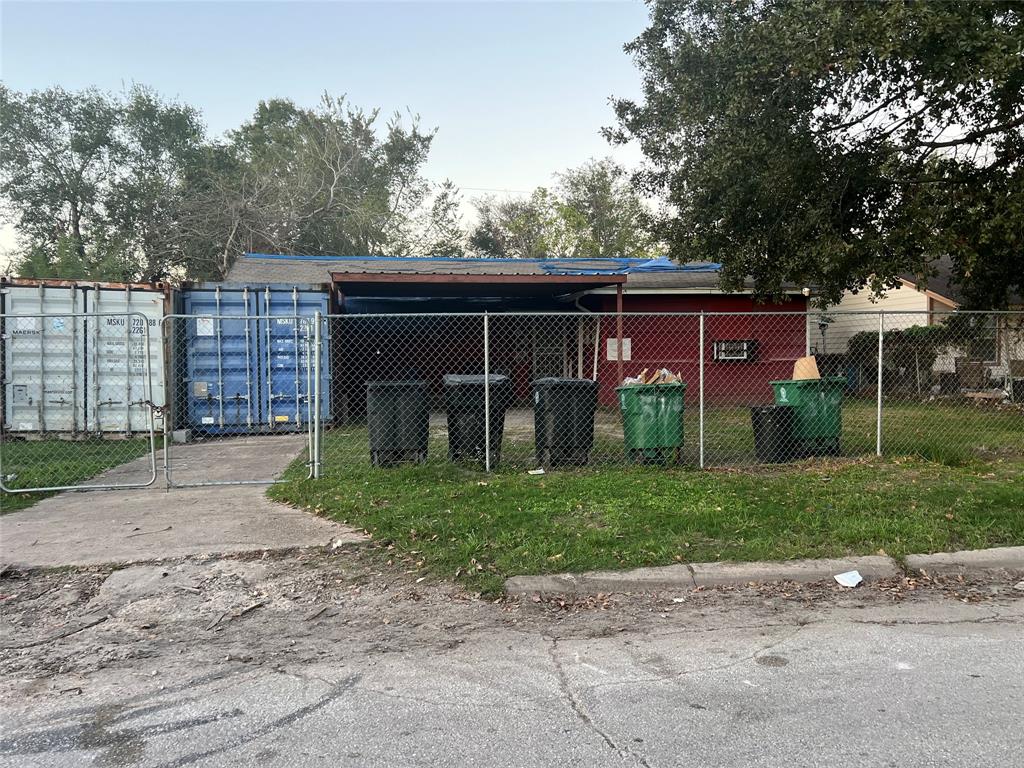
$130,000
3
bds
|
0
ba
|
1,274
sqft
|
built
1947
5719 Southwind St, Houston, TX 77033
$351
Cash flow
14.1%
Cash-on-Cash Return
8.9%
Cap rate
1.1%
Rent to Value Ratio
8,547 out of 8,994 properties for sale in Houston, TX
Limited Results Shown
Create a free account, or log in to reveal all property listings and enjoy the complete experience.
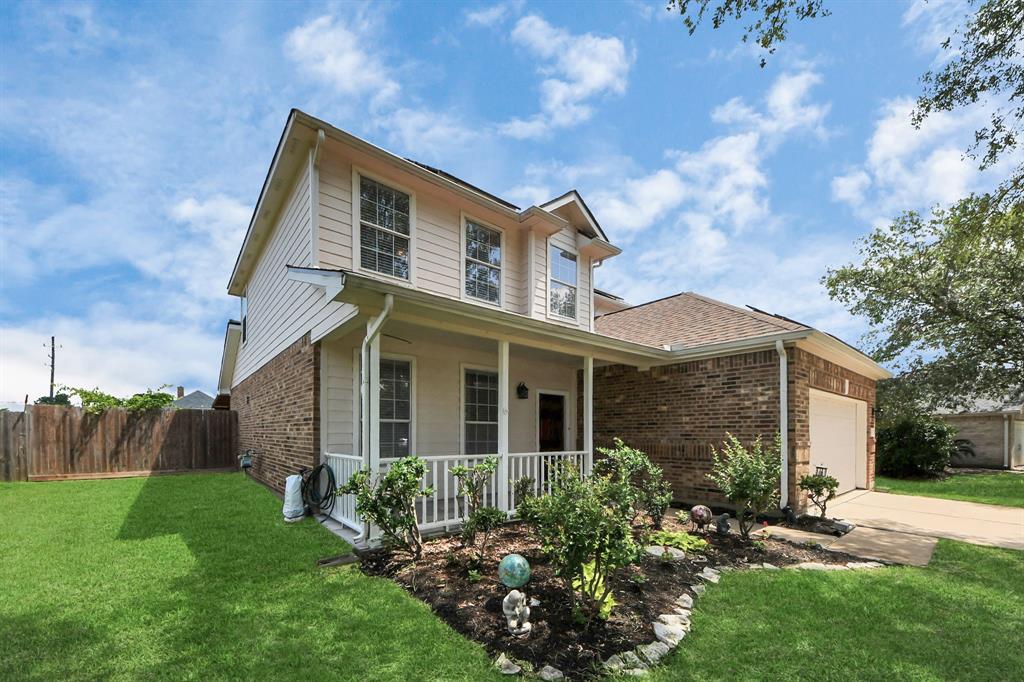
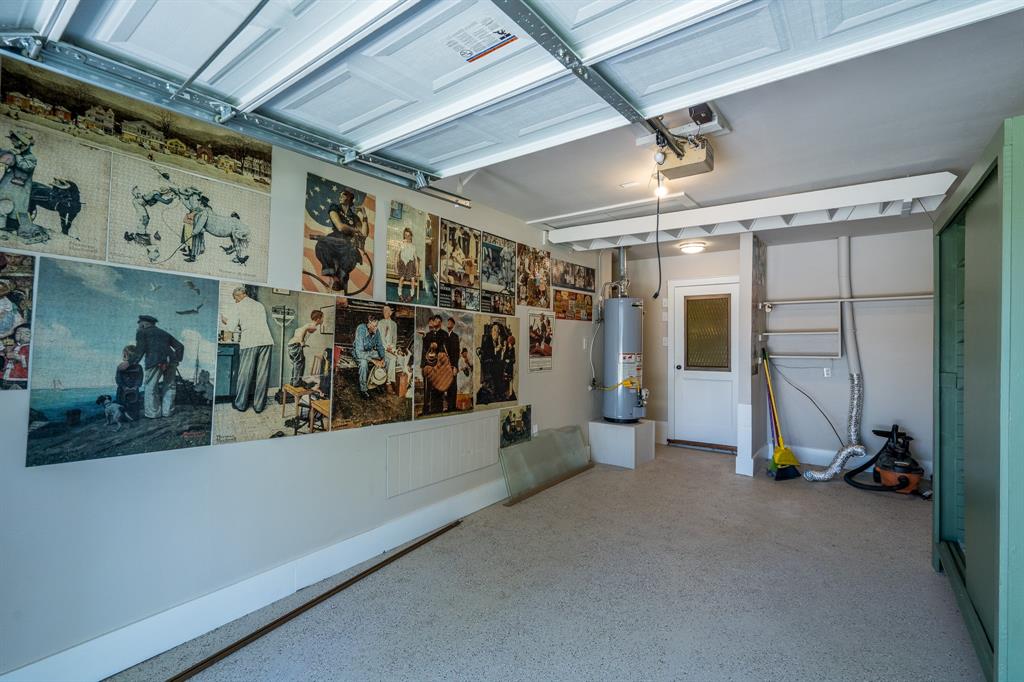
Active
$350,000
4
bds
|
0
ba
|
2,306
sqft
|
built
2002
13114 Oak Ledge Dr, Houston, TX 77065
$-611
Cash flow
-9.1%
Cash-on-Cash Return
3.6%
Cap rate
0.7%
Rent to Value Ratio
Active
$665,000
4
bds
|
0
ba
|
2,000
sqft
|
built
1952
2007 Lamonte Ln, Houston, TX 77018
$-2,102
Cash flow
-16.5%
Cash-on-Cash Return
1.9%
Cap rate
0.4%
Rent to Value Ratio
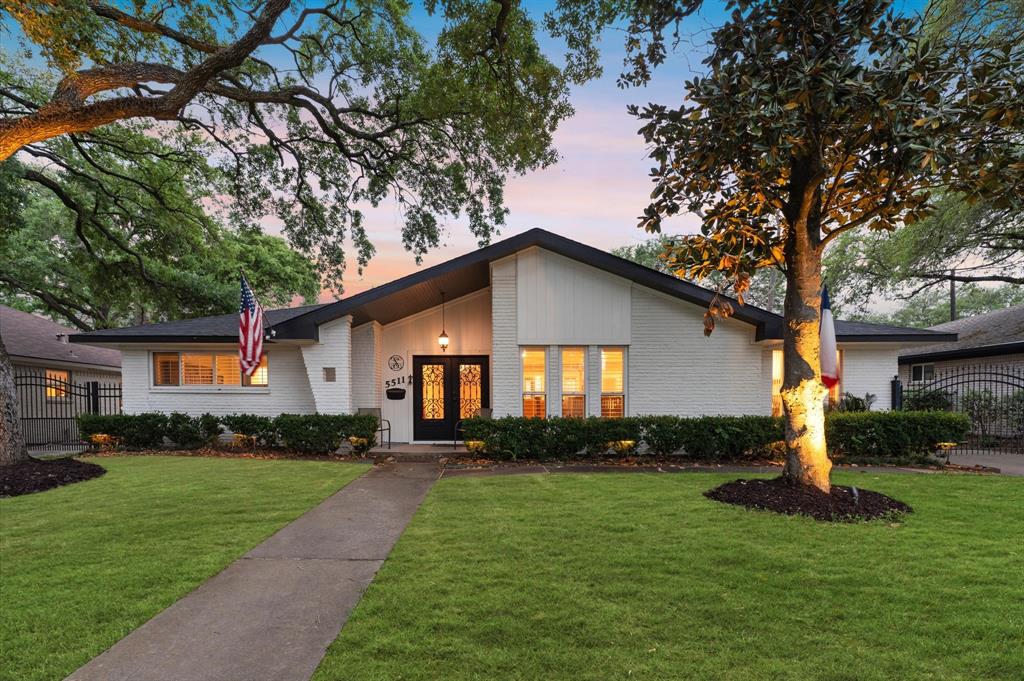
Active
$850,000
4
bds
|
0
ba
|
3,097
sqft
|
built
1963
5511 Queensloch Dr, Houston, TX 77096
$-2,687
Cash flow
-16.5%
Cash-on-Cash Return
1.9%
Cap rate
0.4%
Rent to Value Ratio
Active
$395,000
3
bds
|
0
ba
|
2,234
sqft
|
built
2006
5817 Darling St, Houston, TX 77007
$-614
Cash flow
-8.1%
Cash-on-Cash Return
3.8%
Cap rate
0.7%
Rent to Value Ratio
Active
$265,000
3
bds
|
0
ba
|
1,718
sqft
|
built
2006
4418 Anselm St, Houston, TX 77045
$-307
Cash flow
-6.0%
Cash-on-Cash Return
4.3%
Cap rate
0.8%
Rent to Value Ratio
Active
$1,395,000
5
bds
|
0
ba
|
2,846
sqft
|
built
1920
418 Byrne St, Houston, TX 77009
$-6,069
Cash flow
-22.7%
Cash-on-Cash Return
0.5%
Cap rate
0.3%
Rent to Value Ratio
Active
$1,175,999
2
bds
|
0
ba
|
2,273
sqft
|
built
2003
3333 Allen Pkwy, Houston, TX 77019
$-3,473
Cash flow
-15.4%
Cash-on-Cash Return
2.1%
Cap rate
0.7%
Rent to Value Ratio
Active
$2,995,000
4
bds
|
0
ba
|
3,306
sqft
|
built
1974
435 Flint Point Dr, Houston, TX 77024
$-12,966
Cash flow
-22.6%
Cash-on-Cash Return
0.5%
Cap rate
0.2%
Rent to Value Ratio
Active
$259,000
3
bds
|
0
ba
|
1,665
sqft
|
built
1981
11835 Sandpiper Dr, Houston, TX 77035
$-245
Cash flow
-4.9%
Cash-on-Cash Return
4.5%
Cap rate
0.8%
Rent to Value Ratio

Active
$121,000
1
bds
|
0
ba
|
729
sqft
|
built
1980
7950 N Stadium Dr, Houston, TX 77030
$-193
Cash flow
-8.3%
Cash-on-Cash Return
3.8%
Cap rate
1.2%
Rent to Value Ratio

Active
$269,000
3
bds
|
0
ba
|
1,614
sqft
|
built
2007
2707 Trementina Dr, Houston, TX 77088
$-334
Cash flow
-6.5%
Cash-on-Cash Return
4.2%
Cap rate
0.7%
Rent to Value Ratio
Active
$747,000
3
bds
|
0
ba
|
3,378
sqft
|
built
1997
1543 Adams Walk Ct, Houston, TX 77077
$-1,193
Cash flow
-8.3%
Cash-on-Cash Return
3.8%
Cap rate
0.7%
Rent to Value Ratio
Active
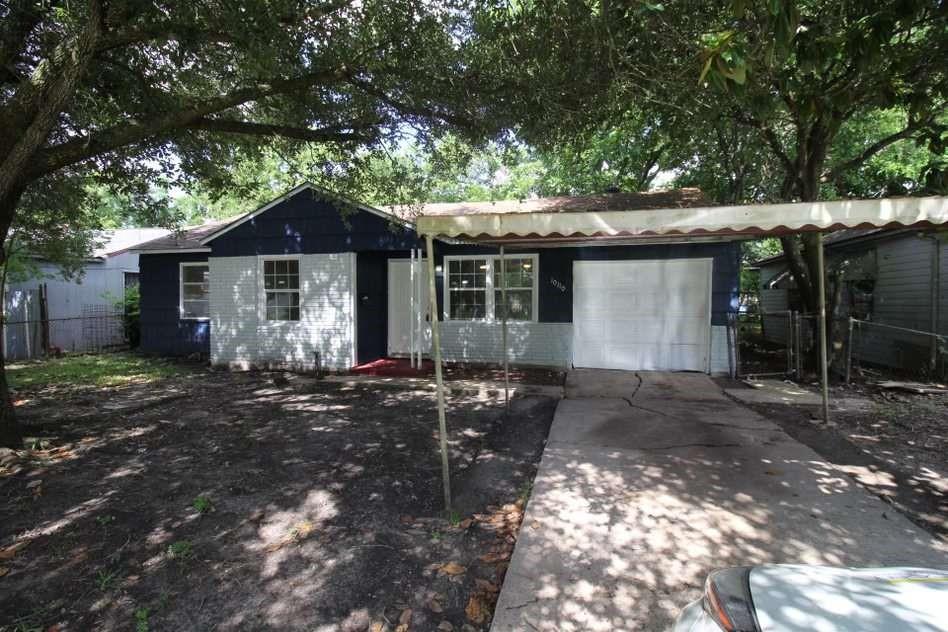
$169,629
3
bds
|
0
ba
|
912
sqft
|
built
1955
10110 Rosehaven Dr, Houston, TX 77051
$-32
Cash flow
-1.0%
Cash-on-Cash Return
5.5%
Cap rate
0.8%
Rent to Value Ratio
Active
$285,000
4
bds
|
0
ba
|
1,850
sqft
|
built
1960
7425 Rhobell St, Houston, TX 77016
$46
Cash flow
0.8%
Cash-on-Cash Return
5.9%
Cap rate
0.8%
Rent to Value Ratio
Active
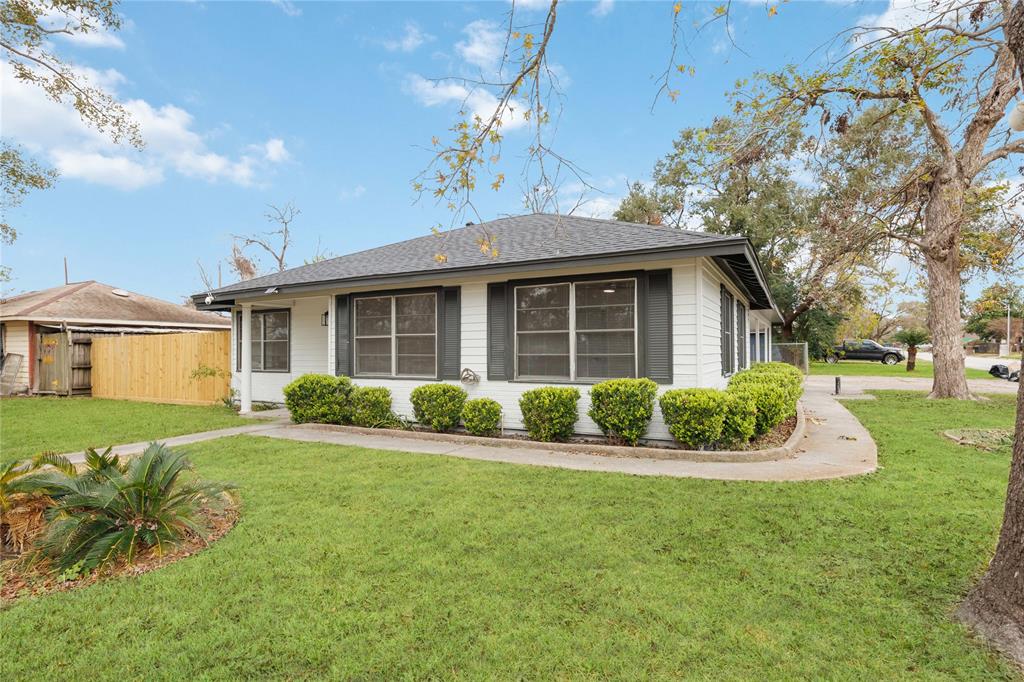
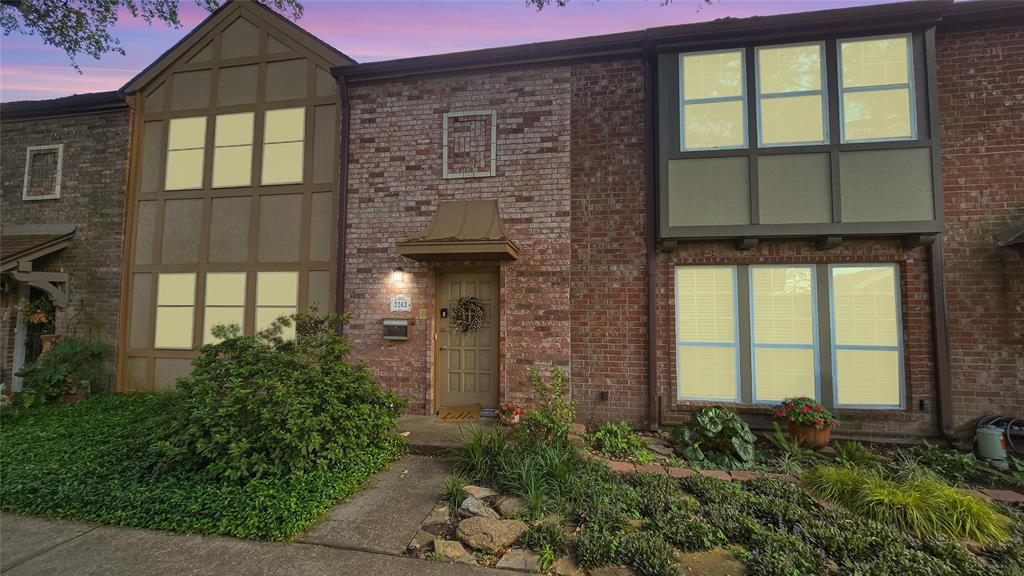
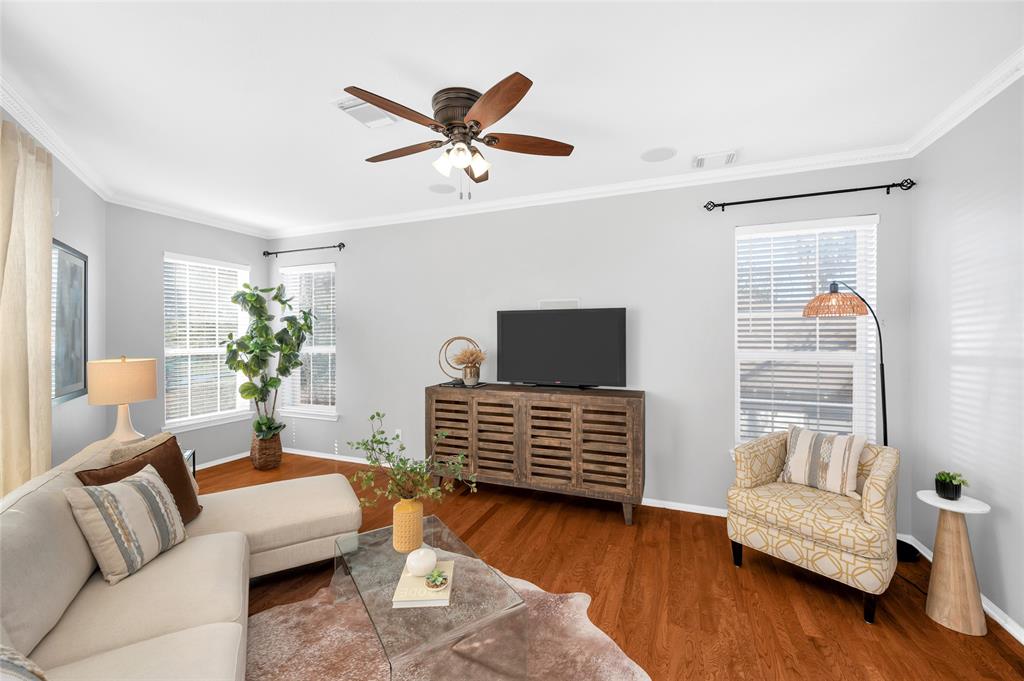
$235,000
3
bds
|
0
ba
|
1,976
sqft
|
built
1970
2263 Triway Ln, Houston, TX 77043
$-378
Cash flow
-8.4%
Cash-on-Cash Return
3.7%
Cap rate
0.9%
Rent to Value Ratio

Active
$789,000
3
bds
|
0
ba
|
3,529
sqft
|
built
2007
2217 Nantucket Dr, Houston, TX 77057
$-1,281
Cash flow
-8.5%
Cash-on-Cash Return
3.7%
Cap rate
0.7%
Rent to Value Ratio

Active
$325,000
3
bds
|
0
ba
|
2,080
sqft
|
built
1990
7915 Autumn Laurel Trl, Houston, TX 77095
$-632
Cash flow
-10.1%
Cash-on-Cash Return
3.3%
Cap rate
0.7%
Rent to Value Ratio
Active
$375,000
3
bds
|
0
ba
|
2,187
sqft
|
built
2006
1907 Fletcher St, Houston, TX 77009
$-550
Cash flow
-7.7%
Cash-on-Cash Return
3.9%
Cap rate
0.7%
Rent to Value Ratio
Active
$229,900
3
bds
|
0
ba
|
1,708
sqft
|
built
2004
7007 Woodridge Square Dr, Houston, TX 77087
$-478
Cash flow
-10.8%
Cash-on-Cash Return
3.2%
Cap rate
0.8%
Rent to Value Ratio
Active
$170,000
2
bds
|
0
ba
|
1,224
sqft
|
built
1977
2400 N Braeswood Blvd, Houston, TX 77030
$-668
Cash flow
-20.5%
Cash-on-Cash Return
1.0%
Cap rate
0.9%
Rent to Value Ratio
Active
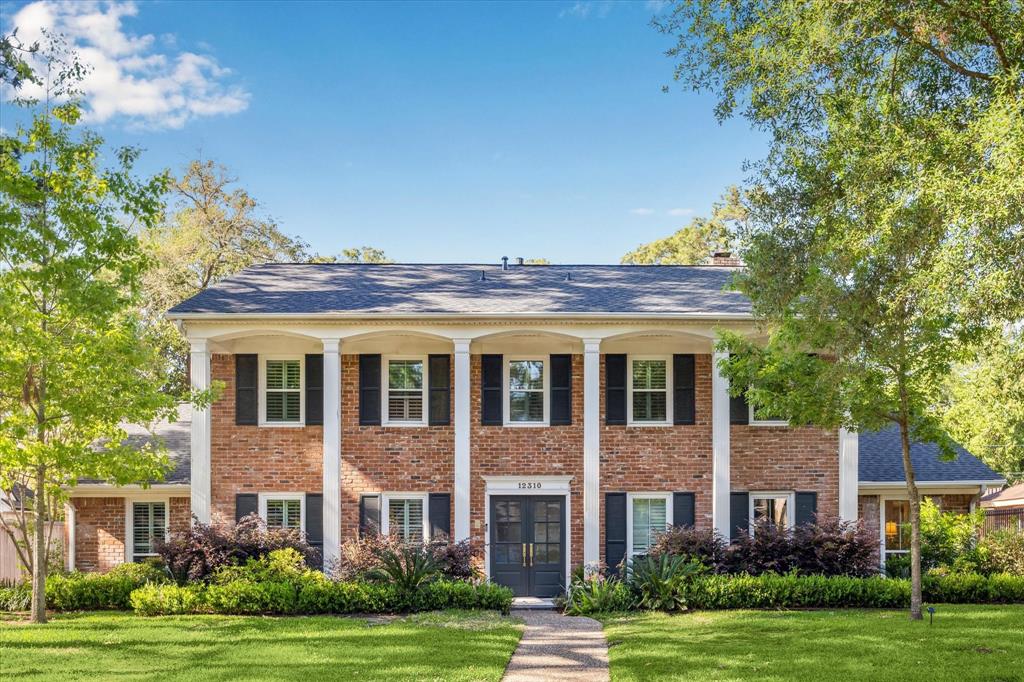
$1,595,000
5
bds
|
0
ba
|
3,600
sqft
|
built
1962
12310 Old Oaks Dr, Houston, TX 77024
$-5,999
Cash flow
-19.6%
Cash-on-Cash Return
1.2%
Cap rate
0.4%
Rent to Value Ratio
Pending
$309,000
3
bds
|
0
ba
|
2,364
sqft
|
built
2017
11918 Sabine Woods Trl, Houston, TX 77038
$-557
Cash flow
-9.4%
Cash-on-Cash Return
3.5%
Cap rate
0.8%
Rent to Value Ratio
Active
$530,000
3
bds
|
0
ba
|
0
sqft
|
built
2023
1037 W 17th St, Houston, TX 77008
$-253
Cash flow
-2.5%
Cash-on-Cash Return
5.1%
Cap rate
0.7%
Rent to Value Ratio
Active
$459,999
5
bds
|
0
ba
|
3,441
sqft
|
built
2015
1905 Emerald Breeze Ct, Houston, TX 77089
$-838
Cash flow
-9.5%
Cash-on-Cash Return
3.5%
Cap rate
0.8%
Rent to Value Ratio
Active
$400,000
3
bds
|
0
ba
|
1,646
sqft
|
built
1950
803 E 38th St, Houston, TX 77022
$-397
Cash flow
-5.2%
Cash-on-Cash Return
4.5%
Cap rate
0.6%
Rent to Value Ratio
Active
$140,000
2
bds
|
0
ba
|
1,264
sqft
|
built
1979
3005 Walnut Bend Ln, Houston, TX 77042
$-509
Cash flow
-19.0%
Cash-on-Cash Return
1.3%
Cap rate
1.0%
Rent to Value Ratio
Active
$354,999
3
bds
|
0
ba
|
1,435
sqft
|
built
2018
110 N Hutcheson St, Houston, TX 77003
$-832
Cash flow
-12.2%
Cash-on-Cash Return
2.9%
Cap rate
0.7%
Rent to Value Ratio
Active
$253,000
3
bds
|
0
ba
|
1,786
sqft
|
built
1973
5514 Beverlyhill St, Houston, TX 77056
$-586
Cash flow
-12.1%
Cash-on-Cash Return
2.9%
Cap rate
0.9%
Rent to Value Ratio
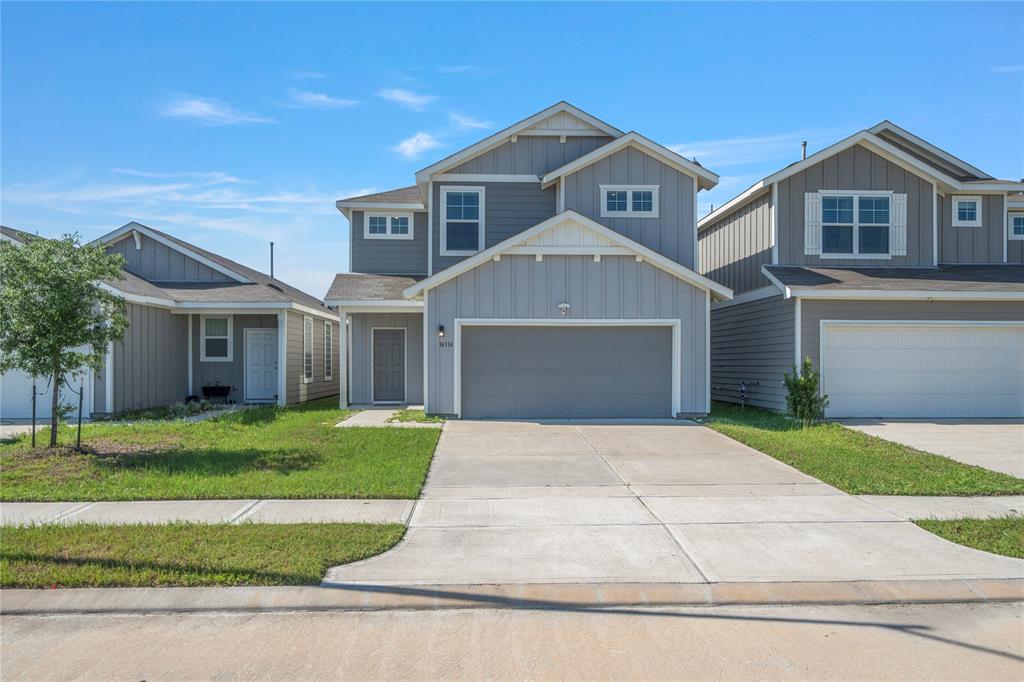
Active
$315,000
4
bds
|
0
ba
|
1,830
sqft
|
built
2021
16314 Dutton Clover Dr, Houston, TX 77084
$-432
Cash flow
-7.2%
Cash-on-Cash Return
4.0%
Cap rate
0.8%
Rent to Value Ratio
Active
$164,899
3
bds
|
0
ba
|
1,880
sqft
|
built
2021
5802 Twisted Pine Ct, Houston, TX 77039
$-66
Cash flow
-2.1%
Cash-on-Cash Return
5.2%
Cap rate
1.2%
Rent to Value Ratio
Active
$589,900
3
bds
|
0
ba
|
2,355
sqft
|
built
1965
1926 Mapleton Dr, Houston, TX 77043
$-1,162
Cash flow
-10.3%
Cash-on-Cash Return
3.3%
Cap rate
0.7%
Rent to Value Ratio
Active
$569,900
5
bds
|
0
ba
|
3,412
sqft
|
built
1992
14903 Evergreen Ridge Way, Houston, TX 77062
$-799
Cash flow
-7.3%
Cash-on-Cash Return
4.0%
Cap rate
0.8%
Rent to Value Ratio
Active
$145,000
3
bds
|
0
ba
|
1,896
sqft
|
built
1955
3023 Sunnydale Dr, Houston, TX 77051
$355
Cash flow
12.8%
Cash-on-Cash Return
8.6%
Cap rate
1.2%
Rent to Value Ratio
Active
$169,900
3
bds
|
0
ba
|
1,411
sqft
|
built
1977
9923 Valley Sun Dr, Houston, TX 77078
$54
Cash flow
1.7%
Cash-on-Cash Return
6.1%
Cap rate
1.0%
Rent to Value Ratio
Active
$365,000
3
bds
|
0
ba
|
1,958
sqft
|
built
2018
427 Yale Oaks Ln, Houston, TX 77091
$-591
Cash flow
-8.4%
Cash-on-Cash Return
3.7%
Cap rate
0.8%
Rent to Value Ratio
Active
$950,000
3
bds
|
0
ba
|
3,250
sqft
|
built
2021
846 Dunleigh Meadows Ln, Houston, TX 77055
$-2,078
Cash flow
-11.4%
Cash-on-Cash Return
3.1%
Cap rate
0.7%
Rent to Value Ratio
Active
$264,900
5
bds
|
0
ba
|
2,488
sqft
|
built
1976
14406 Roundstone Ln, Houston, TX 77015
$-207
Cash flow
-4.1%
Cash-on-Cash Return
4.7%
Cap rate
0.8%
Rent to Value Ratio
Active
$130,000
3
bds
|
0
ba
|
1,274
sqft
|
built
1947
5719 Southwind St, Houston, TX 77033
$351
Cash flow
14.1%
Cash-on-Cash Return
8.9%
Cap rate
1.1%
Rent to Value Ratio

Active
$285,000
3
bds
|
0
ba
|
2,113
sqft
|
built
1982
16922 Nicole Ln, Houston, TX 77084
$-535
Cash flow
-9.8%
Cash-on-Cash Return
3.4%
Cap rate
0.7%
Rent to Value Ratio
Active
$90,000
2
bds
|
0
ba
|
1,164
sqft
|
built
1981
10211 Sugar Branch Dr, Houston, TX 77036
$-291
Cash flow
-16.9%
Cash-on-Cash Return
1.8%
Cap rate
1.1%
Rent to Value Ratio