Houston, TX Investment Properties for Sale
Browse homes for sale and investment properties in Houston, TX. Refine your search by price, property type, or more.
Best cash flowing properties in Houston, TX
Active
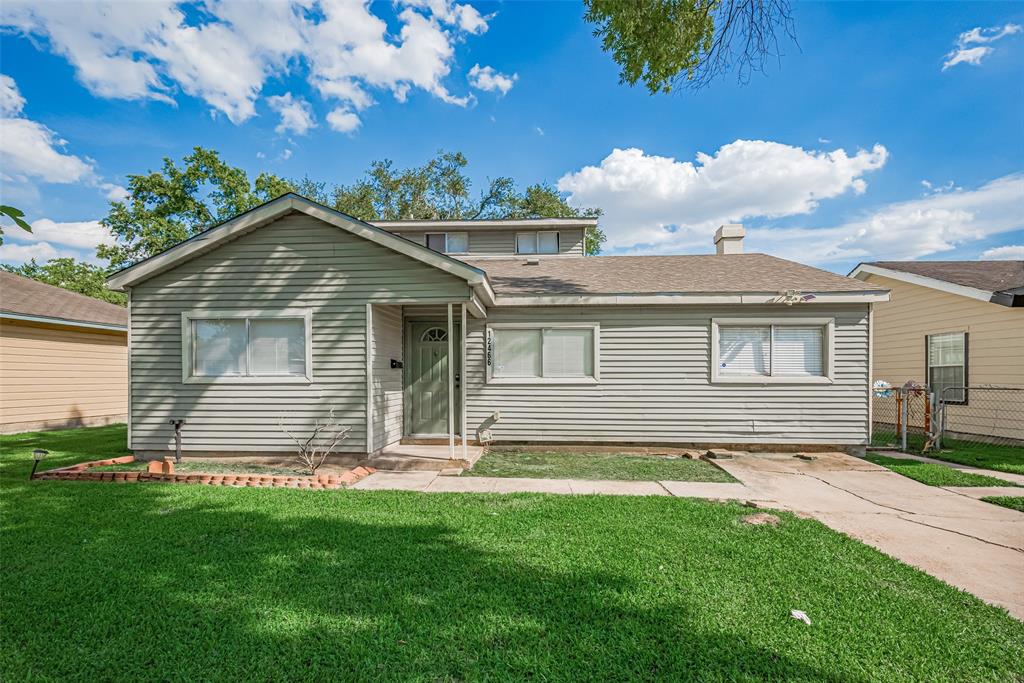
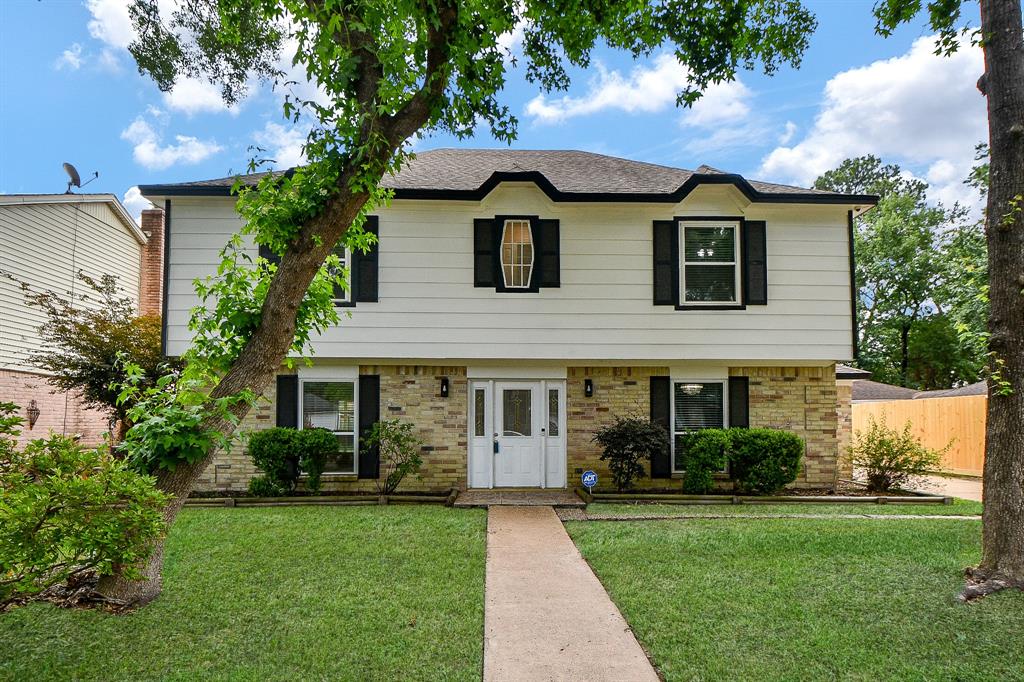
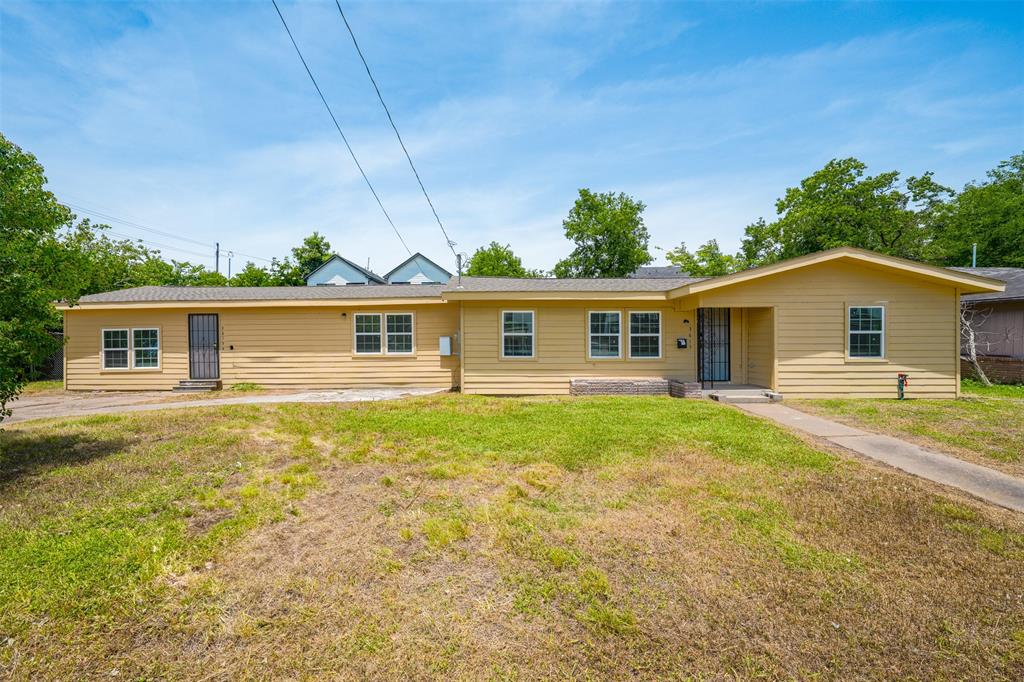
$165,000
3
bds
|
0
ba
|
1,466
sqft
|
built
1952
12466 Birdie Ln, Houston, TX 77015
$323
Cash flow
10.2%
Cash-on-Cash Return
8.0%
Cap rate
1.0%
Rent to Value Ratio
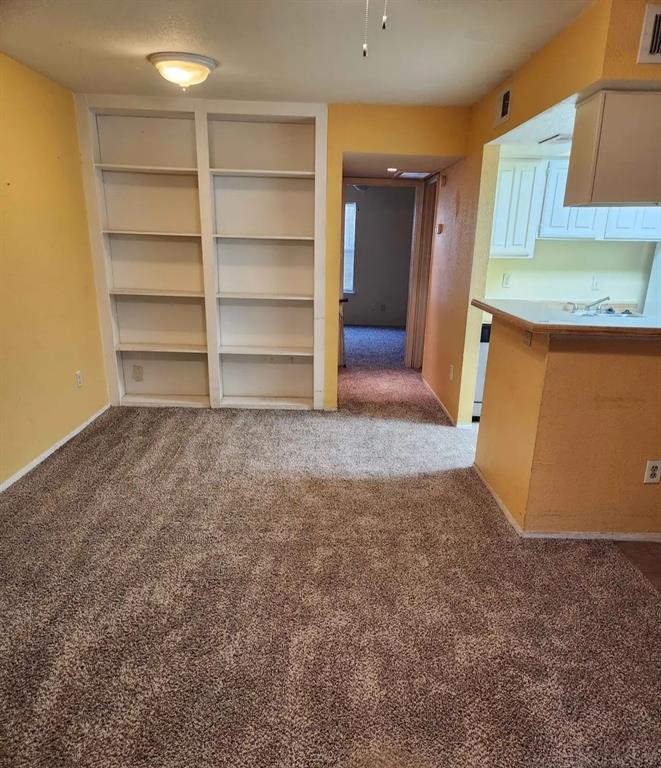
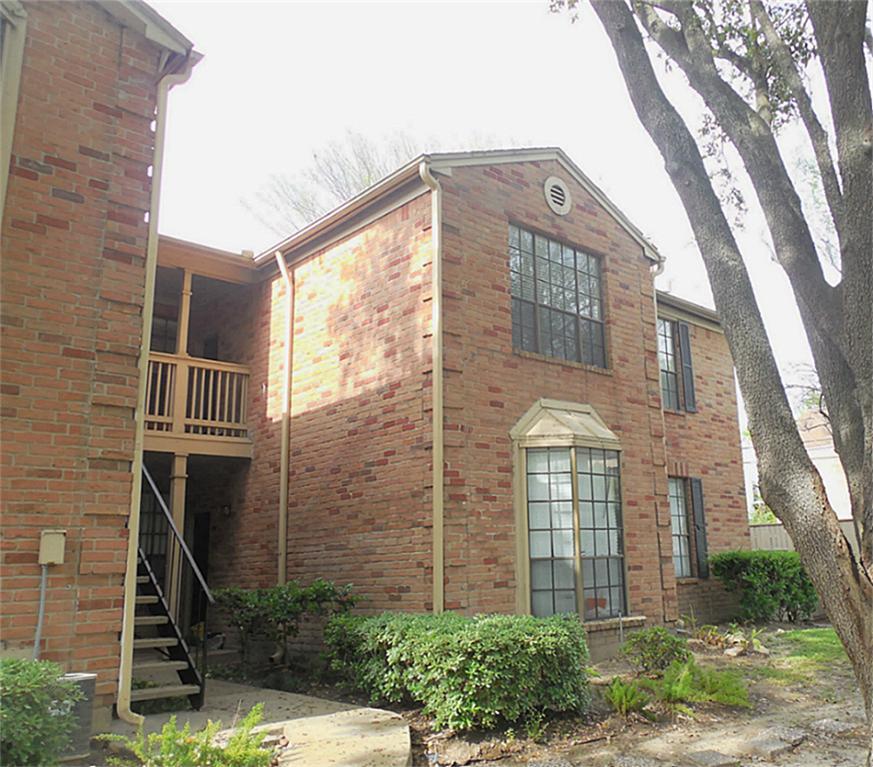
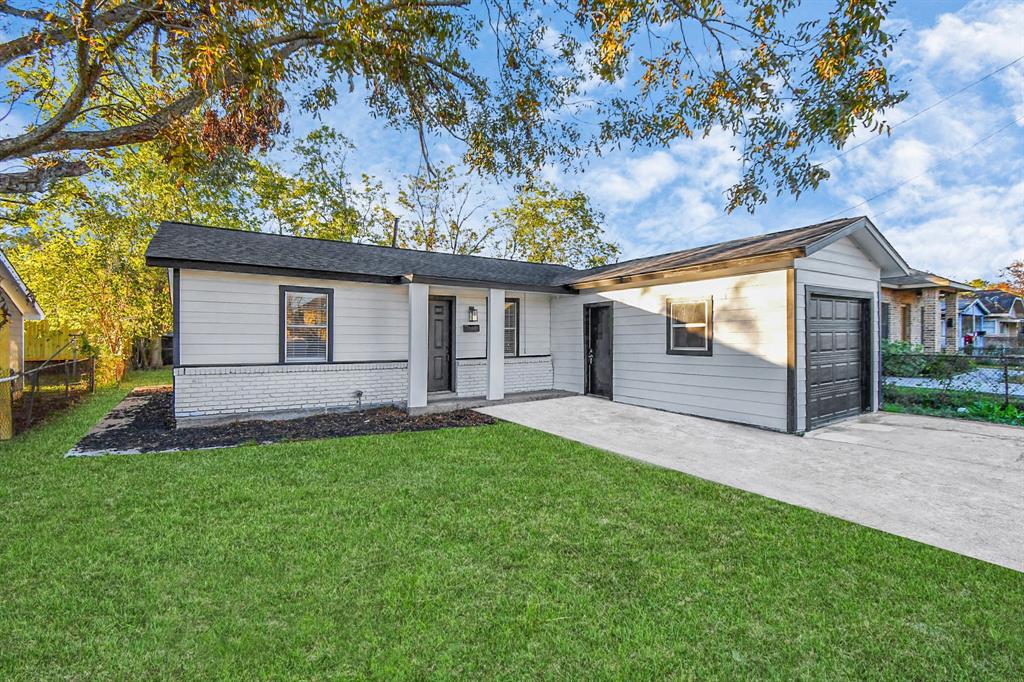
Active
$64,900
1
bds
|
0
ba
|
693
sqft
|
built
1980
6001 Reims Rd, Houston, TX 77036
$316
Cash flow
5.7%
Cash-on-Cash Return
5.8%
Cap rate
1.5%
Rent to Value Ratio
8,547 out of 8,994 properties for sale in Houston, TX
Limited Results Shown
Create a free account, or log in to reveal all property listings and enjoy the complete experience.
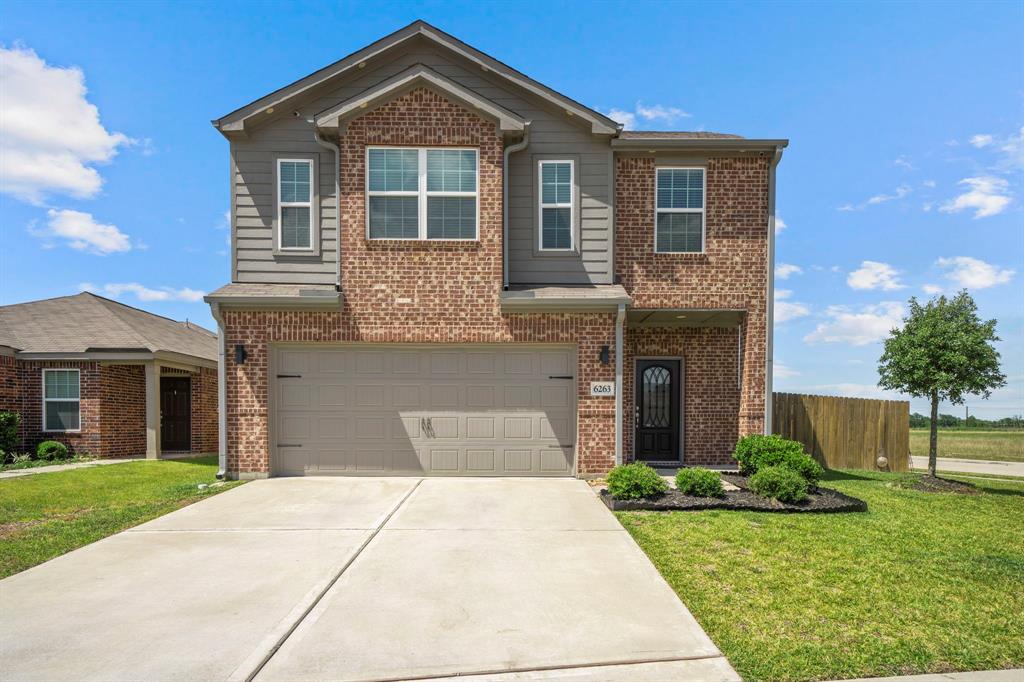
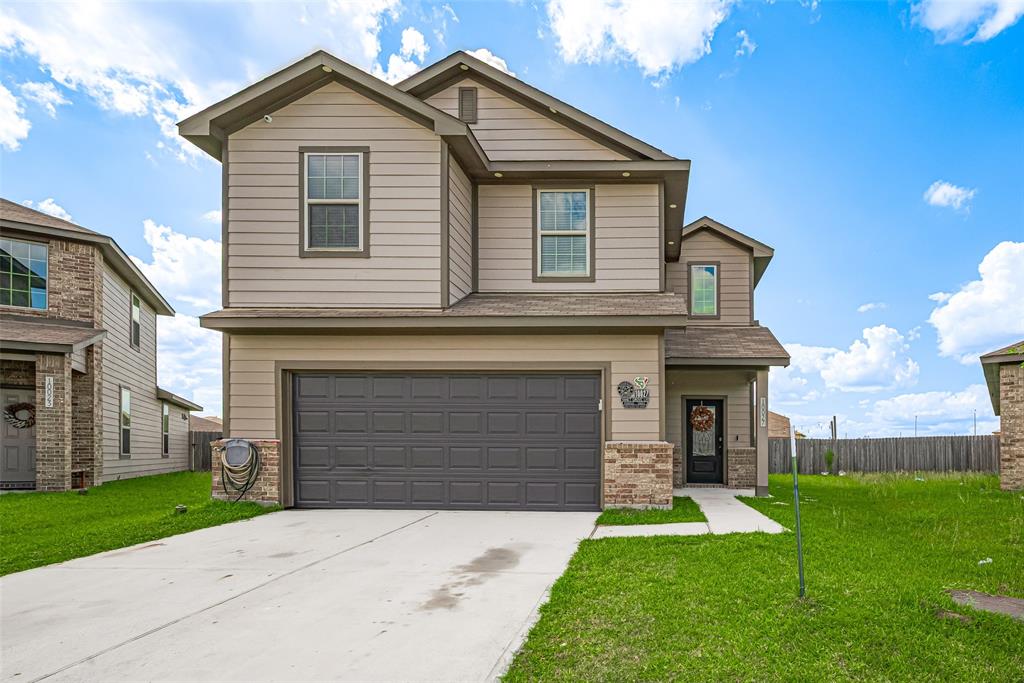
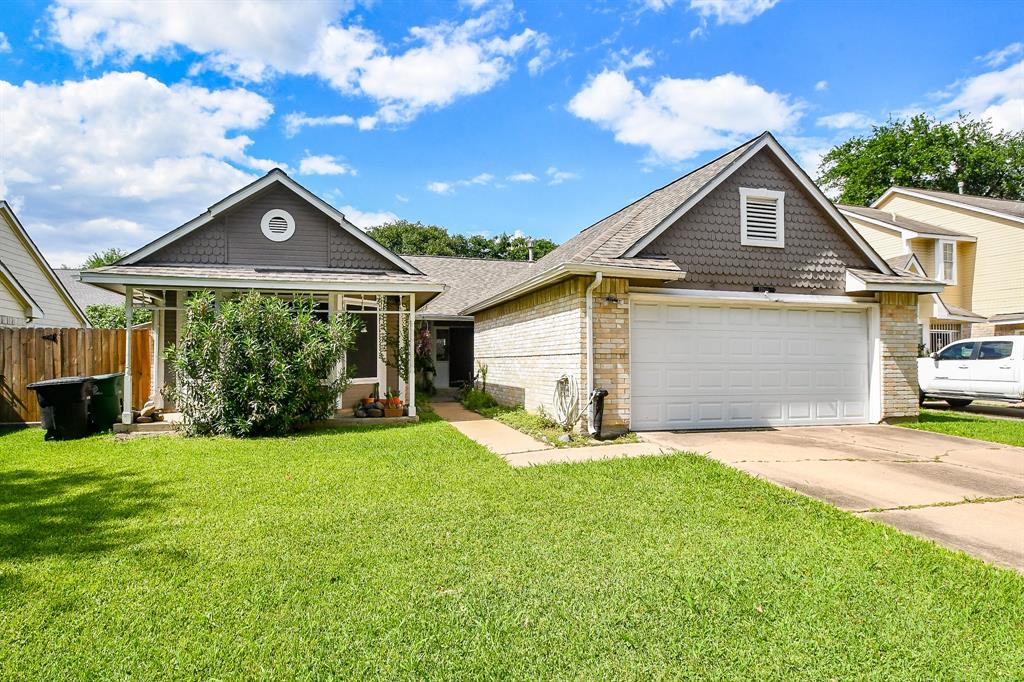
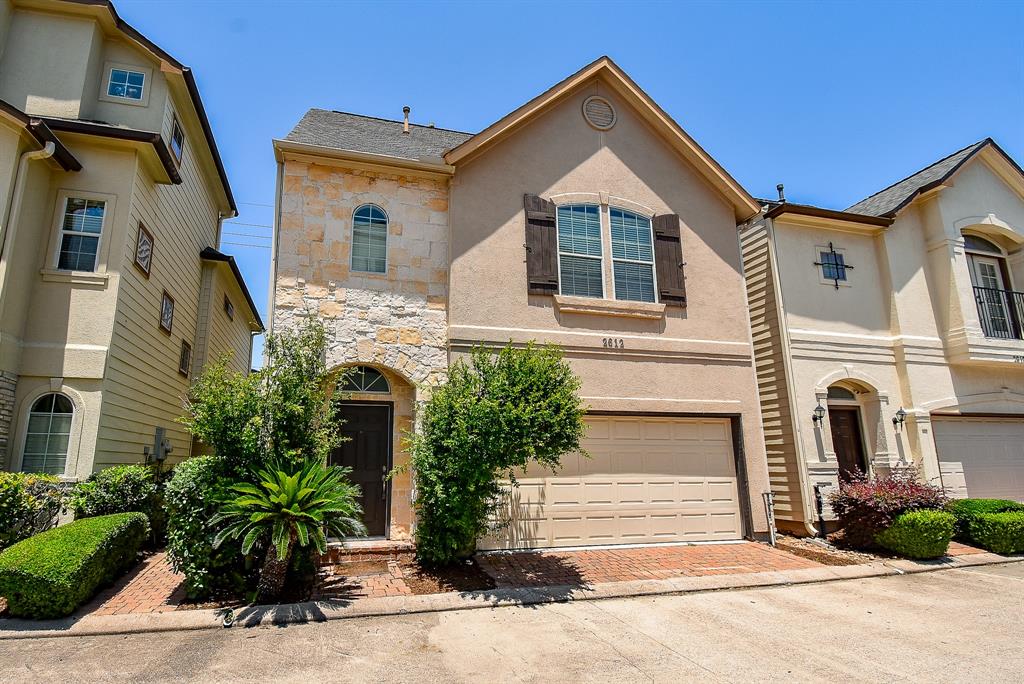
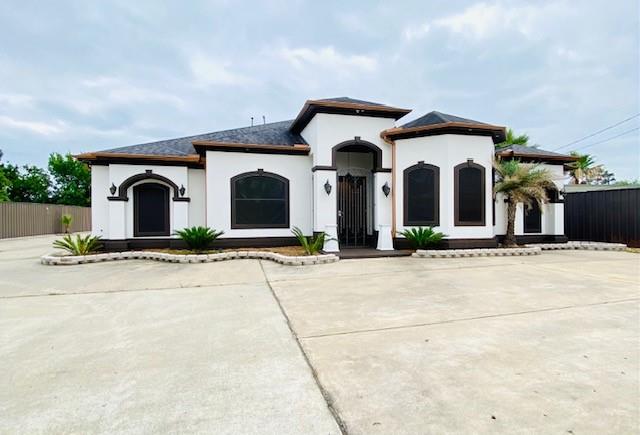
Active
$349,900
4
bds
|
0
ba
|
2,453
sqft
|
built
2019
6263 El Turquesa Dr, Houston, TX 77048
$-658
Cash flow
-9.8%
Cash-on-Cash Return
3.4%
Cap rate
0.7%
Rent to Value Ratio

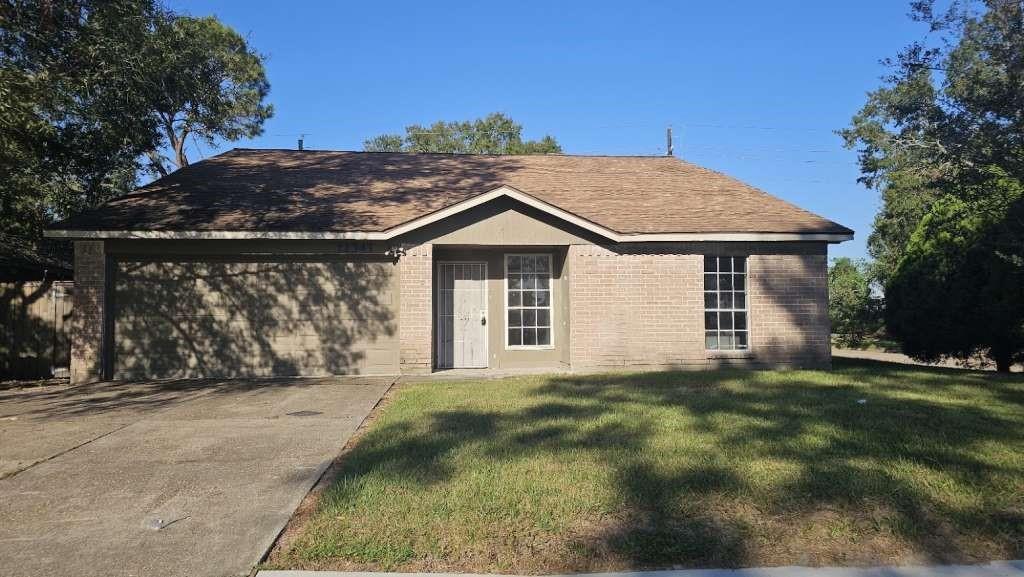
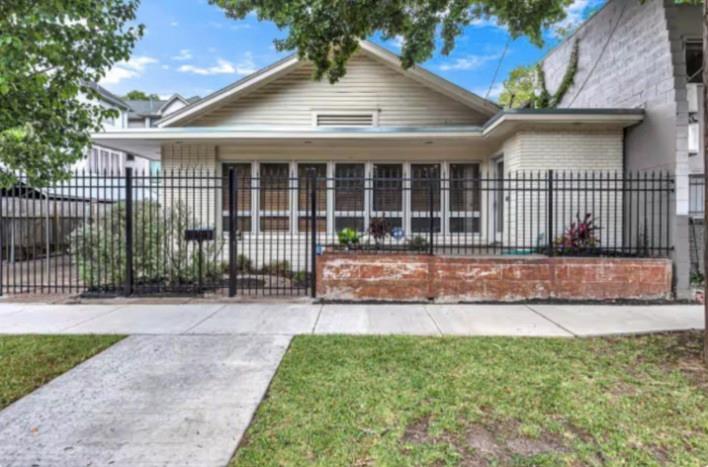
Active
$95,000
2
bds
|
0
ba
|
1,164
sqft
|
built
1982
10211 Sugar Branch Dr, Houston, TX 77036
$-158
Cash flow
-8.7%
Cash-on-Cash Return
3.7%
Cap rate
1.4%
Rent to Value Ratio
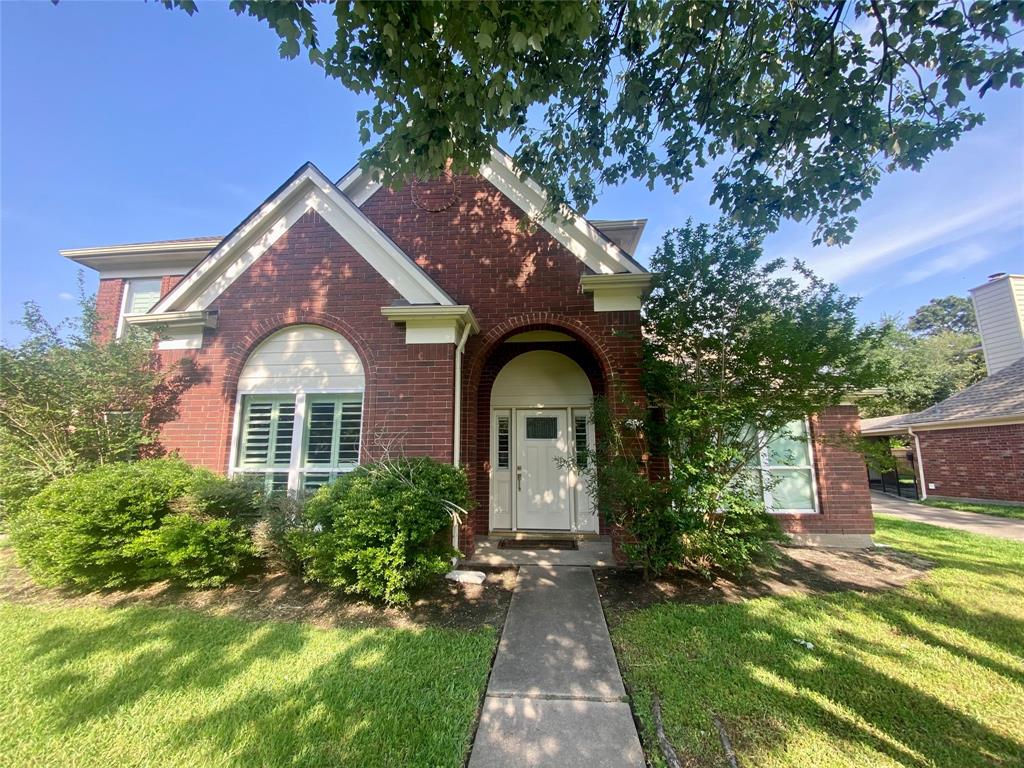
Active
$359,999
4
bds
|
0
ba
|
2,598
sqft
|
built
1992
7938 Feather Springs Dr, Houston, TX 77095
$-557
Cash flow
-8.1%
Cash-on-Cash Return
3.8%
Cap rate
0.8%
Rent to Value Ratio

Active
$80,000
1
bds
|
0
ba
|
693
sqft
|
built
1979
6001 Reims Rd, Houston, TX 77036
$-72
Cash flow
-4.7%
Cash-on-Cash Return
4.6%
Cap rate
1.3%
Rent to Value Ratio
Active
$525,000
2
bds
|
0
ba
|
1,961
sqft
|
built
2005
5005 Hidalgo St, Houston, TX 77056
$-1,974
Cash flow
-19.6%
Cash-on-Cash Return
1.2%
Cap rate
0.7%
Rent to Value Ratio
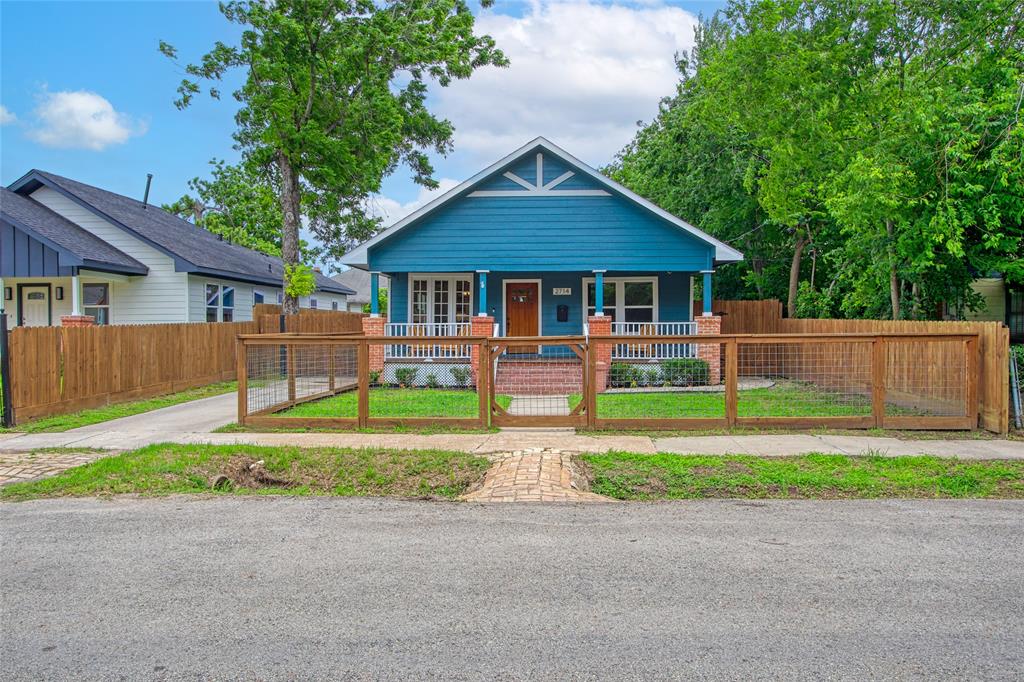
Active
$420,000
3
bds
|
0
ba
|
1,528
sqft
|
built
1930
2714 Gano St, Houston, TX 77009
$-1,025
Cash flow
-12.7%
Cash-on-Cash Return
2.8%
Cap rate
0.6%
Rent to Value Ratio
Active under contract
$799,999
4
bds
|
0
ba
|
3,718
sqft
|
built
2016
8606 San Juanico St, Houston, TX 77044
$-2,111
Cash flow
-13.8%
Cash-on-Cash Return
2.5%
Cap rate
0.7%
Rent to Value Ratio
Active
$310,000
5
bds
|
0
ba
|
2,416
sqft
|
built
2020
10027 Yanet Grove Ln, Houston, TX 77044
$120
Cash flow
2.0%
Cash-on-Cash Return
6.1%
Cap rate
0.7%
Rent to Value Ratio
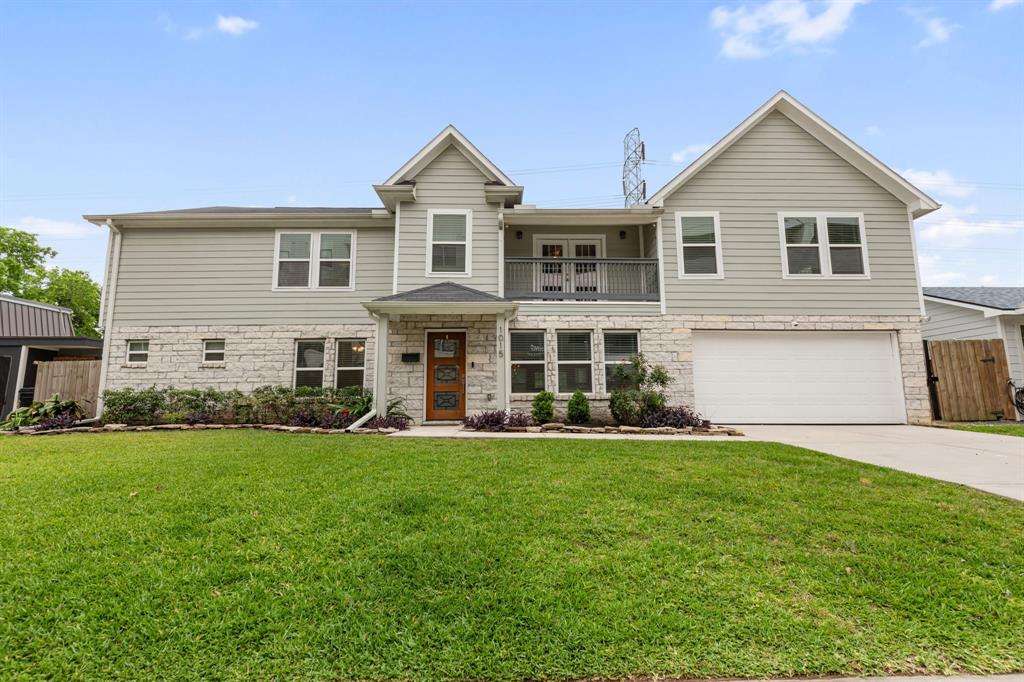
Active
$849,999
5
bds
|
0
ba
|
3,801
sqft
|
built
1960
1015 Gardendale Dr, Houston, TX 77018
$-2,042
Cash flow
-12.5%
Cash-on-Cash Return
2.8%
Cap rate
0.6%
Rent to Value Ratio
Active
$135,000
2
bds
|
0
ba
|
964
sqft
|
built
1980
2120 El Paseo St, Houston, TX 77054
$-437
Cash flow
-16.9%
Cash-on-Cash Return
1.8%
Cap rate
1.0%
Rent to Value Ratio
Active
$375,000
3
bds
|
0
ba
|
1,606
sqft
|
built
2021
804 Woodcrest Dr, Houston, TX 77018
$32
Cash flow
0.4%
Cash-on-Cash Return
5.8%
Cap rate
0.7%
Rent to Value Ratio
Active under contract
$369,990
4
bds
|
0
ba
|
2,776
sqft
|
built
1964
8027 Glenforest Ct, Houston, TX 77061
$-672
Cash flow
-9.5%
Cash-on-Cash Return
3.5%
Cap rate
0.6%
Rent to Value Ratio
Active
$137,500
1
bds
|
0
ba
|
680
sqft
|
built
1980
8801 Hammerly Blvd, Houston, TX 77080
$-219
Cash flow
-8.3%
Cash-on-Cash Return
3.8%
Cap rate
0.9%
Rent to Value Ratio
Active
$299,000
2
bds
|
0
ba
|
1,875
sqft
|
built
1977
2323 Augusta Dr, Houston, TX 77057
$-764
Cash flow
-13.3%
Cash-on-Cash Return
2.6%
Cap rate
0.8%
Rent to Value Ratio
Active
$200,000
2
bds
|
0
ba
|
1,306
sqft
|
built
1972
7575 Katy Fwy, Houston, TX 77024
$-744
Cash flow
-19.4%
Cash-on-Cash Return
1.2%
Cap rate
1.0%
Rent to Value Ratio
Active
$285,000
2
bds
|
0
ba
|
1,230
sqft
|
built
1992
2111 Welch St, Houston, TX 77019
$-1,081
Cash flow
-19.8%
Cash-on-Cash Return
1.1%
Cap rate
0.7%
Rent to Value Ratio
Active
$121,000
1
bds
|
0
ba
|
480
sqft
|
built
1983
1311 Antoine Dr, Houston, TX 77055
$-251
Cash flow
-10.8%
Cash-on-Cash Return
3.2%
Cap rate
0.9%
Rent to Value Ratio
Active
$269,900
3
bds
|
0
ba
|
1,890
sqft
|
built
1986
7770 Pine Center Dr, Houston, TX 77095
$-260
Cash flow
-5.0%
Cash-on-Cash Return
4.5%
Cap rate
0.8%
Rent to Value Ratio
Active
$1,135,000
3
bds
|
0
ba
|
3,783
sqft
|
built
2015
5505 Jackson St, Houston, TX 77004
$-2,137
Cash flow
-9.8%
Cash-on-Cash Return
3.4%
Cap rate
0.6%
Rent to Value Ratio
Active
$265,000
2
bds
|
0
ba
|
1,546
sqft
|
built
1981
5150 Hidalgo St, Houston, TX 77056
$-1,408
Cash flow
-27.7%
Cash-on-Cash Return
-0.7%
Cap rate
0.9%
Rent to Value Ratio
Active
$400,000
3
bds
|
0
ba
|
0
sqft
|
built
1948
8033 Furray Rd, Houston, TX 77028
$-893
Cash flow
-11.6%
Cash-on-Cash Return
3.0%
Cap rate
0.4%
Rent to Value Ratio

Active
$719,000
3
bds
|
0
ba
|
2,545
sqft
|
built
1954
9762 Tappenbeck Dr, Houston, TX 77055
$-2,889
Cash flow
-21.0%
Cash-on-Cash Return
0.9%
Cap rate
0.4%
Rent to Value Ratio
Active
$165,000
3
bds
|
0
ba
|
1,466
sqft
|
built
1952
12466 Birdie Ln, Houston, TX 77015
$323
Cash flow
10.2%
Cash-on-Cash Return
8.0%
Cap rate
1.0%
Rent to Value Ratio
Active
$299,786
4
bds
|
0
ba
|
2,541
sqft
|
built
2017
11646 Downey Violet Ln, Houston, TX 77044
$-621
Cash flow
-10.8%
Cash-on-Cash Return
3.2%
Cap rate
0.8%
Rent to Value Ratio
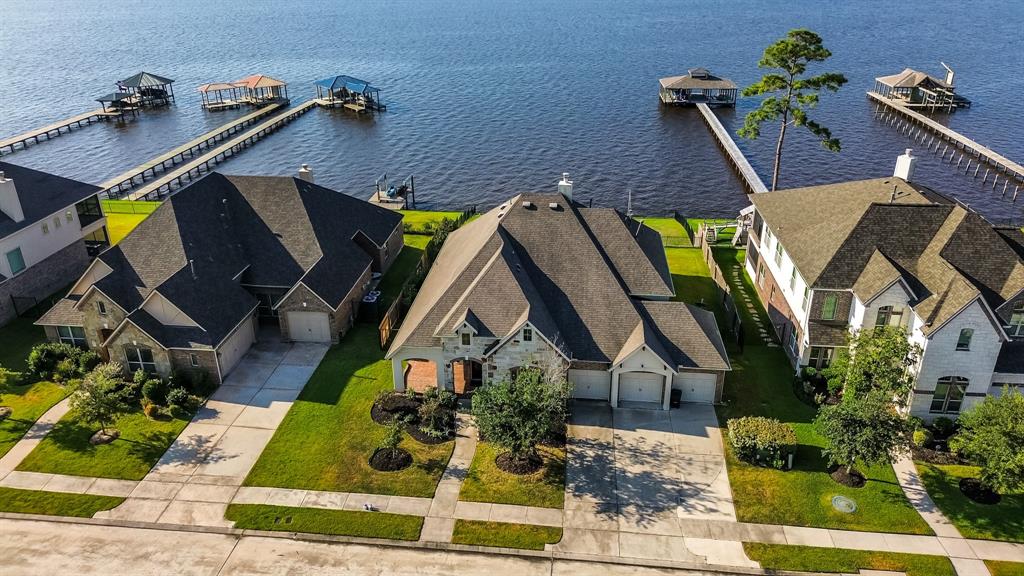
Active
$775,000
3
bds
|
0
ba
|
2,604
sqft
|
built
2005
614 W Bell St, Houston, TX 77019
$-890
Cash flow
-6.0%
Cash-on-Cash Return
4.3%
Cap rate
0.7%
Rent to Value Ratio
Active
$595,000
3
bds
|
0
ba
|
1,869
sqft
|
built
1955
5216 Sue Marie Ln, Houston, TX 77091
$-1,434
Cash flow
-12.6%
Cash-on-Cash Return
2.8%
Cap rate
0.5%
Rent to Value Ratio
Active under contract
$295,000
4
bds
|
0
ba
|
2,232
sqft
|
built
1979
4719 Theall Rd, Houston, TX 77066
$-401
Cash flow
-7.1%
Cash-on-Cash Return
4.0%
Cap rate
0.7%
Rent to Value Ratio
Active
$64,900
1
bds
|
0
ba
|
693
sqft
|
built
1980
6001 Reims Rd, Houston, TX 77036
$316
Cash flow
5.7%
Cash-on-Cash Return
5.8%
Cap rate
1.5%
Rent to Value Ratio
Active
$136,000
1
bds
|
0
ba
|
774
sqft
|
built
1983
2255 Braeswood Park Dr, Houston, TX 77030
$-130
Cash flow
-5.0%
Cash-on-Cash Return
4.5%
Cap rate
1.0%
Rent to Value Ratio
Active
$234,000
3
bds
|
0
ba
|
1,852
sqft
|
built
1981
12846 Ashford Meadow Dr, Houston, TX 77082
$-281
Cash flow
-6.3%
Cash-on-Cash Return
4.2%
Cap rate
0.8%
Rent to Value Ratio
Active
$249,199
6
bds
|
0
ba
|
3,351
sqft
|
built
1979
12343 Haroldson Forest Dr, Houston, TX 77044
$9
Cash flow
0.2%
Cash-on-Cash Return
5.7%
Cap rate
1.1%
Rent to Value Ratio
Active
$320,000
6
bds
|
0
ba
|
2,078
sqft
|
built
1955
3615 Seabrook St, Houston, TX 77021
$211
Cash flow
3.4%
Cash-on-Cash Return
6.5%
Cap rate
0.8%
Rent to Value Ratio
Active
$194,999
4
bds
|
0
ba
|
1,294
sqft
|
built
1940
428 De Haven St, Houston, TX 77029
$238
Cash flow
6.4%
Cash-on-Cash Return
7.1%
Cap rate
0.9%
Rent to Value Ratio
Active
$389,500
4
bds
|
0
ba
|
2,478
sqft
|
built
2004
2612 Starboard Point Dr, Houston, TX 77054
$-1,028
Cash flow
-13.8%
Cash-on-Cash Return
2.5%
Cap rate
0.6%
Rent to Value Ratio
Active
$625,000
3
bds
|
0
ba
|
1,783
sqft
|
built
1927
4204 Stanford St, Houston, TX 77006
$-2,169
Cash flow
-18.1%
Cash-on-Cash Return
1.5%
Cap rate
0.4%
Rent to Value Ratio
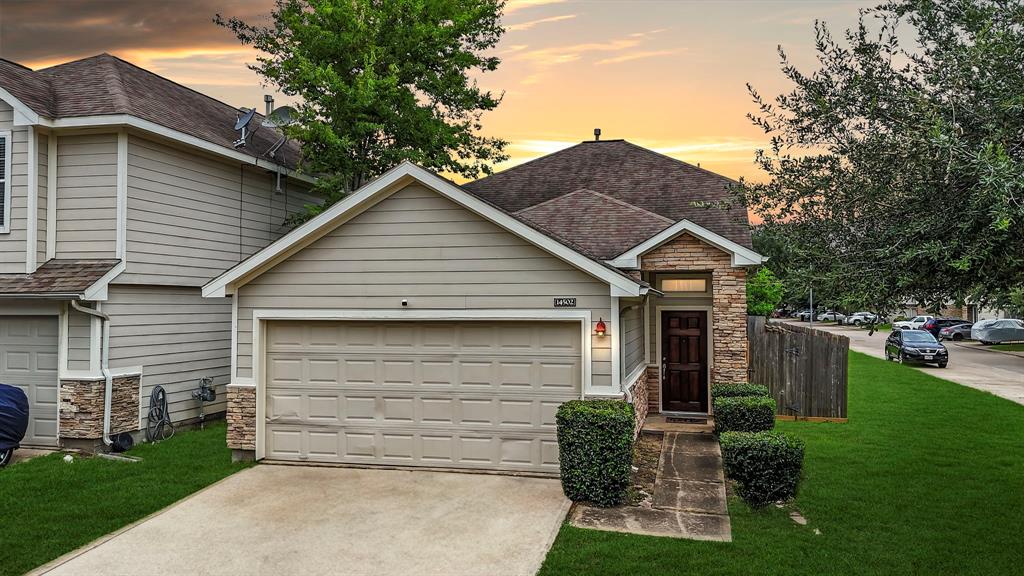
Active
$290,000
3
bds
|
0
ba
|
1,702
sqft
|
built
2005
14502 Windmill Meadows Ct, Houston, TX 77082
$-511
Cash flow
-9.2%
Cash-on-Cash Return
3.6%
Cap rate
0.7%
Rent to Value Ratio
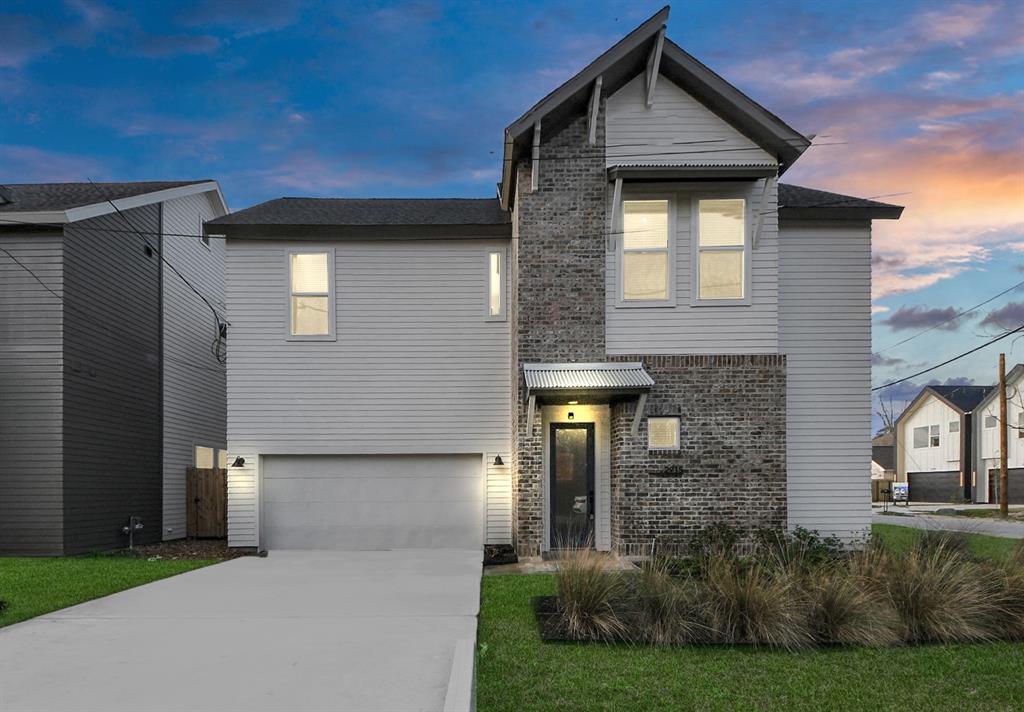
Active
$350,000
3
bds
|
0
ba
|
1,694
sqft
|
built
2023
2915 Paul Quinn St, Houston, TX 77091
$-488
Cash flow
-7.3%
Cash-on-Cash Return
4.0%
Cap rate
0.7%
Rent to Value Ratio

Active
$310,000
3
bds
|
0
ba
|
1,667
sqft
|
built
1970
10602 Raydell Dr, Houston, TX 77031
$-537
Cash flow
-9.0%
Cash-on-Cash Return
3.6%
Cap rate
0.6%
Rent to Value Ratio
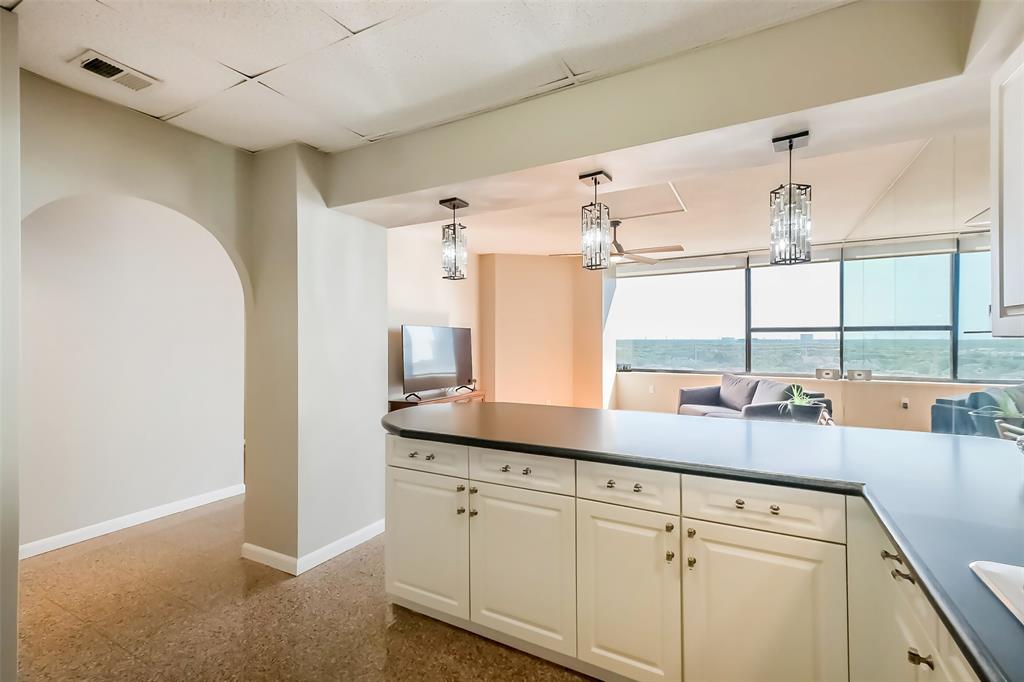
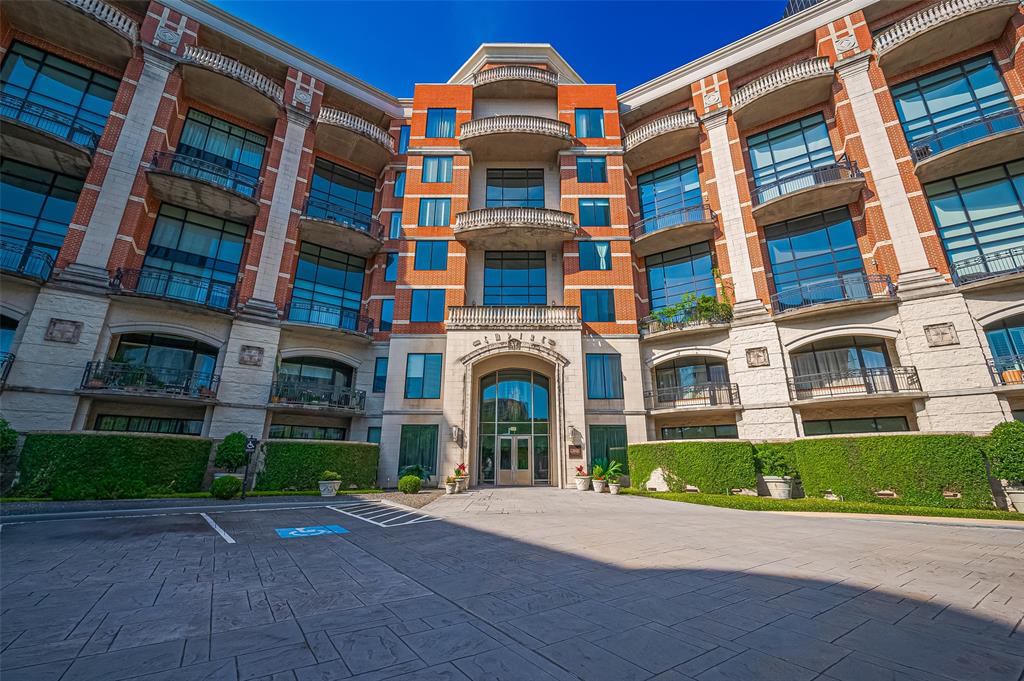
Active under contract
$259,000
2
bds
|
0
ba
|
1,080
sqft
|
built
1980
15 Greenway Plz, Houston, TX 77046
$-1,312
Cash flow
-26.4%
Cash-on-Cash Return
-0.4%
Cap rate
0.8%
Rent to Value Ratio
Active
$960,000
3
bds
|
0
ba
|
3,732
sqft
|
built
2015
8013 Dunlap St, Houston, TX 77074
$-3,862
Cash flow
-21.0%
Cash-on-Cash Return
0.9%
Cap rate
0.3%
Rent to Value Ratio