Houston, TX Investment Properties for Sale
Browse homes for sale and investment properties in Houston, TX. Refine your search by price, property type, or more.
Best cash flowing properties in Houston, TX
Active
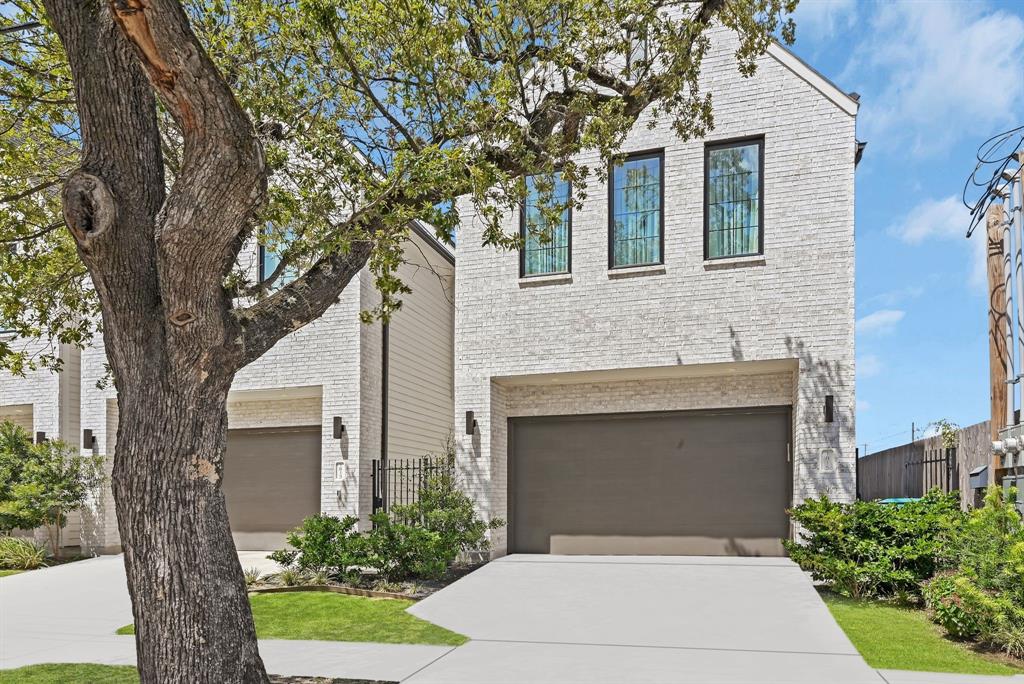
$575,000
4
bds
|
0
ba
|
2,429
sqft
|
built
2020
1815 Arbor St, Houston, TX 77004
$315
Cash flow
2.9%
Cash-on-Cash Return
6.3%
Cap rate
0.8%
Rent to Value Ratio

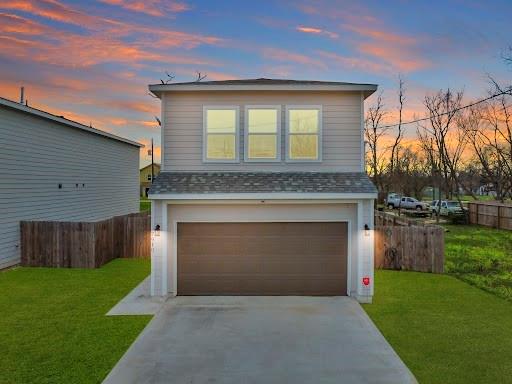
Active
$422,299
3
bds
|
0
ba
|
2,020
sqft
|
built
2021
2711 Clinton Dr, Houston, TX 77020
$41
Cash flow
0.5%
Cash-on-Cash Return
5.8%
Cap rate
0.7%
Rent to Value Ratio
8,547 out of 8,994 properties for sale in Houston, TX
Limited Results Shown
Create a free account, or log in to reveal all property listings and enjoy the complete experience.
Active
$299,000
3
bds
|
0
ba
|
1,892
sqft
|
built
2021
7950 Blue St, Houston, TX 77028
$-346
Cash flow
-6.0%
Cash-on-Cash Return
4.3%
Cap rate
0.7%
Rent to Value Ratio
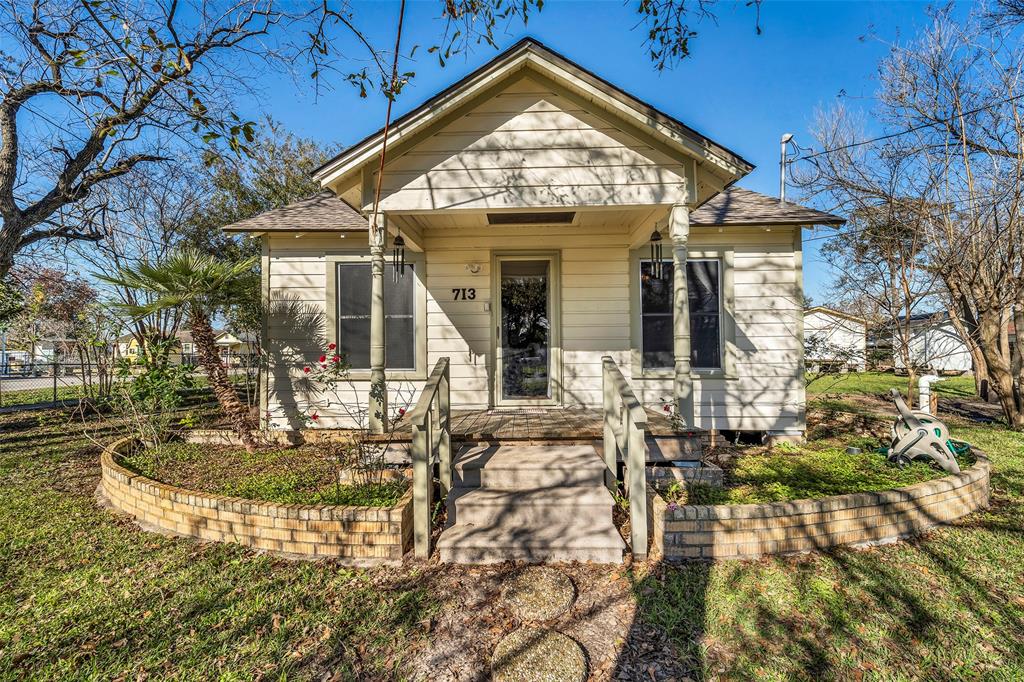
Active
$295,000
4
bds
|
0
ba
|
1,584
sqft
|
built
1950
713 Firnat St, Houston, TX 77022
$-221
Cash flow
-3.9%
Cash-on-Cash Return
4.8%
Cap rate
0.7%
Rent to Value Ratio
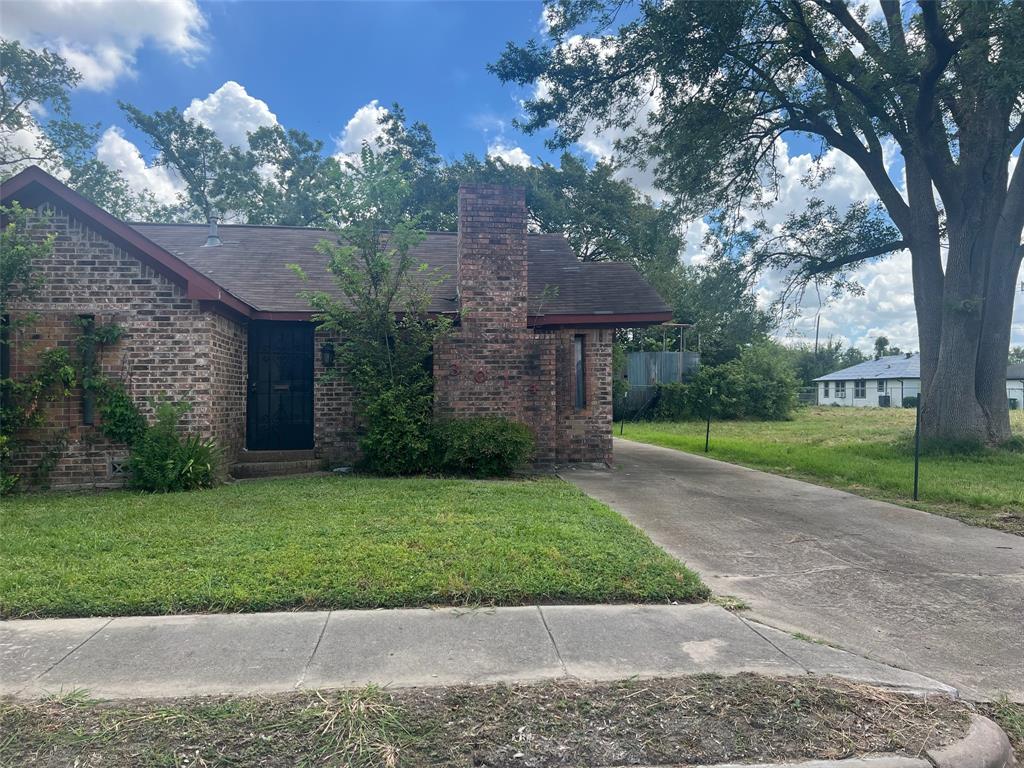
Active
$235,000
2
bds
|
0
ba
|
1,193
sqft
|
built
1945
3014 Elysian St, Houston, TX 77009
$-405
Cash flow
-9.0%
Cash-on-Cash Return
3.6%
Cap rate
0.6%
Rent to Value Ratio
Active
$255,000
3
bds
|
0
ba
|
1,929
sqft
|
built
1986
9206 Beringwood Dr, Houston, TX 77083
$-409
Cash flow
-8.4%
Cash-on-Cash Return
3.8%
Cap rate
0.7%
Rent to Value Ratio
Active
$249,900
2
bds
|
0
ba
|
1,518
sqft
|
built
2009
14744 Branchwest Dr, Houston, TX 77082
$-368
Cash flow
-7.7%
Cash-on-Cash Return
3.9%
Cap rate
0.7%
Rent to Value Ratio
Active
$199,000
2
bds
|
0
ba
|
782
sqft
|
built
1930
2406 Delano St, Houston, TX 77004
$-451
Cash flow
-11.8%
Cash-on-Cash Return
3.0%
Cap rate
0.5%
Rent to Value Ratio
Active
$109,000
1
bds
|
0
ba
|
1,076
sqft
|
built
1960
2701 Bellefontaine St, Houston, TX 77025
$-503
Cash flow
-24.1%
Cash-on-Cash Return
0.1%
Cap rate
1.3%
Rent to Value Ratio
Active
$220,000
4
bds
|
0
ba
|
1,664
sqft
|
built
1945
301 Connecticut St, Houston, TX 77029
$-483
Cash flow
-11.5%
Cash-on-Cash Return
3.0%
Cap rate
0.5%
Rent to Value Ratio
Active
$295,000
4
bds
|
0
ba
|
2,226
sqft
|
built
2014
13830 Bonner Bluff Ln, Houston, TX 77047
$-409
Cash flow
-7.2%
Cash-on-Cash Return
4.0%
Cap rate
0.8%
Rent to Value Ratio
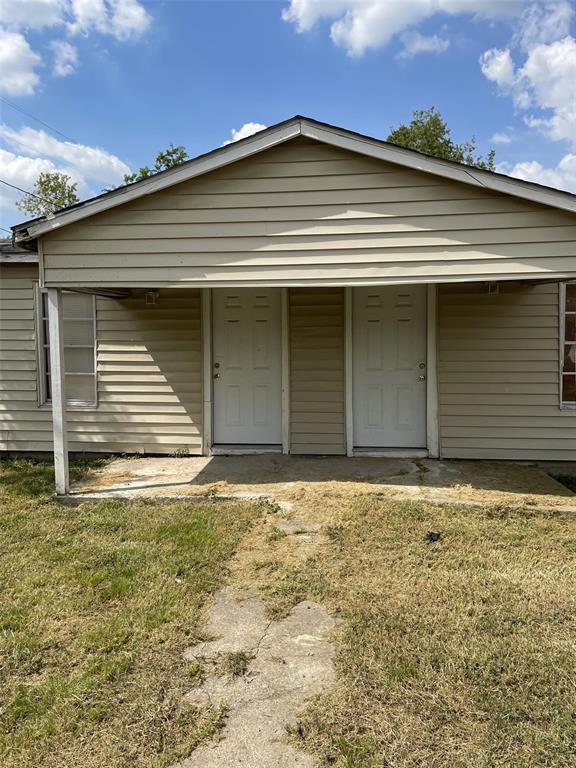
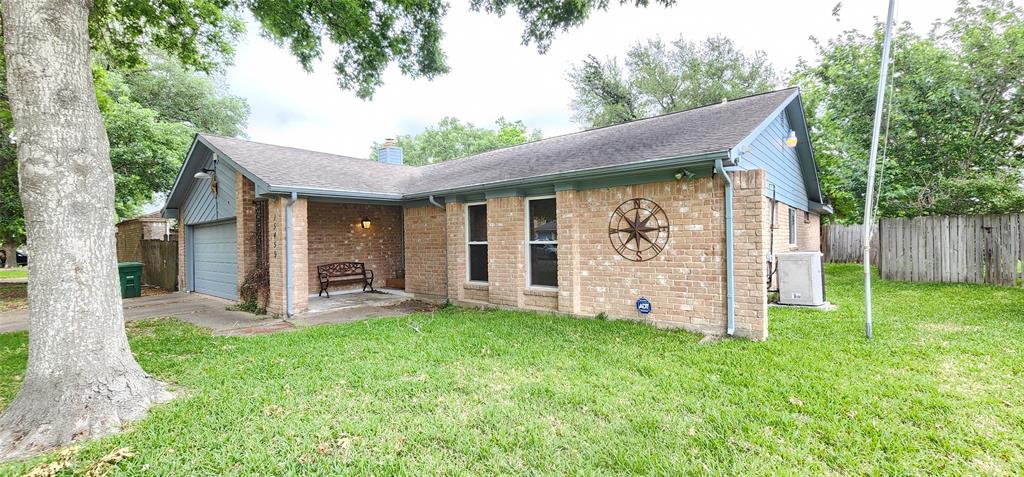
Active
$214,900
4
bds
|
0
ba
|
1,650
sqft
|
built
1950
10134 Palestine St, Houston, TX 77029
$-73
Cash flow
-1.8%
Cash-on-Cash Return
5.3%
Cap rate
0.9%
Rent to Value Ratio
Active
$88,000
2
bds
|
0
ba
|
1,068
sqft
|
built
1983
9797 Leawood Blvd, Houston, TX 77099
$-48
Cash flow
-2.8%
Cash-on-Cash Return
5.0%
Cap rate
1.5%
Rent to Value Ratio
Active under contract
$235,000
3
bds
|
0
ba
|
1,968
sqft
|
built
1975
6804 Schuller Rd, Houston, TX 77093
$-116
Cash flow
-2.6%
Cash-on-Cash Return
5.1%
Cap rate
0.9%
Rent to Value Ratio
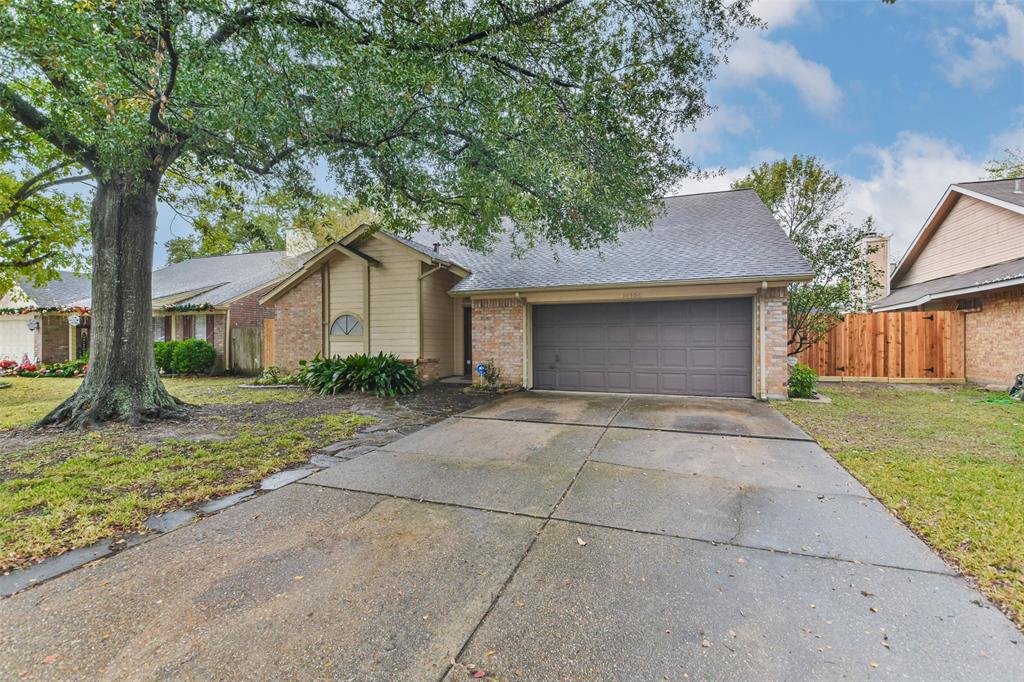
Active
$244,900
4
bds
|
0
ba
|
1,722
sqft
|
built
1950
4902 Michael Dr, Houston, TX 77017
$3
Cash flow
0.1%
Cash-on-Cash Return
5.7%
Cap rate
0.8%
Rent to Value Ratio
Active
$195,000
2
bds
|
0
ba
|
1,114
sqft
|
built
1955
8015 Cannon St, Houston, TX 77051
$-56
Cash flow
-1.5%
Cash-on-Cash Return
5.3%
Cap rate
0.9%
Rent to Value Ratio
Active
$575,000
4
bds
|
0
ba
|
2,429
sqft
|
built
2020
1815 Arbor St, Houston, TX 77004
$315
Cash flow
2.9%
Cash-on-Cash Return
6.3%
Cap rate
0.8%
Rent to Value Ratio
Active
$180,000
2
bds
|
0
ba
|
1,104
sqft
|
built
1978
1845 Witte Rd, Houston, TX 77080
$-89
Cash flow
-2.6%
Cash-on-Cash Return
5.1%
Cap rate
1.0%
Rent to Value Ratio
Active
$239,900
2
bds
|
0
ba
|
1,680
sqft
|
built
2004
2311 Warwick Rd, Houston, TX 77093
$-66
Cash flow
-1.4%
Cash-on-Cash Return
5.3%
Cap rate
0.8%
Rent to Value Ratio
Active
$88,888
1
bds
|
0
ba
|
768
sqft
|
built
1980
10501 South Dr, Houston, TX 77099
$-143
Cash flow
-8.4%
Cash-on-Cash Return
3.8%
Cap rate
1.1%
Rent to Value Ratio
Active
$205,000
4
bds
|
0
ba
|
1,588
sqft
|
built
1980
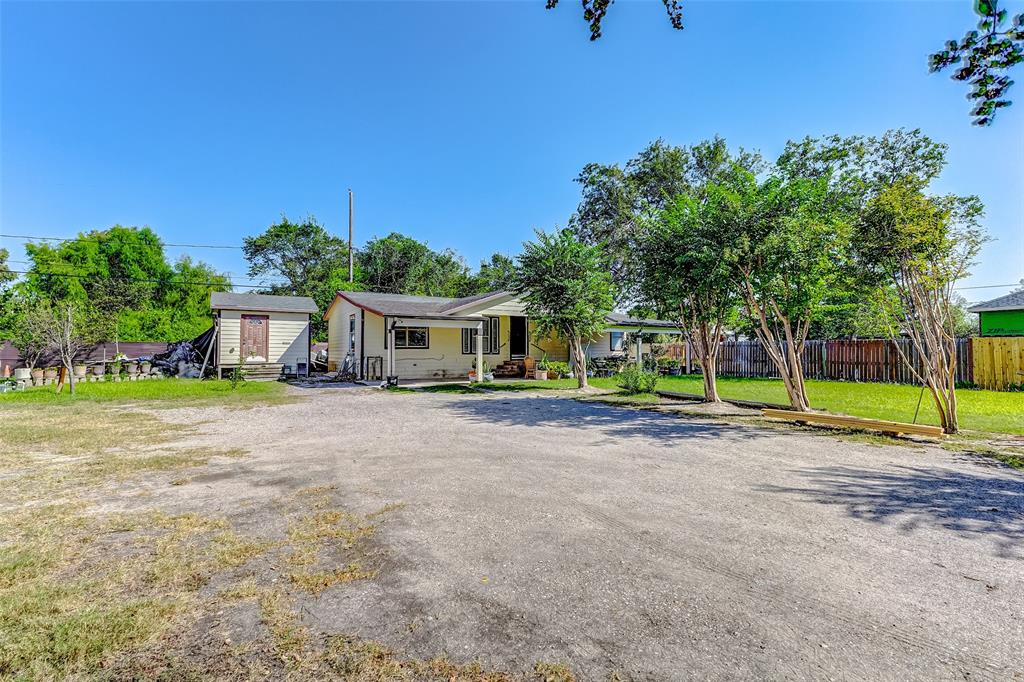
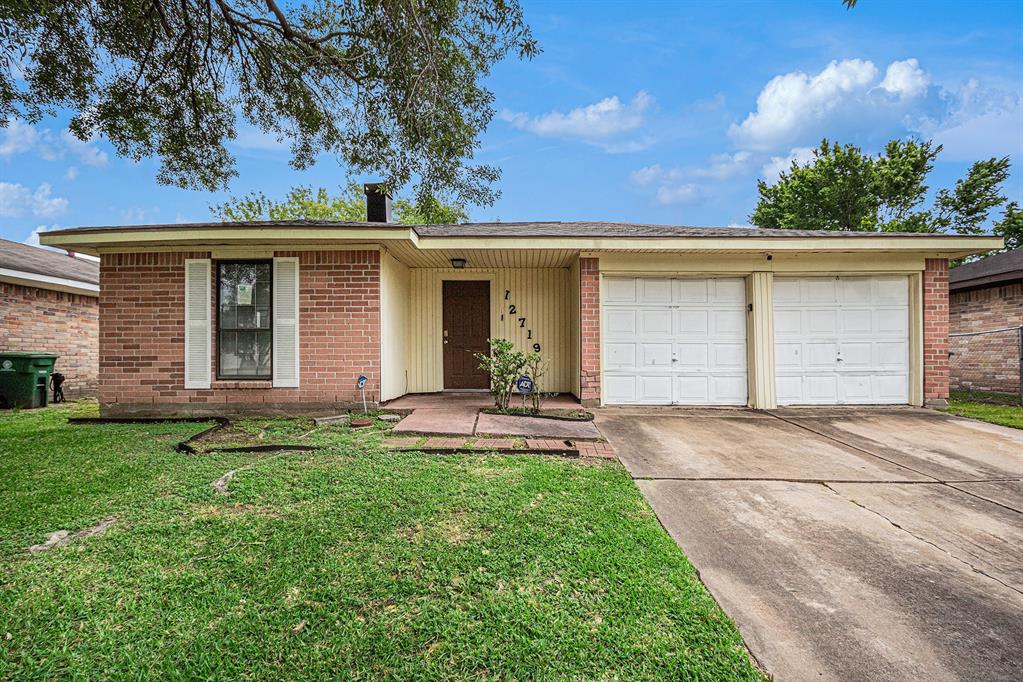
12719 Panay Dr, Houston, TX 77048
$22
Cash flow
0.6%
Cash-on-Cash Return
5.8%
Cap rate
0.9%
Rent to Value Ratio
Active
$422,299
3
bds
|
0
ba
|
2,020
sqft
|
built
2021
2711 Clinton Dr, Houston, TX 77020
$41
Cash flow
0.5%
Cash-on-Cash Return
5.8%
Cap rate
0.7%
Rent to Value Ratio
Active
$188,000
4
bds
|
0
ba
|
1,116
sqft
|
built
1960
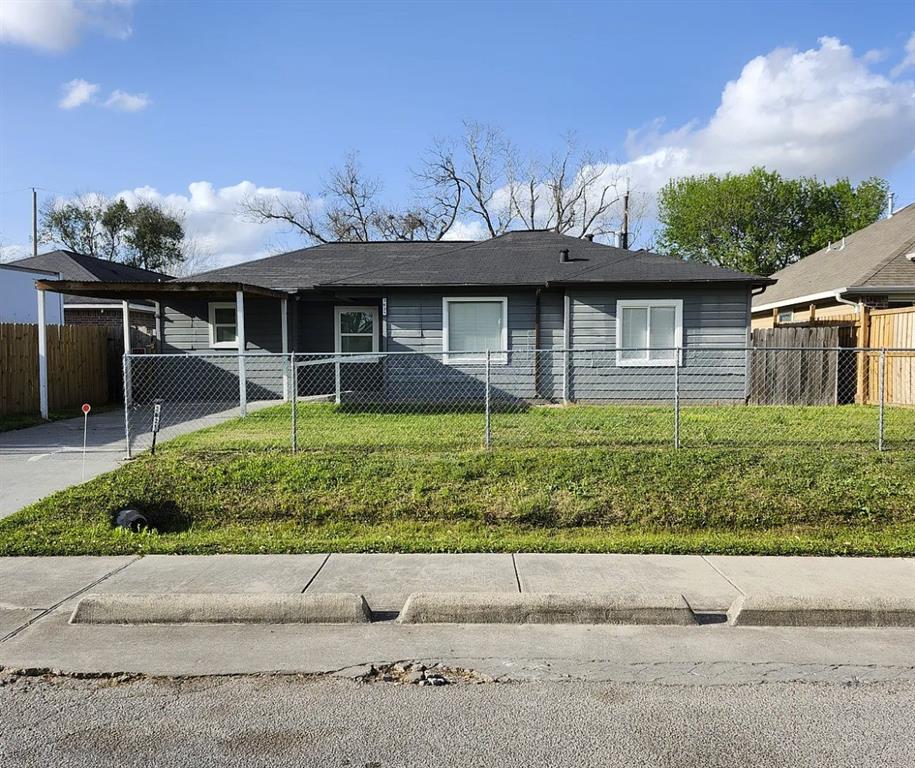
3621 Dawson Ln, Houston, TX 77051
$-153
Cash flow
-4.2%
Cash-on-Cash Return
4.7%
Cap rate
0.7%
Rent to Value Ratio
Active
$110,000
1
bds
|
0
ba
|
1,008
sqft
|
built
1978
6401 Deihl Rd, Houston, TX 77092
$-211
Cash flow
-10.0%
Cash-on-Cash Return
3.4%
Cap rate
1.1%
Rent to Value Ratio
Active
$299,500
3
bds
|
0
ba
|
2,355
sqft
|
built
1982
13046 Ferry Hill Ln, Houston, TX 77015
$-83
Cash flow
-1.4%
Cash-on-Cash Return
5.3%
Cap rate
0.8%
Rent to Value Ratio
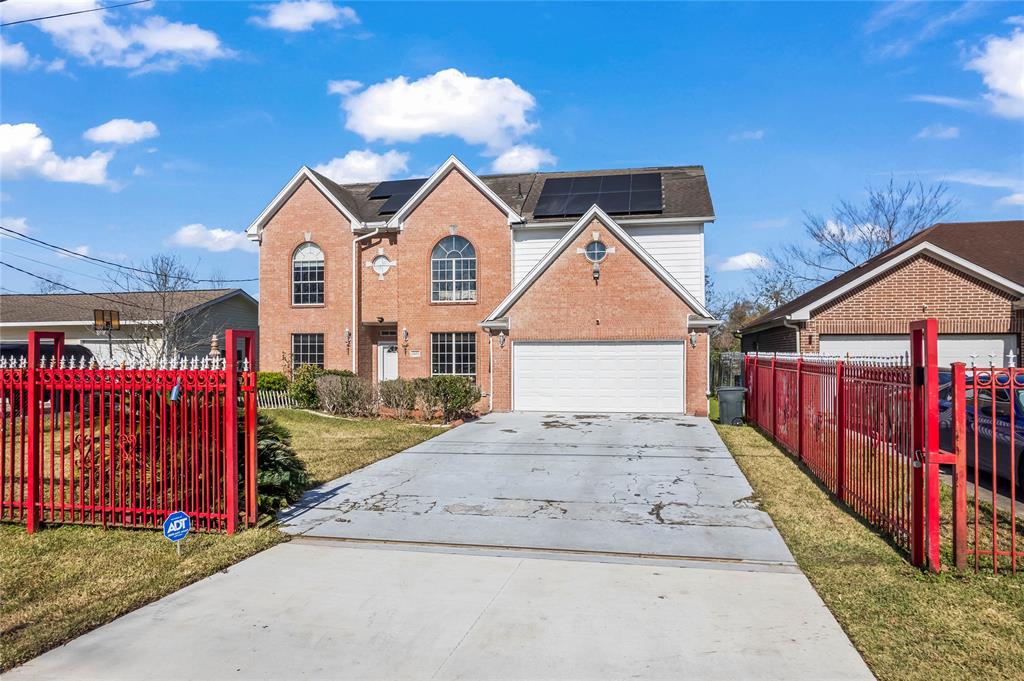
Active under contract
$340,000
5
bds
|
0
ba
|
3,070
sqft
|
built
1970
1723 Wagon Gap Trl, Houston, TX 77090
$-125
Cash flow
-1.9%
Cash-on-Cash Return
5.2%
Cap rate
0.9%
Rent to Value Ratio
Active
$475,000
3
bds
|
0
ba
|
2,728
sqft
|
built
2015
2660 Fountain Key Blvd, Houston, TX 77008
$11
Cash flow
0.1%
Cash-on-Cash Return
5.7%
Cap rate
0.8%
Rent to Value Ratio
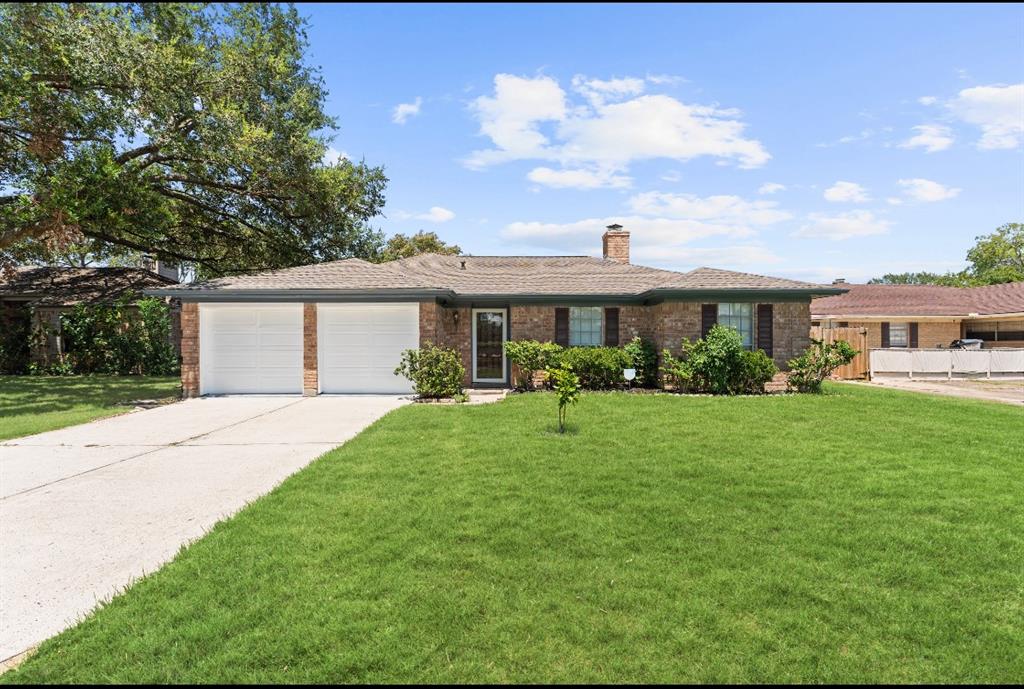
Active
$285,000
4
bds
|
0
ba
|
2,338
sqft
|
built
1978
15459 Runswick Dr, Houston, TX 77062
$-237
Cash flow
-4.3%
Cash-on-Cash Return
4.7%
Cap rate
0.9%
Rent to Value Ratio
Active
$385,000
3
bds
|
0
ba
|
2,124
sqft
|
built
2007
3249 Maxroy St, Houston, TX 77008
$-73
Cash flow
-1.0%
Cash-on-Cash Return
5.5%
Cap rate
0.7%
Rent to Value Ratio
Active
$144,999
2
bds
|
0
ba
|
1,056
sqft
|
built
1957
2222 Hogg St, Houston, TX 77026
$-256
Cash flow
-9.2%
Cash-on-Cash Return
3.6%
Cap rate
0.8%
Rent to Value Ratio
Active
$230,000
3
bds
|
0
ba
|
1,256
sqft
|
built
1940
10418 S Oswego St, Houston, TX 77029
$-178
Cash flow
-4.0%
Cash-on-Cash Return
4.7%
Cap rate
0.7%
Rent to Value Ratio
Active
$269,900
3
bds
|
0
ba
|
2,184
sqft
|
built
1983
10306 Wayward Wind Ln, Houston, TX 77064
$-221
Cash flow
-4.3%
Cash-on-Cash Return
4.7%
Cap rate
0.8%
Rent to Value Ratio
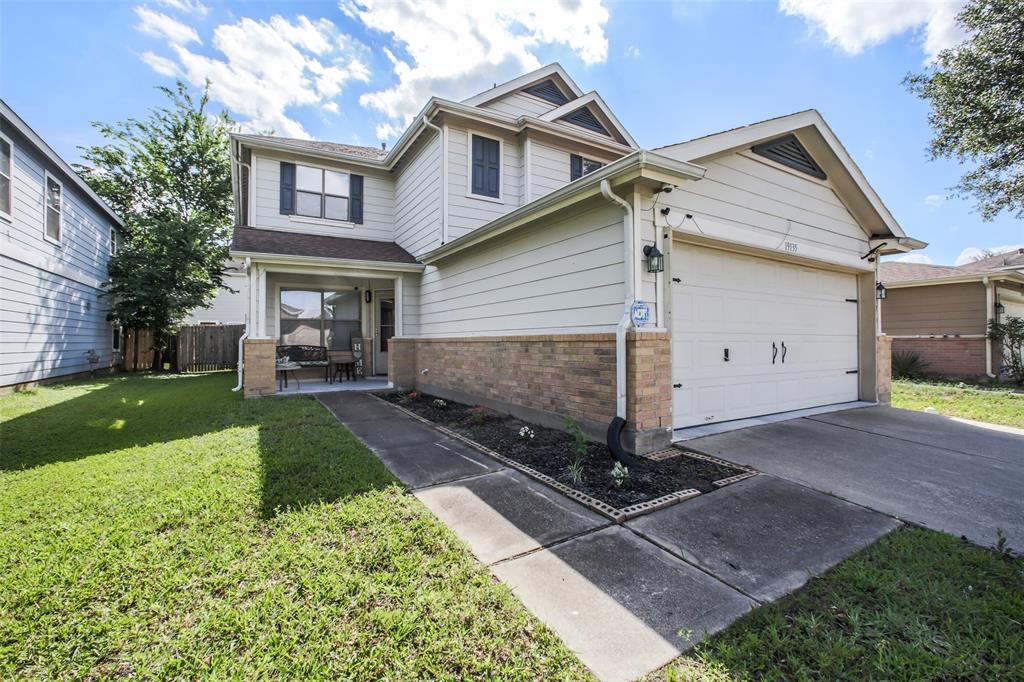
Active
$240,000
3
bds
|
0
ba
|
2,252
sqft
|
built
2006
19135 Remington Bend Dr, Houston, TX 77073
$-270
Cash flow
-5.9%
Cash-on-Cash Return
4.3%
Cap rate
0.8%
Rent to Value Ratio
Active
$266,750
4
bds
|
0
ba
|
2,493
sqft
|
built
2001
13105 Verdun Dr, Houston, TX 77049
$-267
Cash flow
-5.2%
Cash-on-Cash Return
4.5%
Cap rate
0.9%
Rent to Value Ratio
Active
$310,500
4
bds
|
0
ba
|
1,910
sqft
|
built
1978
815 Pebbleshire Dr, Houston, TX 77062
$-295
Cash flow
-5.0%
Cash-on-Cash Return
4.5%
Cap rate
0.8%
Rent to Value Ratio
Active under contract
$319,900
4
bds
|
0
ba
|
3,278
sqft
|
built
1970
5902 Old Lodge Dr, Houston, TX 77066
$-299
Cash flow
-4.9%
Cash-on-Cash Return
4.6%
Cap rate
0.8%
Rent to Value Ratio
Active
$289,000
3
bds
|
0
ba
|
1,786
sqft
|
built
1979
5427 Cairnleigh Dr, Houston, TX 77084
$-319
Cash flow
-5.8%
Cash-on-Cash Return
4.4%
Cap rate
0.8%
Rent to Value Ratio
Active
$123,000
2
bds
|
0
ba
|
1,068
sqft
|
built
1983
9797 Leawood Blvd, Houston, TX 77099
$-436
Cash flow
-18.5%
Cash-on-Cash Return
1.4%
Cap rate
0.8%
Rent to Value Ratio
Active
$225,000
2
bds
|
0
ba
|
1,152
sqft
|
built
1981
9810 Fernstone Ln, Houston, TX 77070
$-389
Cash flow
-9.0%
Cash-on-Cash Return
3.6%
Cap rate
0.7%
Rent to Value Ratio
Active
$335,000
4
bds
|
0
ba
|
2,174
sqft
|
built
1979
10411 Rippling Fields Dr, Houston, TX 77064
$-355
Cash flow
-5.5%
Cash-on-Cash Return
4.4%
Cap rate
0.7%
Rent to Value Ratio
Active
$350,000
4
bds
|
0
ba
|
2,374
sqft
|
built
1985
7914 Rio Crystal Dr, Houston, TX 77095
$-469
Cash flow
-7.0%
Cash-on-Cash Return
4.1%
Cap rate
0.7%
Rent to Value Ratio
Active
$329,888
5
bds
|
0
ba
|
2,822
sqft
|
built
1970
14406 Wadebridge Way, Houston, TX 77015
$-381
Cash flow
-6.0%
Cash-on-Cash Return
4.3%
Cap rate
0.8%
Rent to Value Ratio