Houston, TX Investment Properties for Sale
Browse homes for sale and investment properties in Houston, TX. Refine your search by price, property type, or more.
Best cash flowing properties in Houston, TX
Active
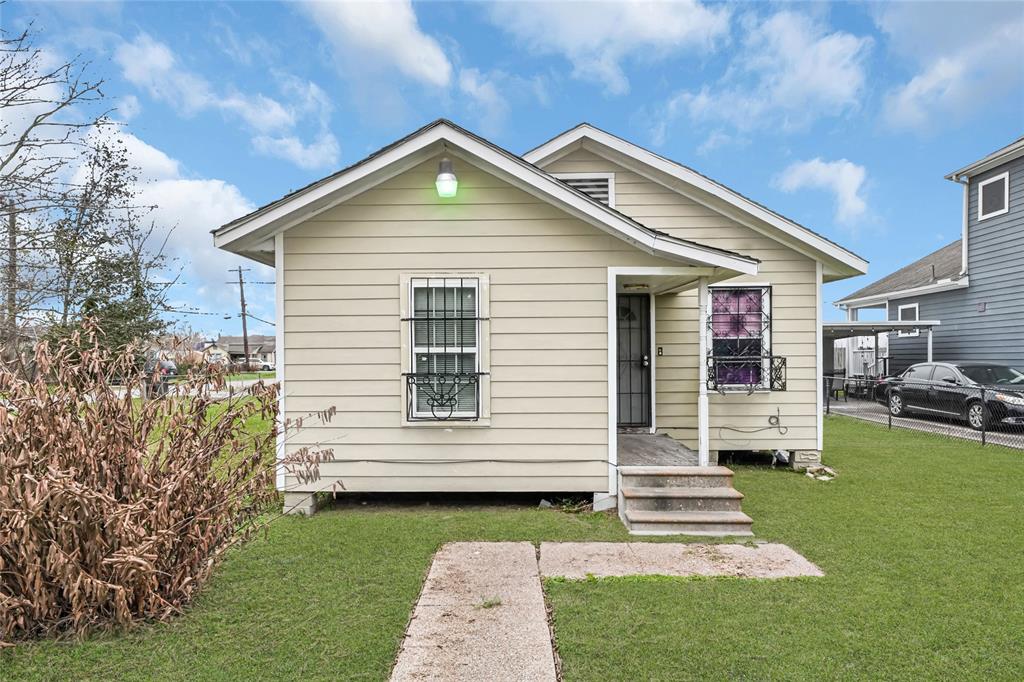
$250,000
3
bds
|
0
ba
|
840
sqft
|
built
1935
2607 Milwaukee St, Houston, TX 77026
$-297
Cash flow
-6.2%
Cash-on-Cash Return
4.3%
Cap rate
0.6%
Rent to Value Ratio
Active
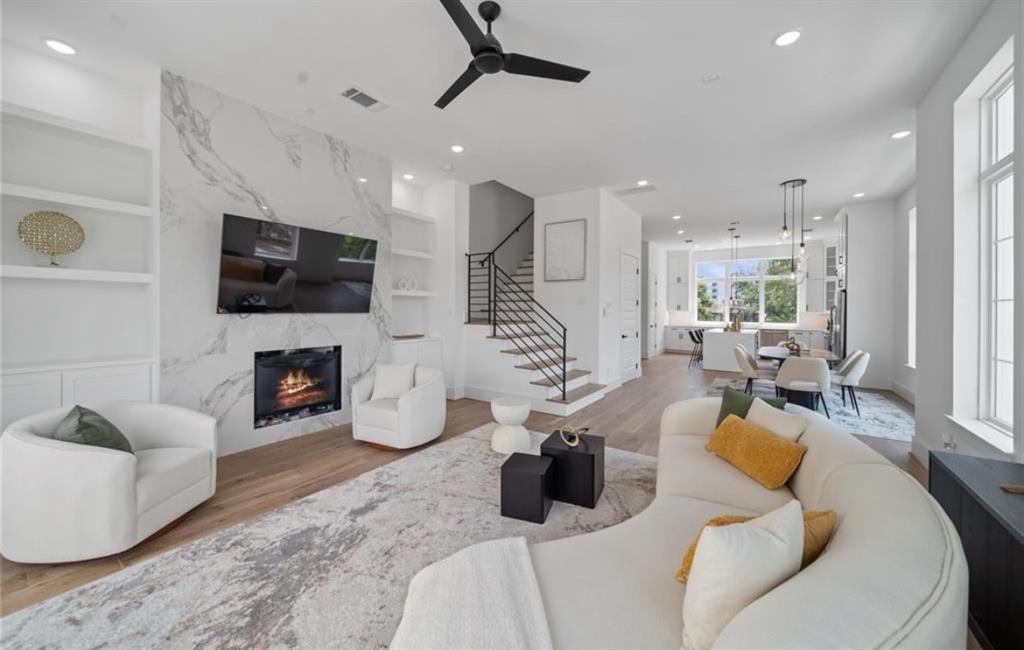
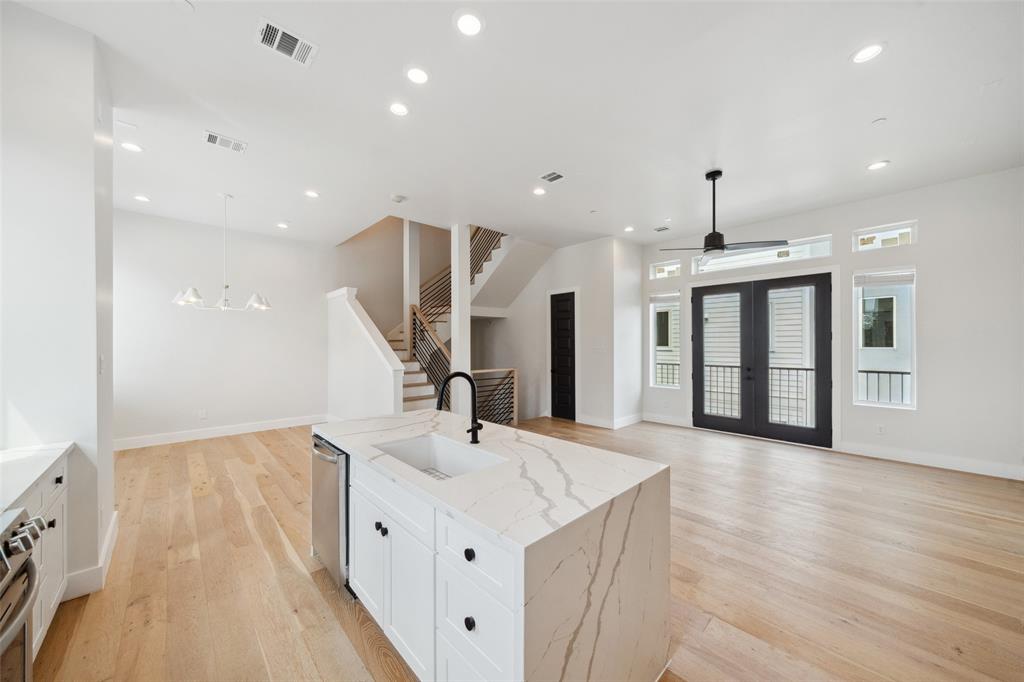
$675,000
3
bds
|
0
ba
|
2,650
sqft
|
built
2024
5706 Fairdale Ln, Houston, TX 77057
$-505
Cash flow
-3.9%
Cash-on-Cash Return
4.8%
Cap rate
0.8%
Rent to Value Ratio
8,547 out of 8,994 properties for sale in Houston, TX
Limited Results Shown
Create a free account, or log in to reveal all property listings and enjoy the complete experience.
Active
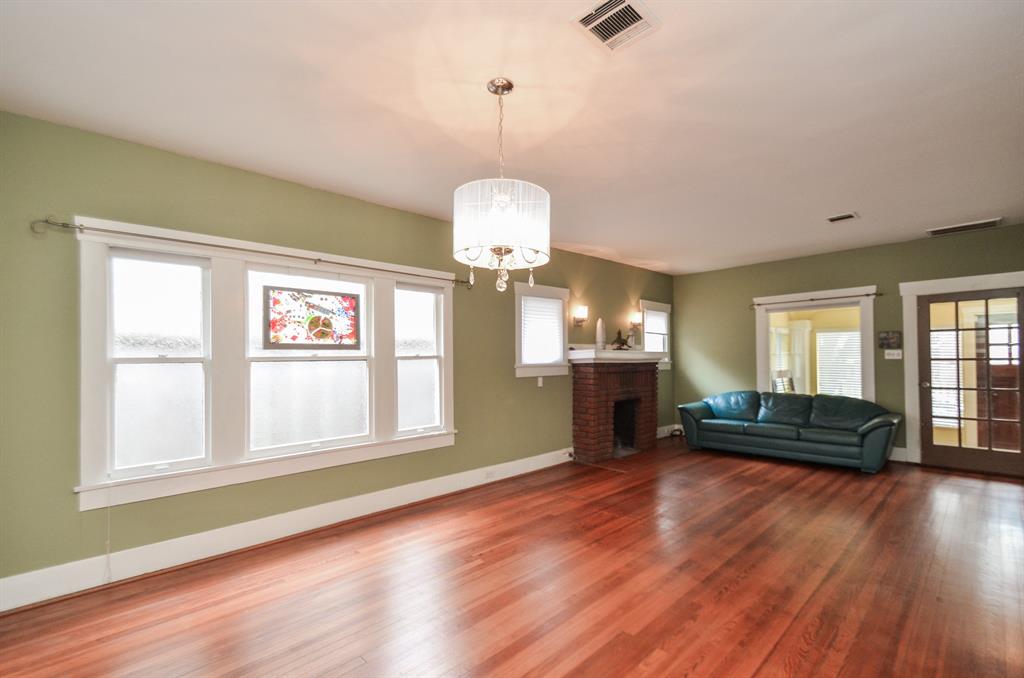
$875,000
3
bds
|
0
ba
|
1,846
sqft
|
built
1920
3211 Beauchamp St, Houston, TX 77009
$-3,146
Cash flow
-18.8%
Cash-on-Cash Return
1.4%
Cap rate
0.3%
Rent to Value Ratio
Active
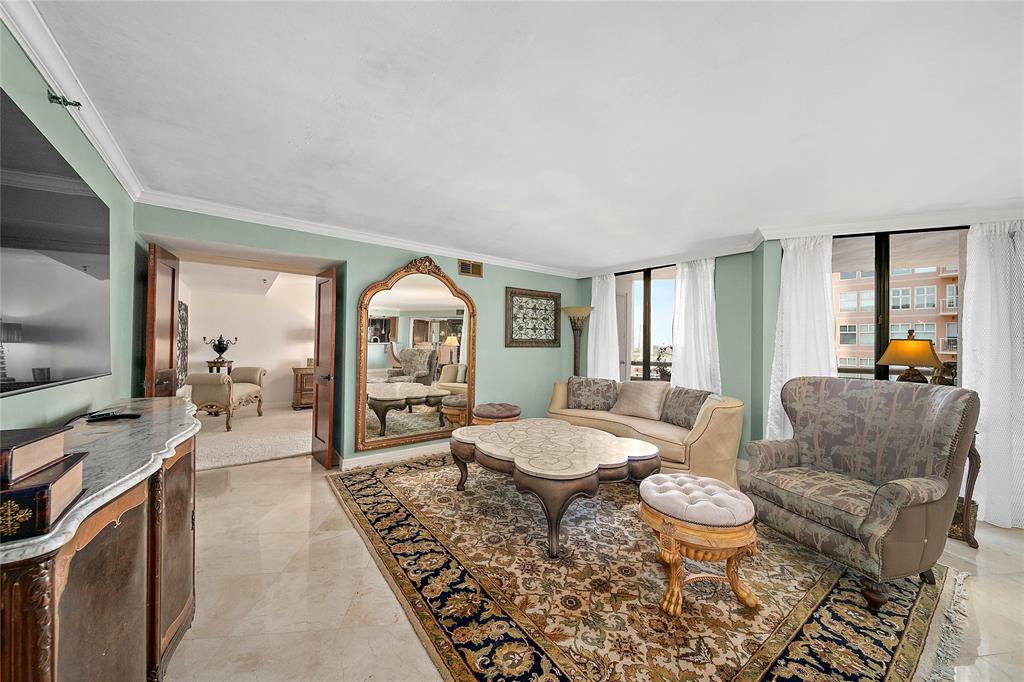
$399,000
2
bds
|
0
ba
|
1,928
sqft
|
built
1985
3525 Sage Rd, Houston, TX 77056
$-1,064
Cash flow
-13.9%
Cash-on-Cash Return
2.5%
Cap rate
1.0%
Rent to Value Ratio
Active
$699,000
4
bds
|
0
ba
|
3,343
sqft
|
built
1990
1918 Winter Knoll Way, Houston, TX 77062
$-1,990
Cash flow
-14.9%
Cash-on-Cash Return
2.3%
Cap rate
0.5%
Rent to Value Ratio
Active
$405,000
3
bds
|
0
ba
|
2,600
sqft
|
built
2001
2827 Briarhurst Park, Houston, TX 77057
$-887
Cash flow
-11.4%
Cash-on-Cash Return
3.1%
Cap rate
0.7%
Rent to Value Ratio
Active
$427,000
2
bds
|
0
ba
|
2,396
sqft
|
built
1961
11202 Waxwing St, Houston, TX 77035
$-1,437
Cash flow
-17.6%
Cash-on-Cash Return
1.6%
Cap rate
0.4%
Rent to Value Ratio

Active under contract
$689,000
4
bds
|
0
ba
|
3,723
sqft
|
built
2014
2707 Rusk St, Houston, TX 77003
$-991
Cash flow
-7.5%
Cash-on-Cash Return
4.0%
Cap rate
0.8%
Rent to Value Ratio
Active
$599,500
3
bds
|
0
ba
|
1,917
sqft
|
built
2016
5413 Larkin St, Houston, TX 77007
$-754
Cash flow
-6.6%
Cash-on-Cash Return
4.2%
Cap rate
0.5%
Rent to Value Ratio
Pending
$549,900
3
bds
|
0
ba
|
2,104
sqft
|
built
2016
1812 Bingham St, Houston, TX 77007
$-1,159
Cash flow
-11.0%
Cash-on-Cash Return
3.1%
Cap rate
0.6%
Rent to Value Ratio
Active
$1,399,000
10
bds
|
0
ba
|
9,512
sqft
|
built
2018
5726 Martha Ln, Houston, TX 77032
$-9,596
Cash flow
-35.8%
Cash-on-Cash Return
-2.6%
Cap rate
0.1%
Rent to Value Ratio
Active
$895,000
5
bds
|
0
ba
|
3,785
sqft
|
built
1993
27 Thornhill Oaks Dr, Houston, TX 77015
$-2,525
Cash flow
-14.7%
Cash-on-Cash Return
2.3%
Cap rate
0.4%
Rent to Value Ratio
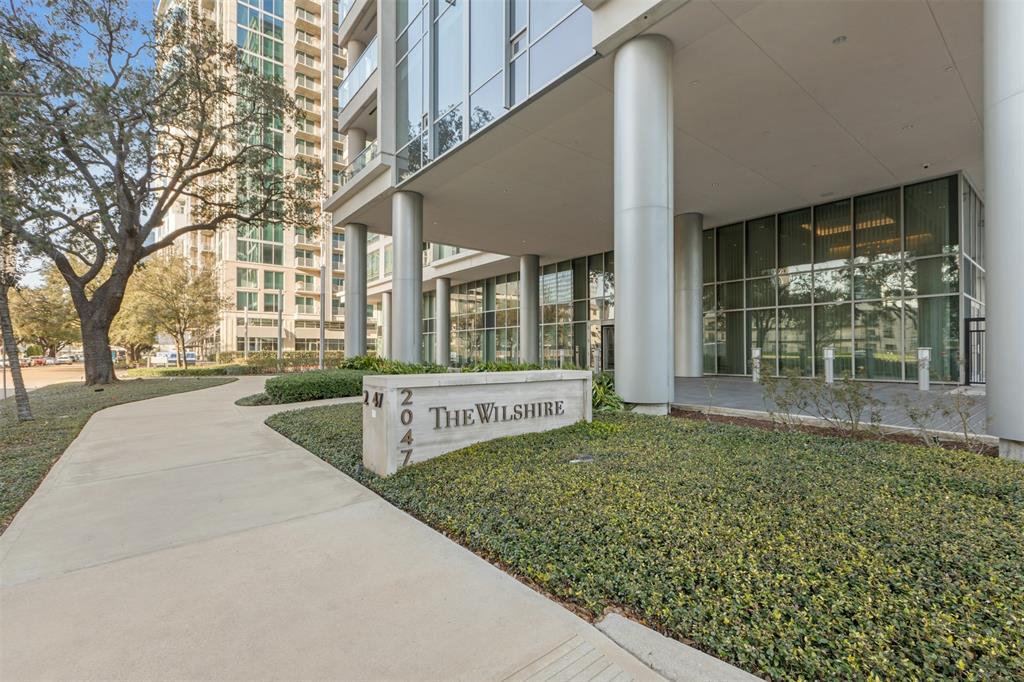
Active
$1,650,000
2
bds
|
0
ba
|
2,324
sqft
|
built
2017
2047 Westcreek Ln, Houston, TX 77027
$-8,512
Cash flow
-26.9%
Cash-on-Cash Return
-0.5%
Cap rate
0.3%
Rent to Value Ratio
Active
$525,000
3
bds
|
0
ba
|
2,632
sqft
|
built
2016
1005 Kern St, Houston, TX 77009
$-631
Cash flow
-6.3%
Cash-on-Cash Return
4.2%
Cap rate
0.7%
Rent to Value Ratio
Active
$349,900
3
bds
|
0
ba
|
2,121
sqft
|
built
1983
2619 Sailboat Dr, Houston, TX 77058
$-877
Cash flow
-13.1%
Cash-on-Cash Return
2.7%
Cap rate
0.8%
Rent to Value Ratio
Active
$379,000
3
bds
|
0
ba
|
1,189
sqft
|
built
1956
2009 Sedgie Dr, Houston, TX 77080
$-816
Cash flow
-11.2%
Cash-on-Cash Return
3.1%
Cap rate
0.5%
Rent to Value Ratio
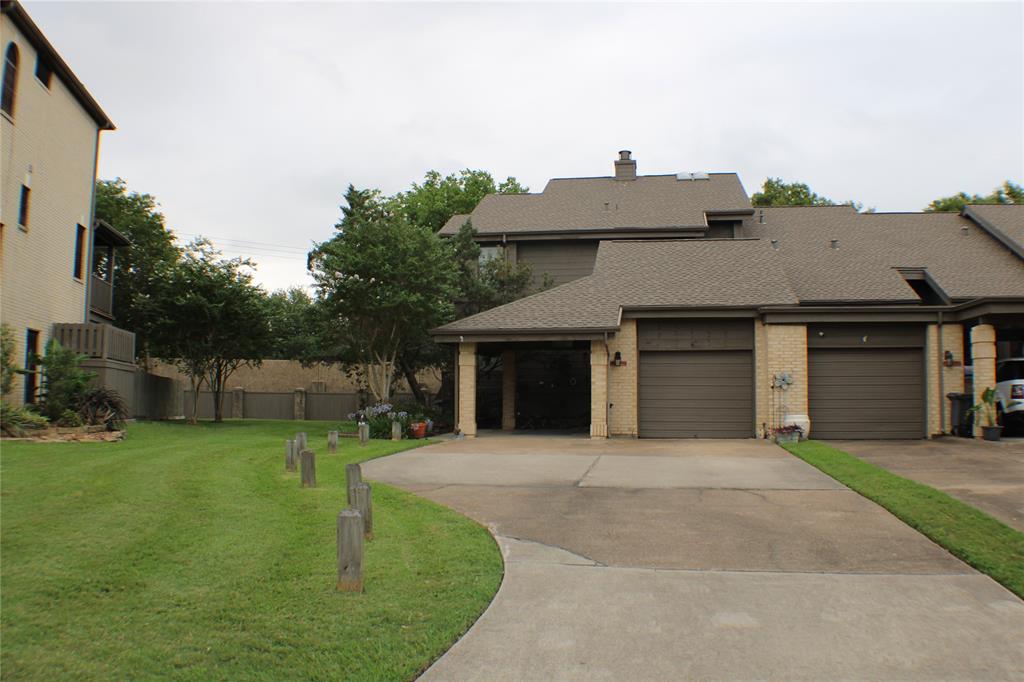
Active
$400,000
4
bds
|
0
ba
|
3,097
sqft
|
built
1993
6923 Queensclub Dr, Houston, TX 77069
$-754
Cash flow
-9.8%
Cash-on-Cash Return
3.4%
Cap rate
0.7%
Rent to Value Ratio
Active
$1,450,000
4
bds
|
0
ba
|
2,757
sqft
|
built
1955
11902 Dover St, Houston, TX 77031
$-5,682
Cash flow
-20.4%
Cash-on-Cash Return
1.0%
Cap rate
0.2%
Rent to Value Ratio
Active
$1,299,000
3
bds
|
0
ba
|
2,480
sqft
|
built
1962
1622 Haverhill Dr, Houston, TX 77008
$-3,306
Cash flow
-13.3%
Cash-on-Cash Return
2.6%
Cap rate
0.5%
Rent to Value Ratio

Active
$330,000
3
bds
|
0
ba
|
2,115
sqft
|
built
1980
661 Bering Dr, Houston, TX 77057
$-2,375
Cash flow
-37.5%
Cash-on-Cash Return
-3.0%
Cap rate
0.7%
Rent to Value Ratio
Active
$250,000
3
bds
|
0
ba
|
840
sqft
|
built
1935
2607 Milwaukee St, Houston, TX 77026
$-297
Cash flow
-6.2%
Cash-on-Cash Return
4.3%
Cap rate
0.6%
Rent to Value Ratio
Active
$387,900
5
bds
|
0
ba
|
2,521
sqft
|
built
2002
9323 Windy Spring Ln, Houston, TX 77089
$-724
Cash flow
-9.7%
Cash-on-Cash Return
3.4%
Cap rate
0.7%
Rent to Value Ratio
Active
$799,000
2
bds
|
0
ba
|
1,000
sqft
|
built
1956
1240 W 26th St, Houston, TX 77008
$-3,203
Cash flow
-20.9%
Cash-on-Cash Return
0.9%
Cap rate
0.3%
Rent to Value Ratio
Active
$675,000
3
bds
|
0
ba
|
2,650
sqft
|
built
2024
5706 Fairdale Ln, Houston, TX 77057
$-505
Cash flow
-3.9%
Cash-on-Cash Return
4.8%
Cap rate
0.8%
Rent to Value Ratio
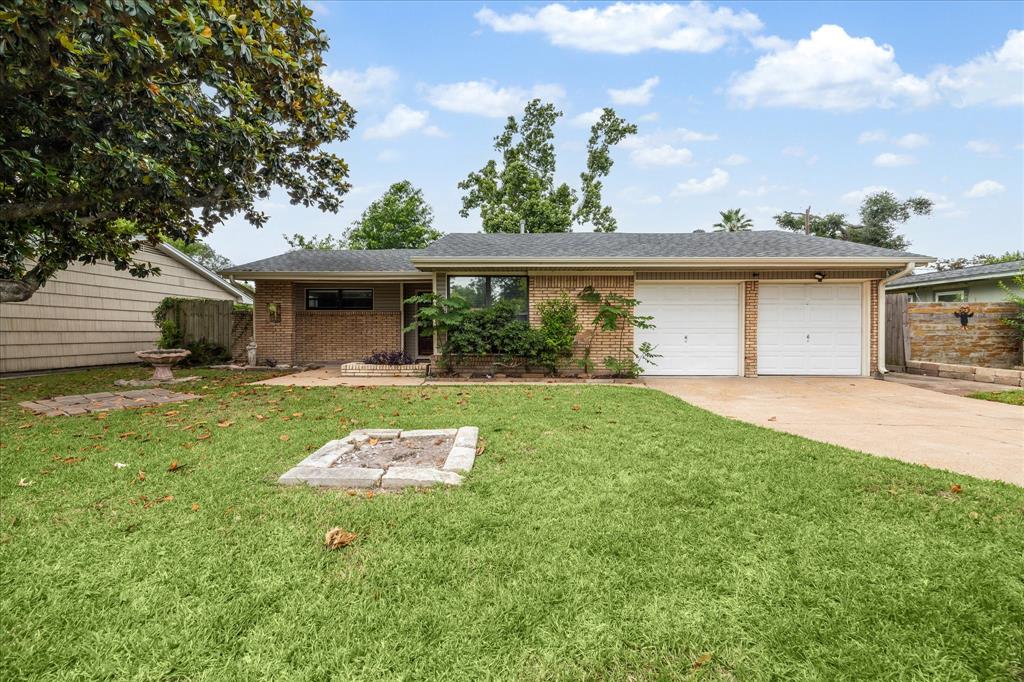
Active
$429,000
4
bds
|
0
ba
|
1,864
sqft
|
built
1971
9711 Derrik Dr, Houston, TX 77080
$-1,022
Cash flow
-12.4%
Cash-on-Cash Return
2.8%
Cap rate
0.5%
Rent to Value Ratio

Active
$345,000
2
bds
|
0
ba
|
1,500
sqft
|
built
1977
701 Bering Dr, Houston, TX 77057
$-1,322
Cash flow
-20.0%
Cash-on-Cash Return
1.1%
Cap rate
0.7%
Rent to Value Ratio
Active
$2,295,000
7
bds
|
0
ba
|
6,598
sqft
|
built
2008
3012 Houston Ave, Houston, TX 77009
$-7,814
Cash flow
-17.8%
Cash-on-Cash Return
1.6%
Cap rate
0.3%
Rent to Value Ratio
Active
$450,000
2
bds
|
0
ba
|
3,356
sqft
|
built
1980
12955 Woodforest Blvd, Houston, TX 77015
$-3,473
Cash flow
-40.3%
Cash-on-Cash Return
-3.6%
Cap rate
0.2%
Rent to Value Ratio
Active
$399,900
3
bds
|
0
ba
|
2,300
sqft
|
built
2020
5911 Westover St, Houston, TX 77033
$-1,206
Cash flow
-15.7%
Cash-on-Cash Return
2.1%
Cap rate
0.5%
Rent to Value Ratio
Active
$249,900
3
bds
|
0
ba
|
1,939
sqft
|
built
2016
17035 Wilthorne Gardens Ct, Houston, TX 77084
$-535
Cash flow
-11.2%
Cash-on-Cash Return
3.1%
Cap rate
0.8%
Rent to Value Ratio
Active
$175,000
2
bds
|
0
ba
|
1,600
sqft
|
built
1984
3254 Holly Hall St, Houston, TX 77054
$-668
Cash flow
-19.9%
Cash-on-Cash Return
1.1%
Cap rate
1.0%
Rent to Value Ratio

Active
$1,600,000
5
bds
|
0
ba
|
3,747
sqft
|
built
2012
1024 Waverly St, Houston, TX 77008
$-5,214
Cash flow
-17.0%
Cash-on-Cash Return
1.8%
Cap rate
0.4%
Rent to Value Ratio
Active
$285,000
3
bds
|
0
ba
|
2,016
sqft
|
built
1968
500 N Post Oak Rd, Houston, TX 77024
$-1,427
Cash flow
-26.1%
Cash-on-Cash Return
-0.3%
Cap rate
0.9%
Rent to Value Ratio
Active
$2,499,999
4
bds
|
0
ba
|
5,336
sqft
|
built
2008
4020 Sul Ross St, Houston, TX 77027
$-9,859
Cash flow
-20.6%
Cash-on-Cash Return
0.9%
Cap rate
0.3%
Rent to Value Ratio
Active
$1,100,000
3
bds
|
0
ba
|
2,910
sqft
|
built
2006
3214 Mid Ln, Houston, TX 77027
$-2,854
Cash flow
-13.5%
Cash-on-Cash Return
2.6%
Cap rate
0.6%
Rent to Value Ratio

Active
$395,000
3
bds
|
0
ba
|
1,937
sqft
|
built
1980
14 Greenway Plz, Houston, TX 77046
$-2,011
Cash flow
-26.6%
Cash-on-Cash Return
-0.4%
Cap rate
0.9%
Rent to Value Ratio
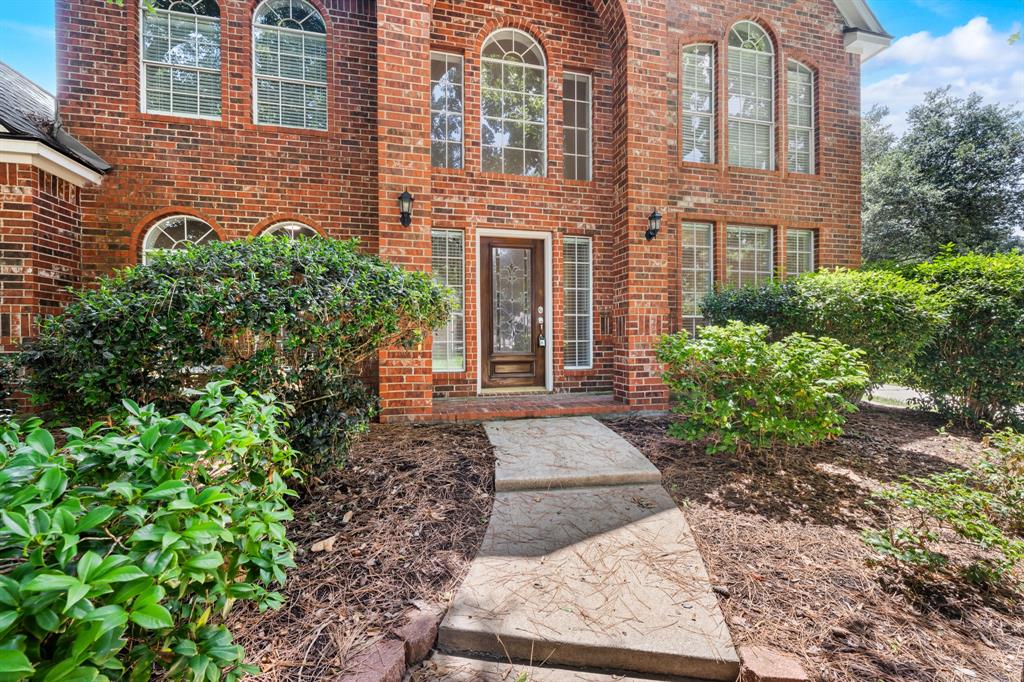
Active under contract
$1,195,000
4
bds
|
0
ba
|
3,960
sqft
|
built
2002
3606 Las Palmas St, Houston, TX 77027
$-2,418
Cash flow
-10.6%
Cash-on-Cash Return
3.3%
Cap rate
0.6%
Rent to Value Ratio
Active
$1,199,000
4
bds
|
0
ba
|
3,893
sqft
|
built
2007
5513 Val Verde St, Houston, TX 77056
$-3,014
Cash flow
-13.1%
Cash-on-Cash Return
2.7%
Cap rate
0.5%
Rent to Value Ratio
Active
$399,900
3
bds
|
0
ba
|
2,126
sqft
|
built
2004
17811 Skyline Arbor Ter, Houston, TX 77094
$-1,099
Cash flow
-14.3%
Cash-on-Cash Return
2.4%
Cap rate
0.7%
Rent to Value Ratio
Active
$750,000
2
bds
|
0
ba
|
1,455
sqft
|
built
2018
4521 San Felipe St, Houston, TX 77027
$-1,337
Cash flow
-9.3%
Cash-on-Cash Return
3.5%
Cap rate
0.7%
Rent to Value Ratio
Active
$385,000
4
bds
|
0
ba
|
2,636
sqft
|
built
2016
13705 Northline Lake Dr, Houston, TX 77044
$-959
Cash flow
-13.0%
Cash-on-Cash Return
2.7%
Cap rate
0.7%
Rent to Value Ratio
Active
$359,900
3
bds
|
0
ba
|
1,403
sqft
|
built
1949
5500 Evergreen St, Houston, TX 77081
$-692
Cash flow
-10.0%
Cash-on-Cash Return
3.4%
Cap rate
0.6%
Rent to Value Ratio