Houston, TX Investment Properties for Sale
Browse homes for sale and investment properties in Houston, TX. Refine your search by price, property type, or more.
Best cash flowing properties in Houston, TX
Active
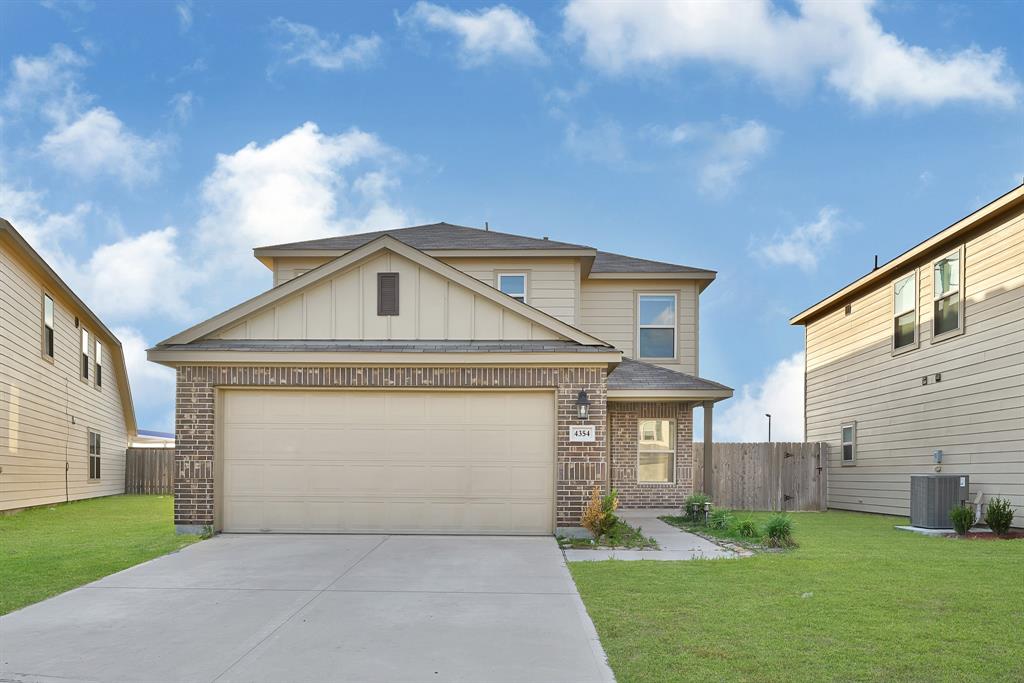
$290,000
4
bds
|
0
ba
|
1,903
sqft
|
built
2021
4354 Tulip Oak Dr, Houston, TX 77068
$182
Cash flow
3.3%
Cash-on-Cash Return
6.4%
Cap rate
0.8%
Rent to Value Ratio
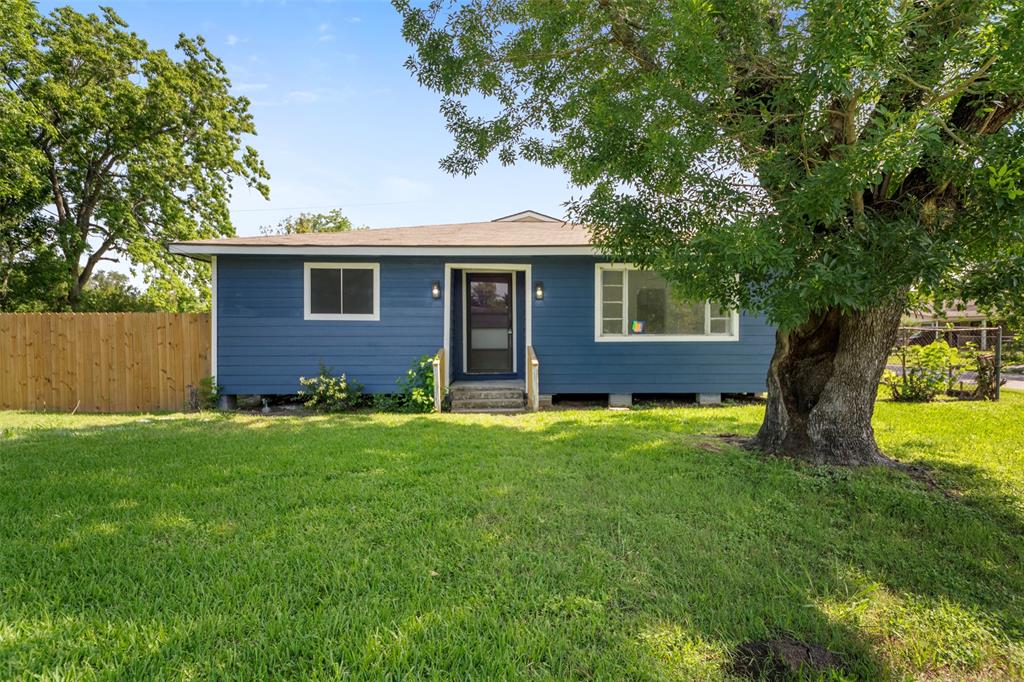
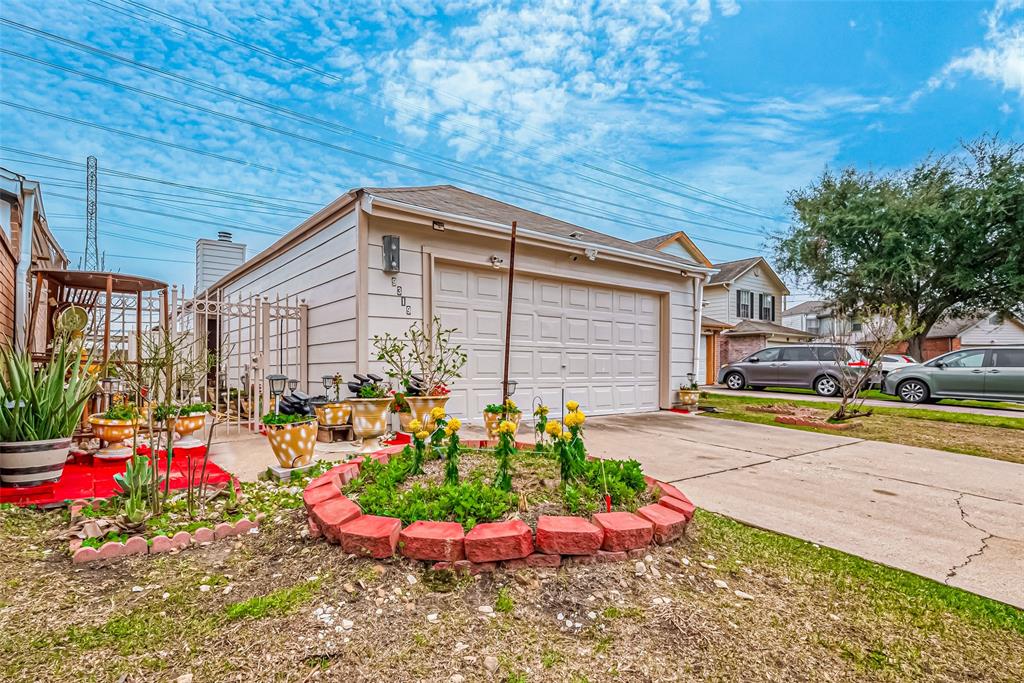
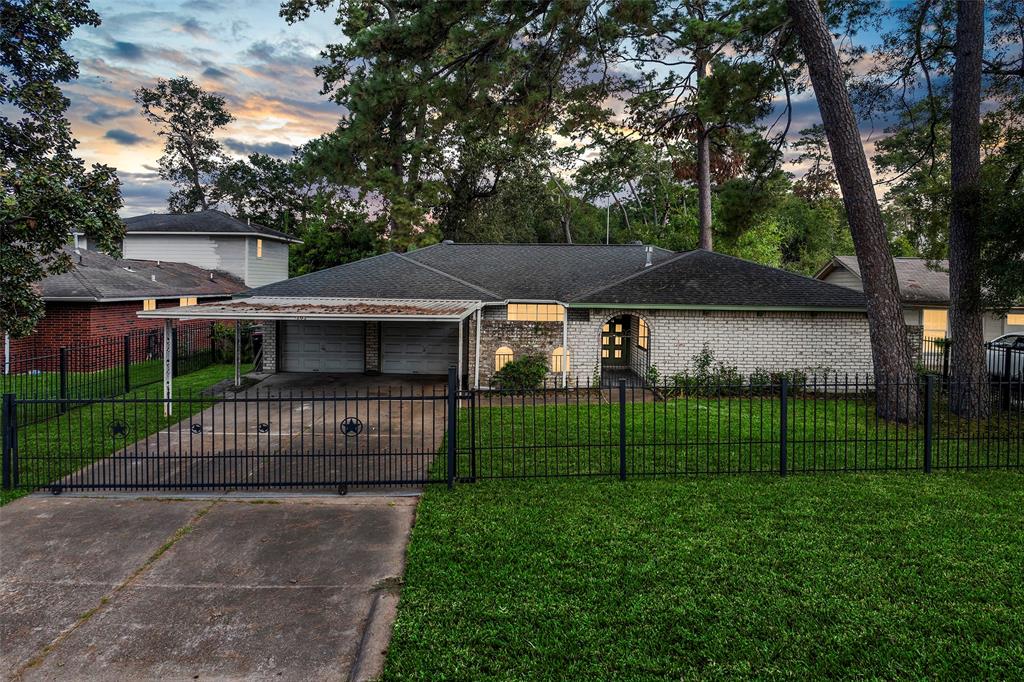
Active
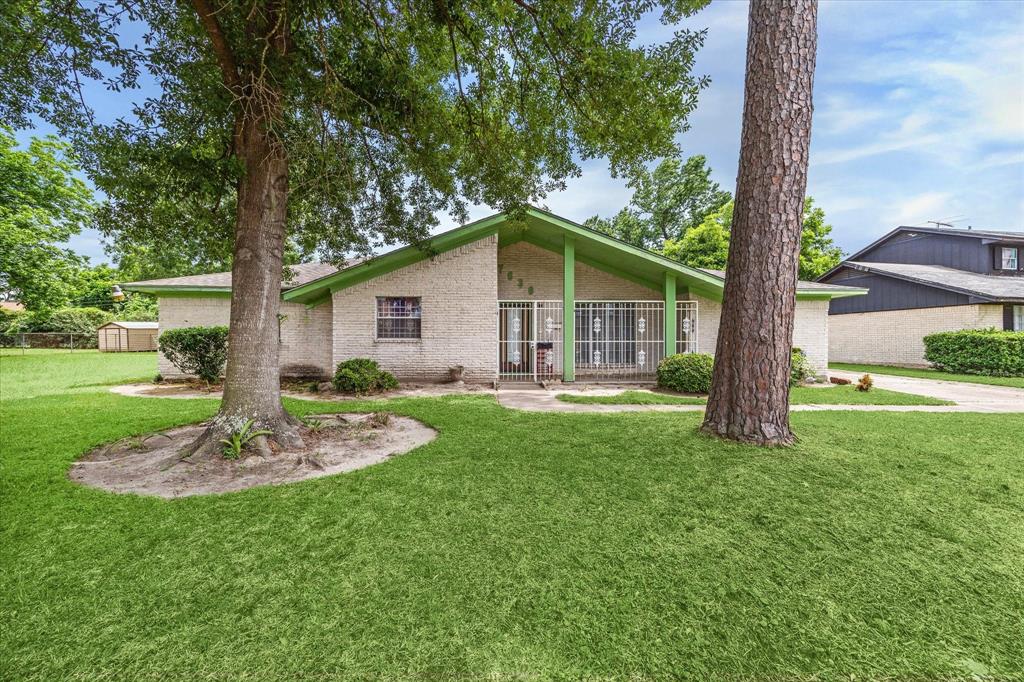
$185,000
3
bds
|
0
ba
|
2,422
sqft
|
built
1969
7630 Tully St, Houston, TX 77016
$133
Cash flow
3.8%
Cash-on-Cash Return
6.5%
Cap rate
1.1%
Rent to Value Ratio
8,547 out of 8,994 properties for sale in Houston, TX
Limited Results Shown
Create a free account, or log in to reveal all property listings and enjoy the complete experience.
Active
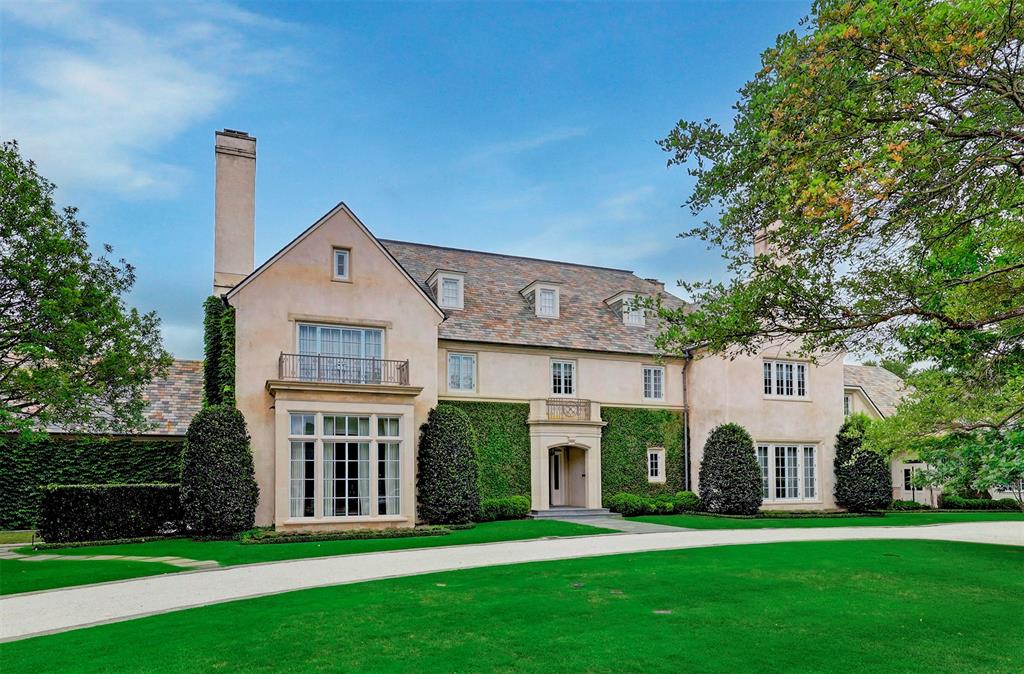
$23,500,000
4
bds
|
0
ba
|
15,791
sqft
|
built
2011
3 Briarwood Ct, Houston, TX 77019
$-138,531
Cash flow
-30.8%
Cash-on-Cash Return
-1.4%
Cap rate
0.0%
Rent to Value Ratio
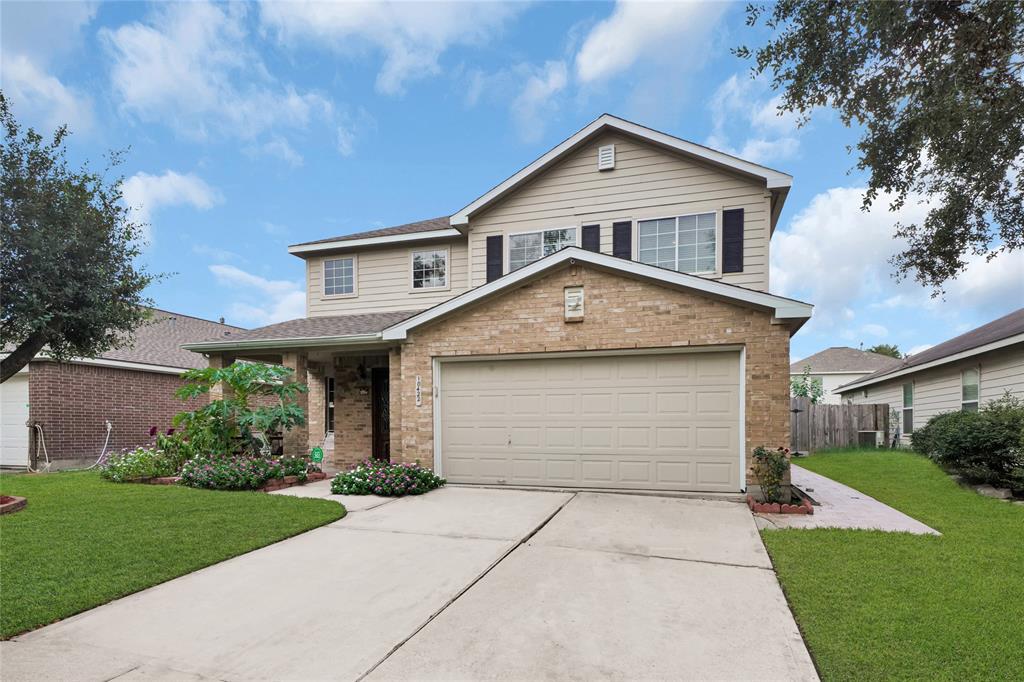
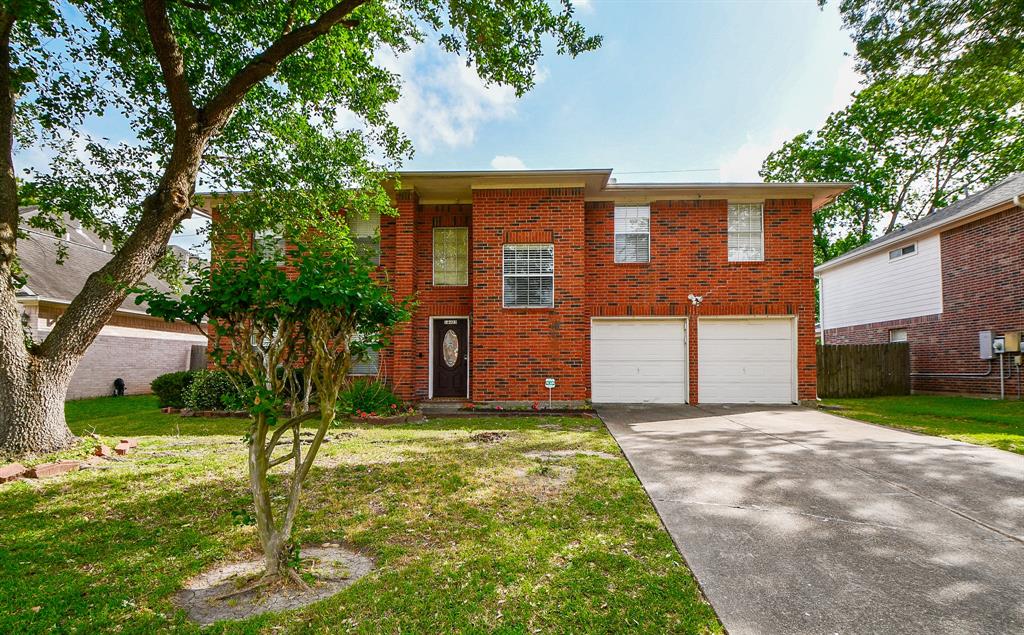
Active
$375,000
3
bds
|
0
ba
|
2,898
sqft
|
built
2007
16407 Jadestone Terrace Ln, Houston, TX 77044
$-569
Cash flow
-7.9%
Cash-on-Cash Return
3.9%
Cap rate
0.7%
Rent to Value Ratio
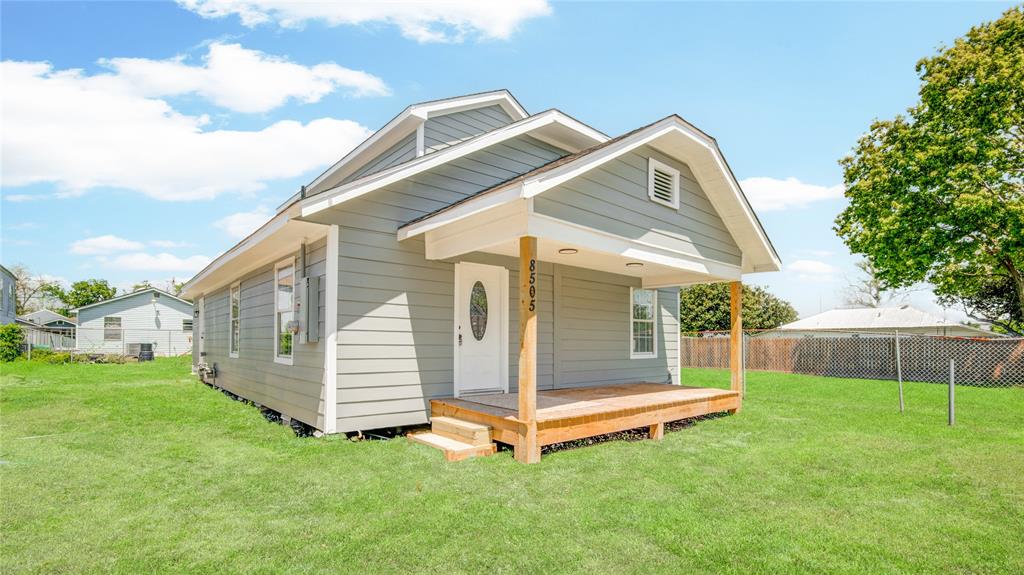
Active
$199,990
3
bds
|
0
ba
|
1,477
sqft
|
built
1946
8505 Denby St, Houston, TX 77012
$-91
Cash flow
-2.4%
Cash-on-Cash Return
5.1%
Cap rate
0.8%
Rent to Value Ratio
Active
$335,000
2
bds
|
0
ba
|
1,365
sqft
|
built
2022
753 N Emile St, Houston, TX 77020
$-310
Cash flow
-4.8%
Cash-on-Cash Return
4.6%
Cap rate
0.8%
Rent to Value Ratio
Active
$159,000
2
bds
|
0
ba
|
1,204
sqft
|
built
1984
8888 Benning Dr, Houston, TX 77031
$-275
Cash flow
-9.0%
Cash-on-Cash Return
3.6%
Cap rate
1.0%
Rent to Value Ratio

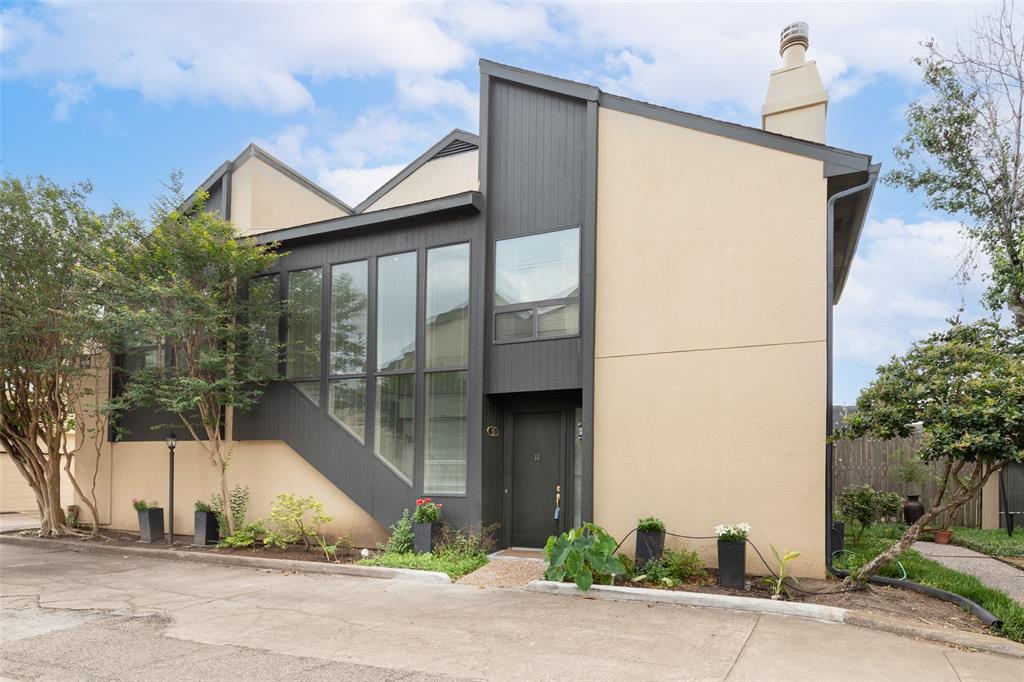
Active
$190,000
1
bds
|
0
ba
|
1,095
sqft
|
built
1979
782 Worthshire St, Houston, TX 77008
$-500
Cash flow
-13.7%
Cash-on-Cash Return
2.5%
Cap rate
1.1%
Rent to Value Ratio
Active
$160,000
2
bds
|
0
ba
|
909
sqft
|
built
1976
1100 Augusta Dr, Houston, TX 77057
$-297
Cash flow
-9.7%
Cash-on-Cash Return
3.5%
Cap rate
1.0%
Rent to Value Ratio
Active
$309,900
3
bds
|
0
ba
|
2,081
sqft
|
built
2021
2019 Harlem St, Houston, TX 77020
$-499
Cash flow
-8.4%
Cash-on-Cash Return
3.7%
Cap rate
0.7%
Rent to Value Ratio
Active
$195,000
3
bds
|
0
ba
|
1,200
sqft
|
built
2000
2323 Chalet Rd, Houston, TX 77038
$-142
Cash flow
-3.8%
Cash-on-Cash Return
4.8%
Cap rate
0.8%
Rent to Value Ratio
Active
$289,000
3
bds
|
0
ba
|
1,900
sqft
|
built
1983
10114 Spotted Horse Dr, Houston, TX 77064
$-561
Cash flow
-10.1%
Cash-on-Cash Return
3.4%
Cap rate
0.6%
Rent to Value Ratio
Active
$299,900
4
bds
|
0
ba
|
2,630
sqft
|
built
2002
10134 Lasaber Ct, Houston, TX 77038
$-264
Cash flow
-4.6%
Cash-on-Cash Return
4.6%
Cap rate
0.8%
Rent to Value Ratio
Active
$270,000
3
bds
|
0
ba
|
1,925
sqft
|
built
1955
4843 Bricker St, Houston, TX 77033
$-357
Cash flow
-6.9%
Cash-on-Cash Return
4.1%
Cap rate
0.6%
Rent to Value Ratio
Active
$279,000
2
bds
|
0
ba
|
1,610
sqft
|
built
1977
1116 Bering Dr, Houston, TX 77057
$-498
Cash flow
-9.3%
Cash-on-Cash Return
3.5%
Cap rate
0.8%
Rent to Value Ratio
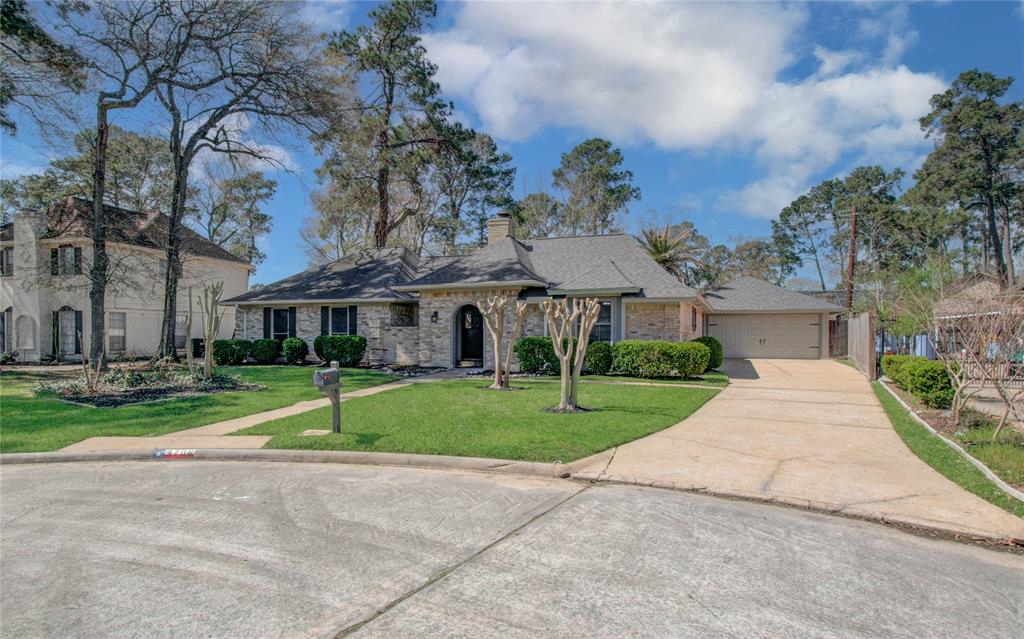
Active
$319,900
4
bds
|
0
ba
|
2,264
sqft
|
built
1976
3706 Brookbank Dr, Houston, TX 77068
$-581
Cash flow
-9.5%
Cash-on-Cash Return
3.5%
Cap rate
0.7%
Rent to Value Ratio
Active
$289,900
3
bds
|
0
ba
|
1,916
sqft
|
built
2003
10422 Sutter Glen Ln, Houston, TX 77075
$-488
Cash flow
-8.8%
Cash-on-Cash Return
3.7%
Cap rate
0.8%
Rent to Value Ratio
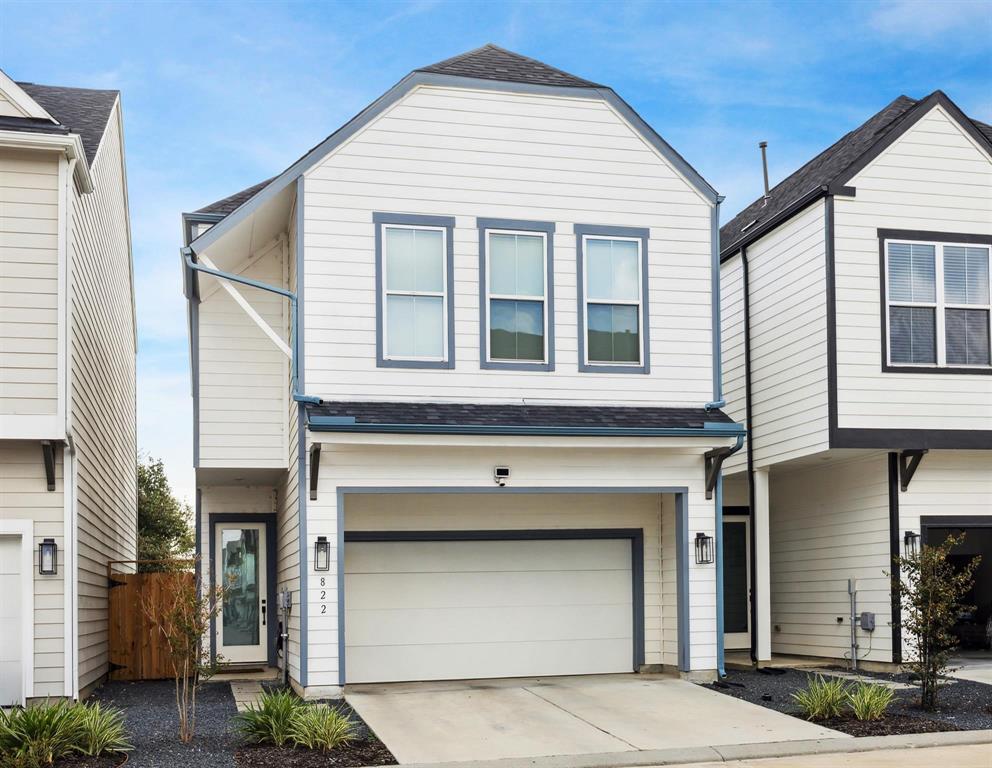
Active
$325,000
3
bds
|
0
ba
|
1,948
sqft
|
built
2022
822 Berry Sage Ln, Houston, TX 77022
$-478
Cash flow
-7.7%
Cash-on-Cash Return
3.9%
Cap rate
0.8%
Rent to Value Ratio
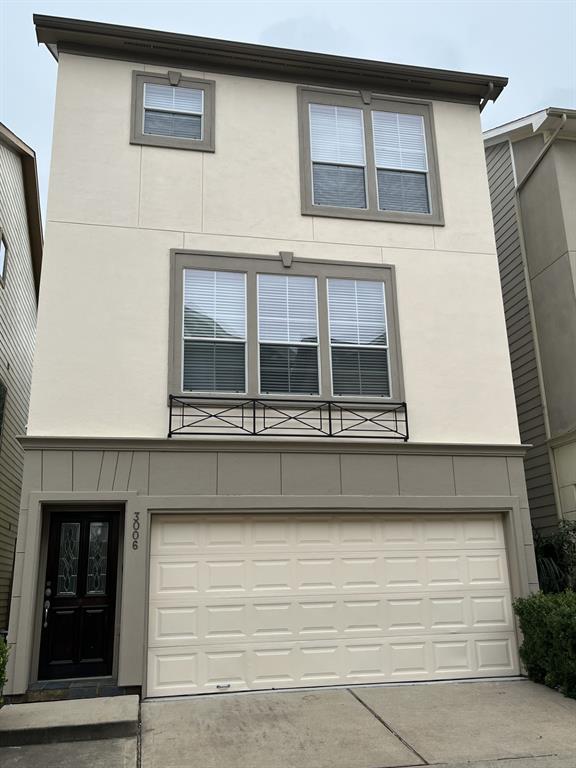
Active
$398,000
3
bds
|
0
ba
|
1,936
sqft
|
built
2008
3006 Clearview Cir, Houston, TX 77025
$-571
Cash flow
-7.5%
Cash-on-Cash Return
4.0%
Cap rate
0.7%
Rent to Value Ratio
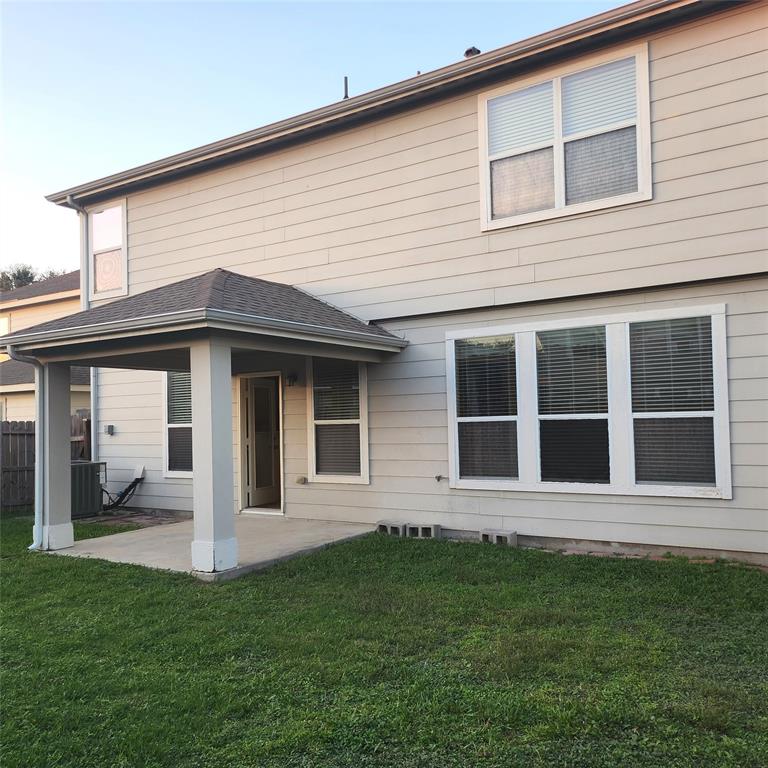
Active
$325,000
5
bds
|
0
ba
|
3,272
sqft
|
built
2008
238 Remington Heights Dr, Houston, TX 77073
$-473
Cash flow
-7.6%
Cash-on-Cash Return
3.9%
Cap rate
0.8%
Rent to Value Ratio

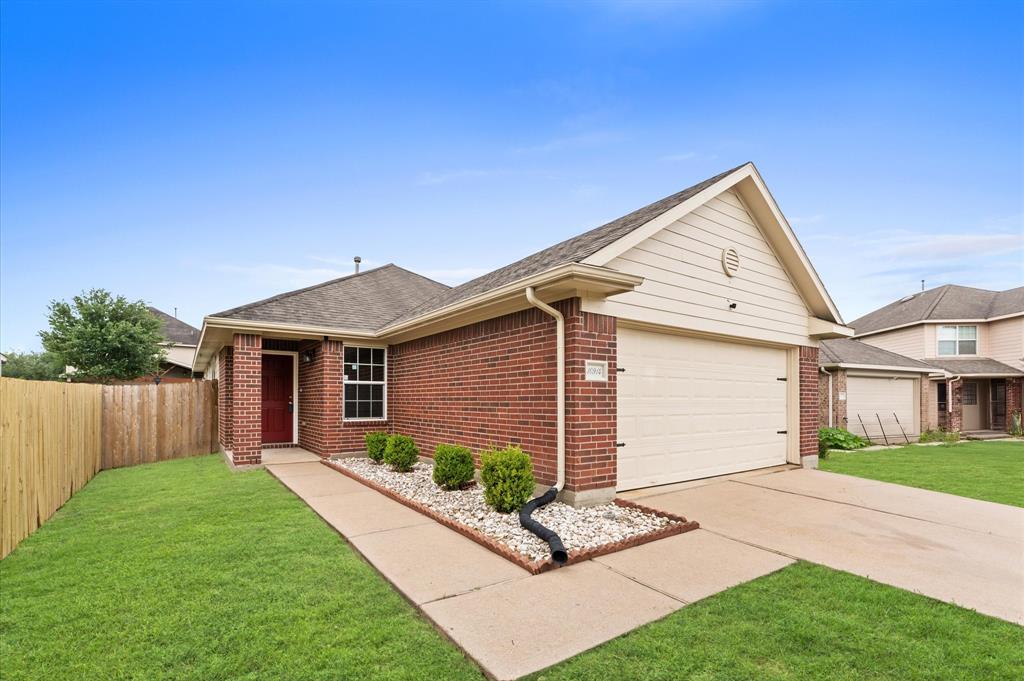
Active
$515,000
3
bds
|
0
ba
|
2,348
sqft
|
built
2005
234 Detering St, Houston, TX 77007
$-409
Cash flow
-4.1%
Cash-on-Cash Return
4.7%
Cap rate
0.6%
Rent to Value Ratio
Active
$278,000
4
bds
|
0
ba
|
1,372
sqft
|
built
2009
10914 Kelly Hill Ct, Houston, TX 77034
$-638
Cash flow
-12.0%
Cash-on-Cash Return
2.9%
Cap rate
0.7%
Rent to Value Ratio
Active
$185,000
3
bds
|
0
ba
|
2,422
sqft
|
built
1969
7630 Tully St, Houston, TX 77016
$133
Cash flow
3.8%
Cash-on-Cash Return
6.5%
Cap rate
1.1%
Rent to Value Ratio
Active
$254,900
3
bds
|
0
ba
|
1,762
sqft
|
built
1960
1015 Twin Falls Rd, Houston, TX 77088
$-206
Cash flow
-4.2%
Cash-on-Cash Return
4.7%
Cap rate
0.8%
Rent to Value Ratio
Active
$304,900
2
bds
|
0
ba
|
1,965
sqft
|
built
2006
12314 Timber Holw, Houston, TX 77058
$-547
Cash flow
-9.4%
Cash-on-Cash Return
3.5%
Cap rate
0.8%
Rent to Value Ratio
Active
$515,000
4
bds
|
0
ba
|
2,842
sqft
|
built
1996
12710 Wilbury Park, Houston, TX 77041
$-456
Cash flow
-4.6%
Cash-on-Cash Return
4.6%
Cap rate
0.6%
Rent to Value Ratio
Active
$205,900
4
bds
|
0
ba
|
1,328
sqft
|
built
1951
5033 Doolittle Blvd, Houston, TX 77033
$-73
Cash flow
-1.8%
Cash-on-Cash Return
5.3%
Cap rate
0.9%
Rent to Value Ratio
Active
$249,900
3
bds
|
0
ba
|
1,652
sqft
|
built
1982
9319 Belle Park Dr, Houston, TX 77099
$-538
Cash flow
-11.2%
Cash-on-Cash Return
3.1%
Cap rate
0.6%
Rent to Value Ratio
Active
$315,000
4
bds
|
0
ba
|
2,382
sqft
|
built
1995
16023 Mission Glen Dr, Houston, TX 77083
$-485
Cash flow
-8.0%
Cash-on-Cash Return
3.8%
Cap rate
0.7%
Rent to Value Ratio
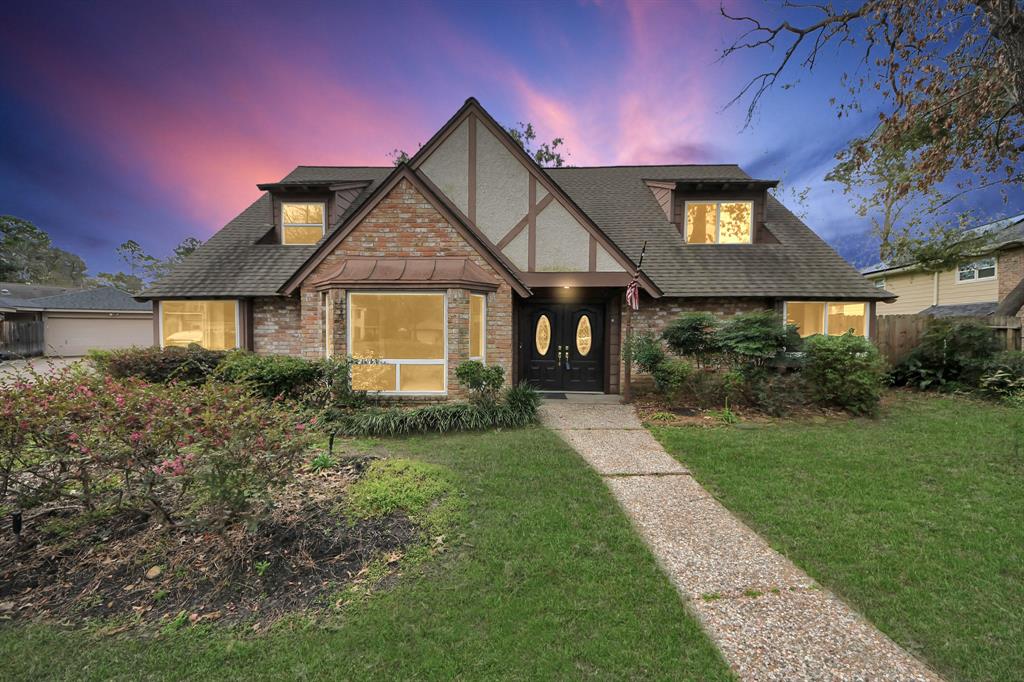
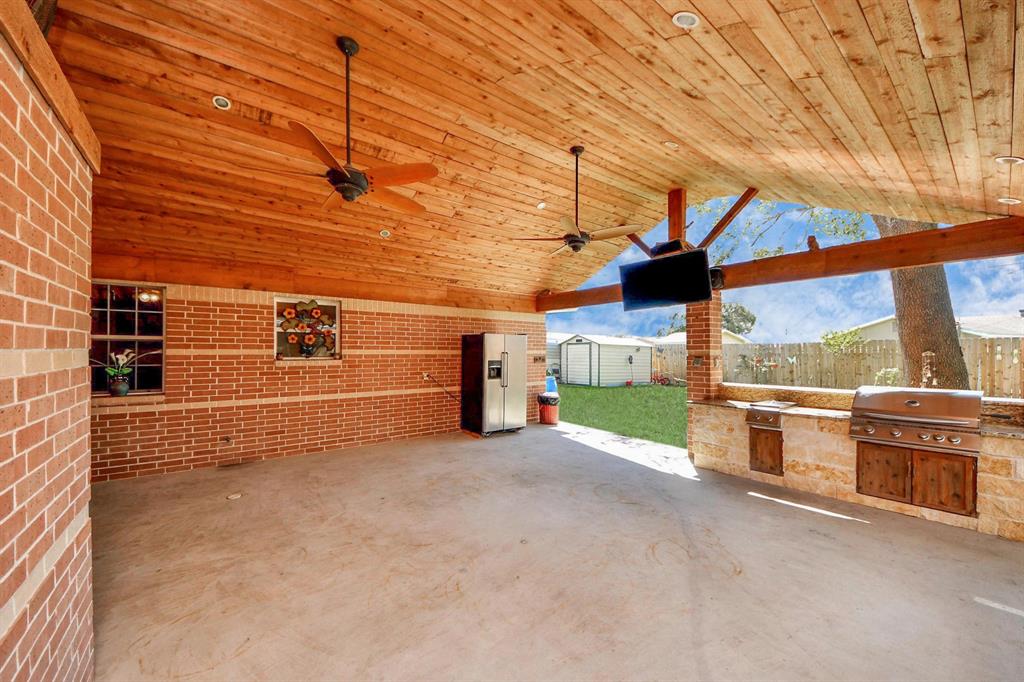
Active
$389,900
5
bds
|
0
ba
|
2,632
sqft
|
built
1976
13407 Vestavia Ct, Houston, TX 77069
$-501
Cash flow
-6.7%
Cash-on-Cash Return
4.1%
Cap rate
0.7%
Rent to Value Ratio
Active
$275,000
4
bds
|
0
ba
|
1,422
sqft
|
built
1958
9926 Caffrey St, Houston, TX 77075
$-457
Cash flow
-8.7%
Cash-on-Cash Return
3.7%
Cap rate
0.6%
Rent to Value Ratio

Active
$290,000
3
bds
|
0
ba
|
2,318
sqft
|
built
2003
3307 Manor Tree Ln, Houston, TX 77068
$-437
Cash flow
-7.9%
Cash-on-Cash Return
3.9%
Cap rate
0.8%
Rent to Value Ratio
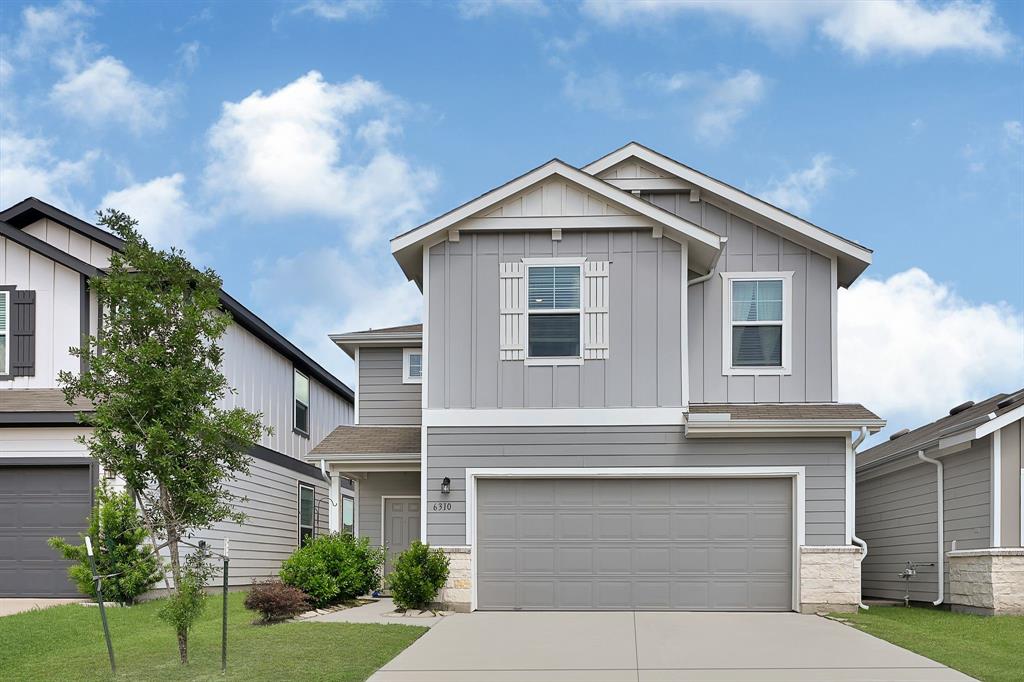
Active
$325,000
4
bds
|
0
ba
|
2,405
sqft
|
built
2021
6310 Franklin View Ln, Houston, TX 77084
$-603
Cash flow
-9.7%
Cash-on-Cash Return
3.5%
Cap rate
0.8%
Rent to Value Ratio
Active
$244,895
3
bds
|
0
ba
|
1,629
sqft
|
built
1968
5203 Sandydale Ln, Houston, TX 77039
$-348
Cash flow
-7.4%
Cash-on-Cash Return
4.0%
Cap rate
0.7%
Rent to Value Ratio
Active
$110,000
2
bds
|
0
ba
|
700
sqft
|
built
1979
2110 Wilcrest Dr, Houston, TX 77042
$-290
Cash flow
-13.8%
Cash-on-Cash Return
2.5%
Cap rate
1.0%
Rent to Value Ratio
Active
$299,999
3
bds
|
0
ba
|
1,816
sqft
|
built
1979
15019 Tinker St, Houston, TX 77084
$-537
Cash flow
-9.3%
Cash-on-Cash Return
3.5%
Cap rate
0.7%
Rent to Value Ratio

Active
$235,000
3
bds
|
0
ba
|
1,499
sqft
|
built
1975
11810 Crystalwood Dr, Houston, TX 77013
$-254
Cash flow
-5.6%
Cash-on-Cash Return
4.4%
Cap rate
0.7%
Rent to Value Ratio
Active
$179,900
3
bds
|
0
ba
|
1,056
sqft
|
built
1954
3322 Mc Crarey Dr, Houston, TX 77088
$-13
Cash flow
-0.4%
Cash-on-Cash Return
5.6%
Cap rate
0.9%
Rent to Value Ratio
Active
$284,900
3
bds
|
0
ba
|
1,707
sqft
|
built
2018
14726 Meadow Acre Trl, Houston, TX 77049
$-675
Cash flow
-12.4%
Cash-on-Cash Return
2.8%
Cap rate
0.7%
Rent to Value Ratio
Active
$259,000
3
bds
|
0
ba
|
1,752
sqft
|
built
1980
11902 S Fairhollow Ln, Houston, TX 77043
$-188
Cash flow
-3.8%
Cash-on-Cash Return
4.8%
Cap rate
0.8%
Rent to Value Ratio
Active
$295,000
3
bds
|
0
ba
|
1,762
sqft
|
built
1979
16303 Hollow Rock Dr, Houston, TX 77070
$-503
Cash flow
-8.9%
Cash-on-Cash Return
3.6%
Cap rate
0.6%
Rent to Value Ratio
Active
$290,000
4
bds
|
0
ba
|
1,903
sqft
|
built
2021
4354 Tulip Oak Dr, Houston, TX 77068
$182
Cash flow
3.3%
Cash-on-Cash Return
6.4%
Cap rate
0.8%
Rent to Value Ratio