Houston, TX Investment Properties for Sale
Browse homes for sale and investment properties in Houston, TX. Refine your search by price, property type, or more.
Best cash flowing properties in Houston, TX
Active
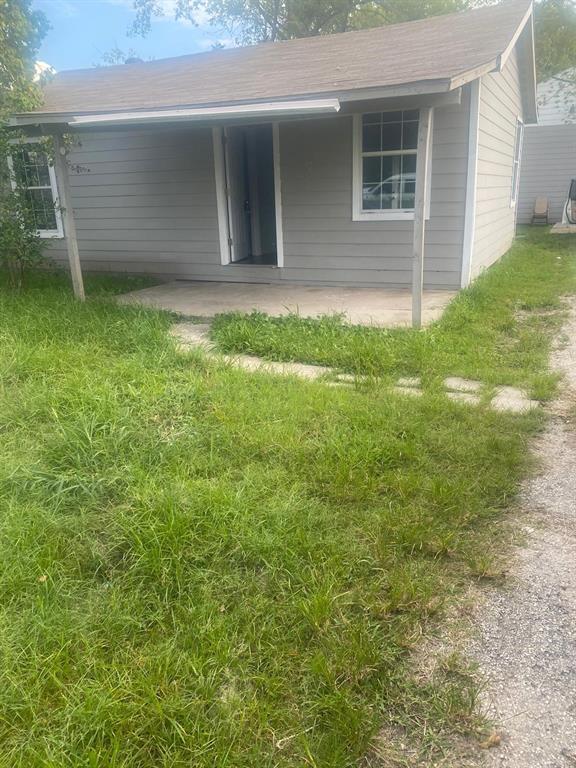
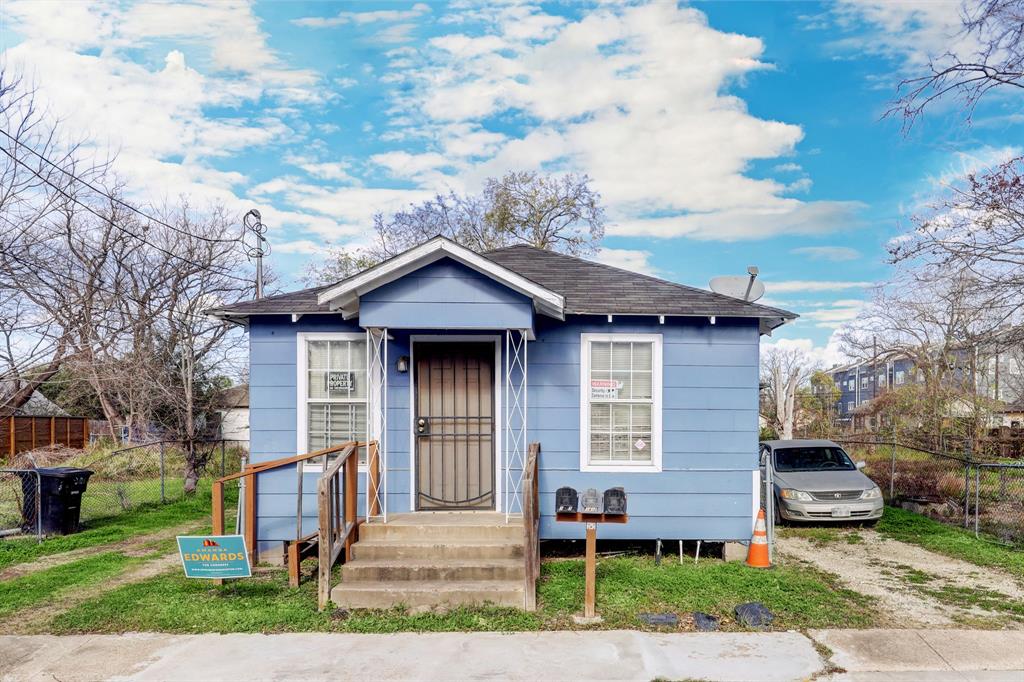
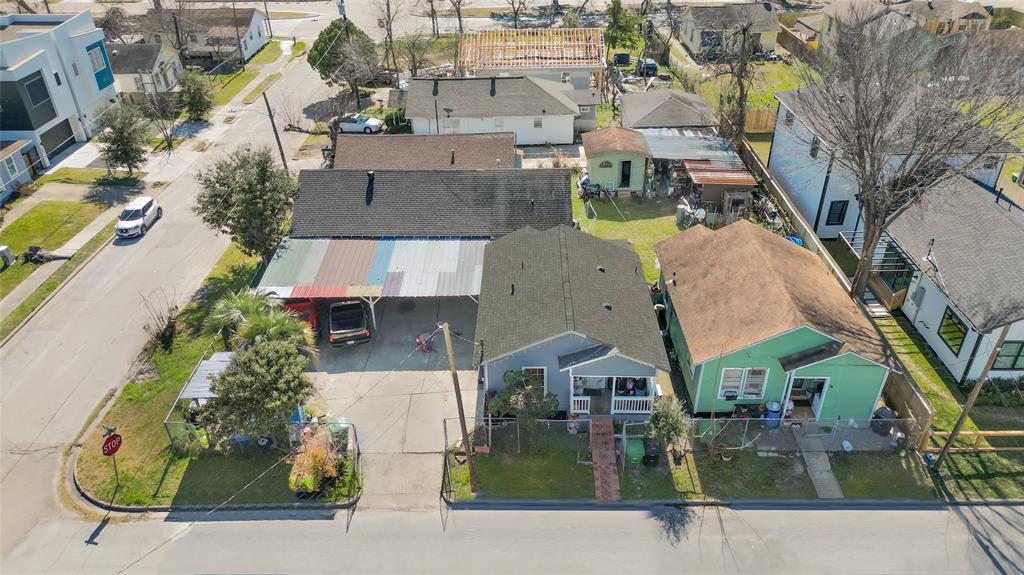
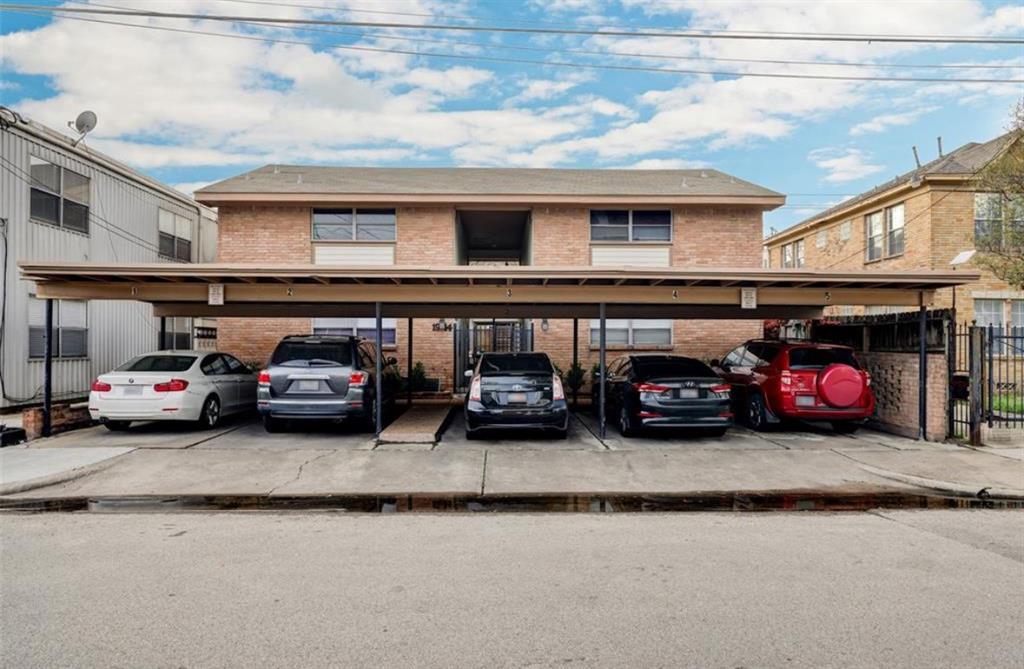
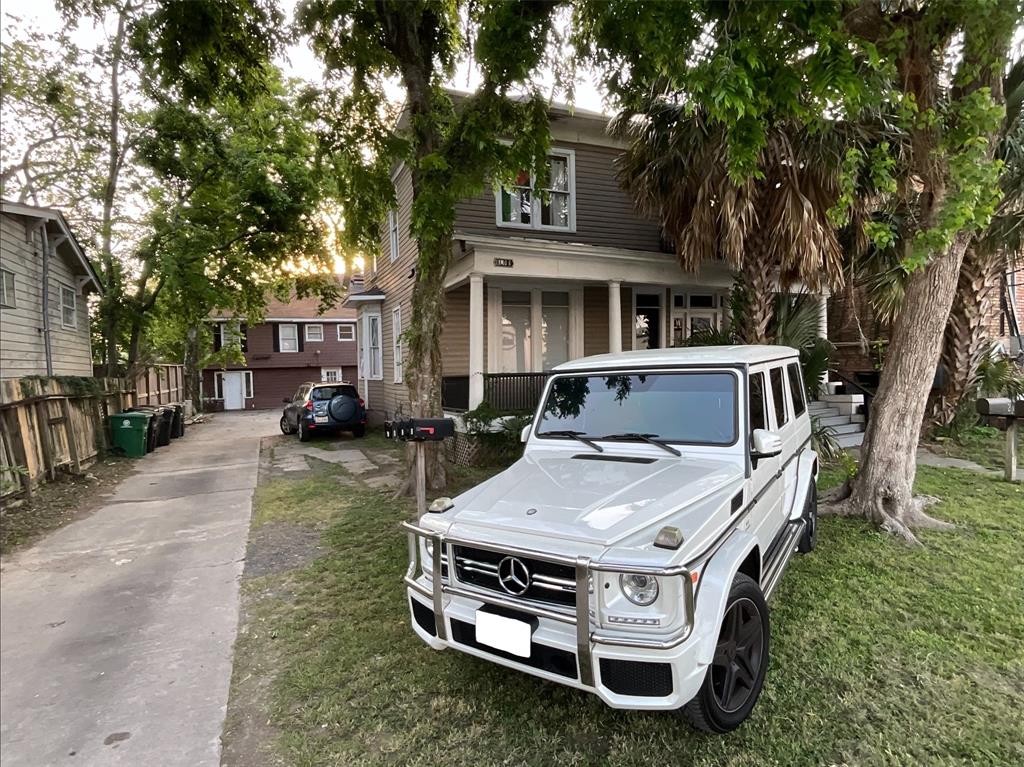
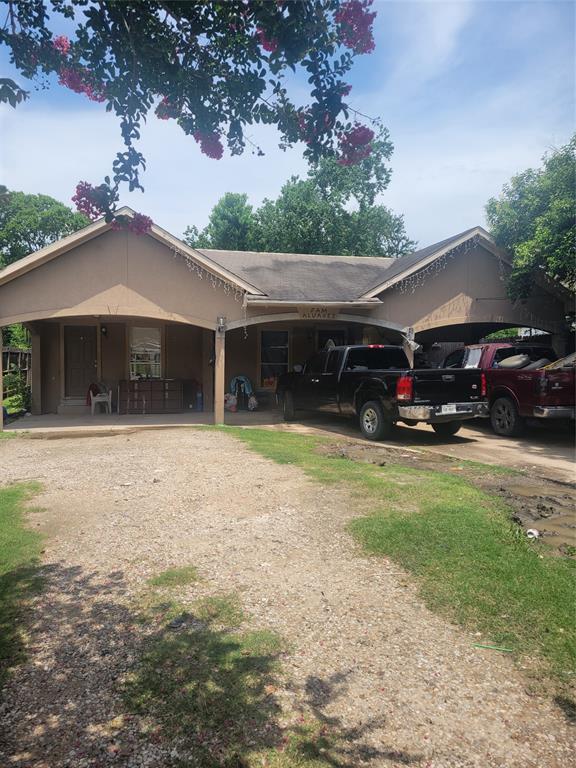
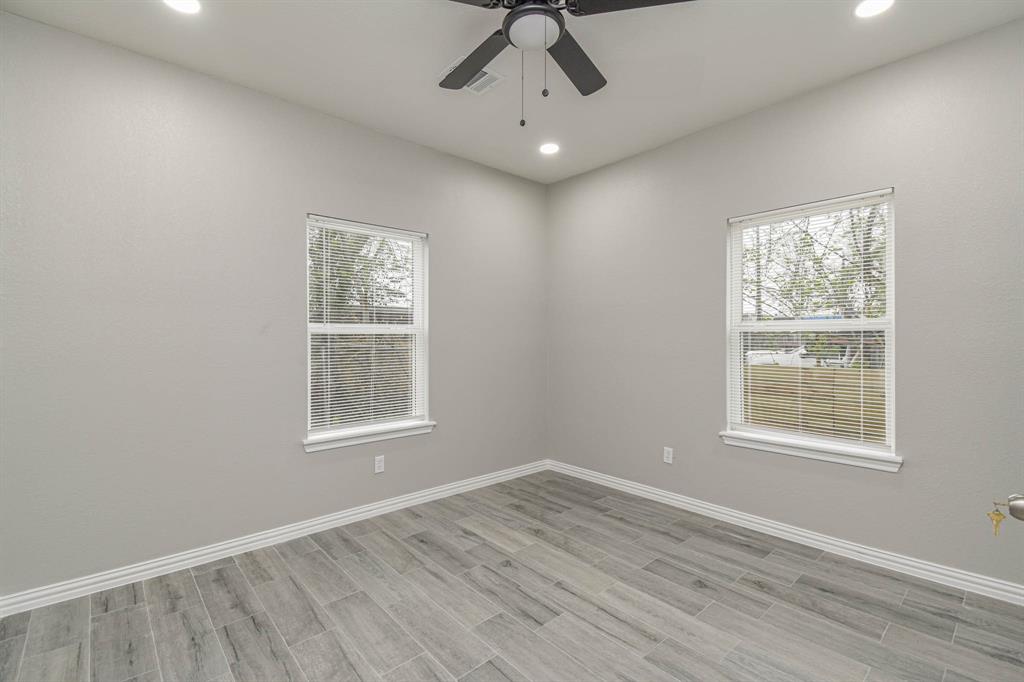
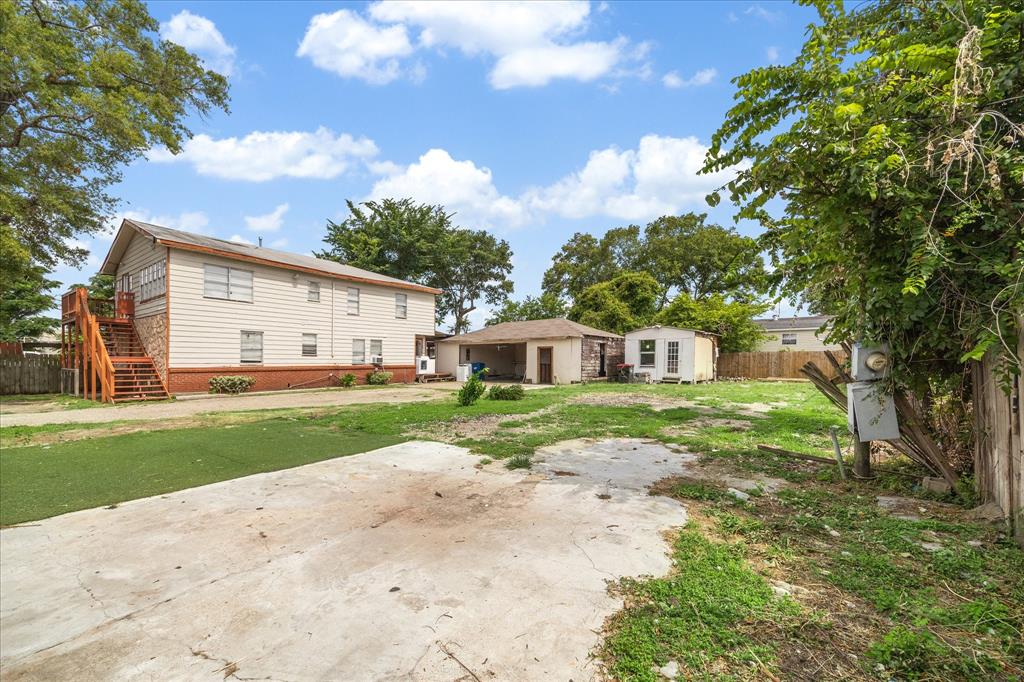
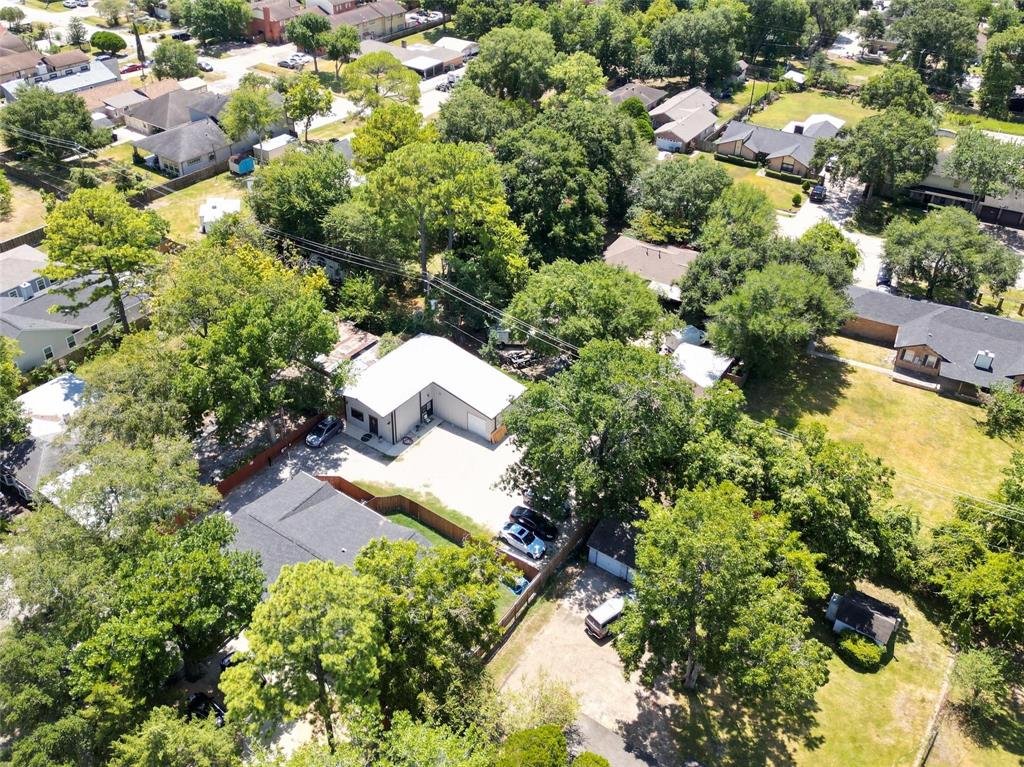
$182,000
3
bds
|
0
ba
|
1,137
sqft
|
built
1945
2152 William Tell St, Houston, TX 77093
$298
Cash flow
8.5%
Cash-on-Cash Return
7.6%
Cap rate
1.1%
Rent to Value Ratio
Active
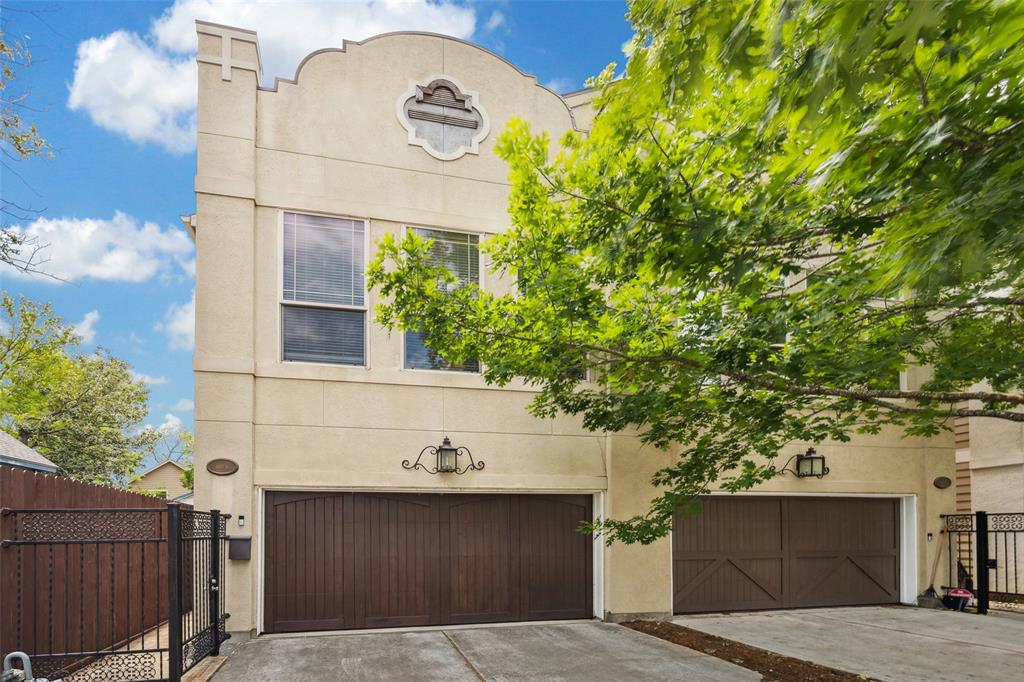
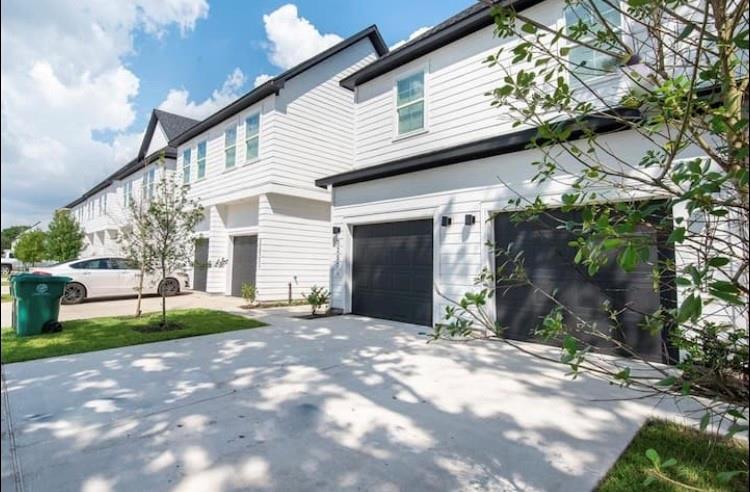
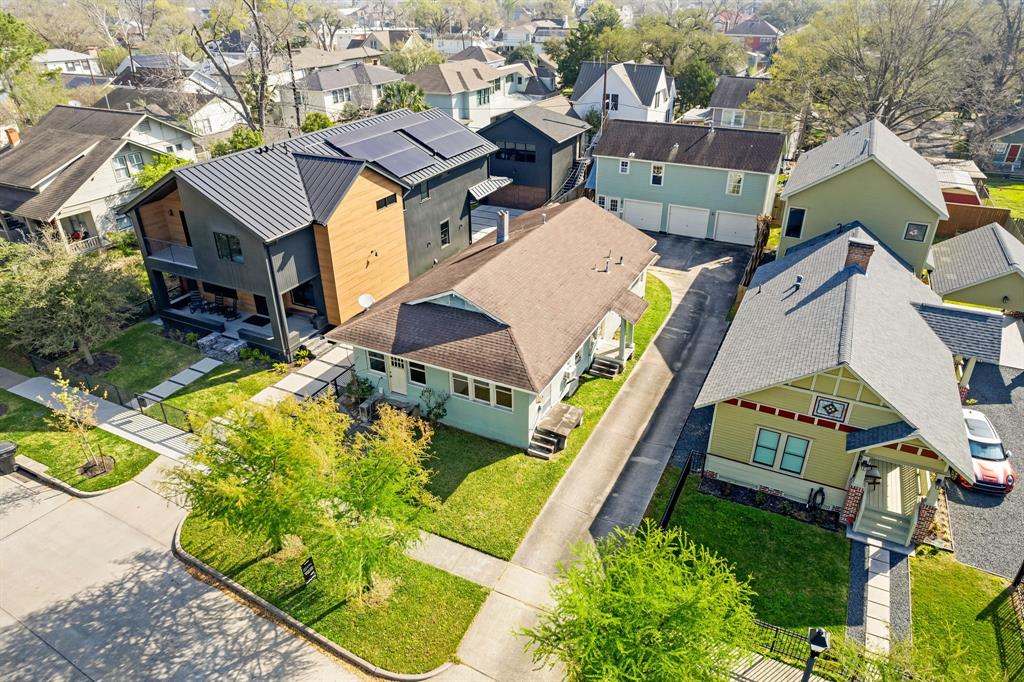
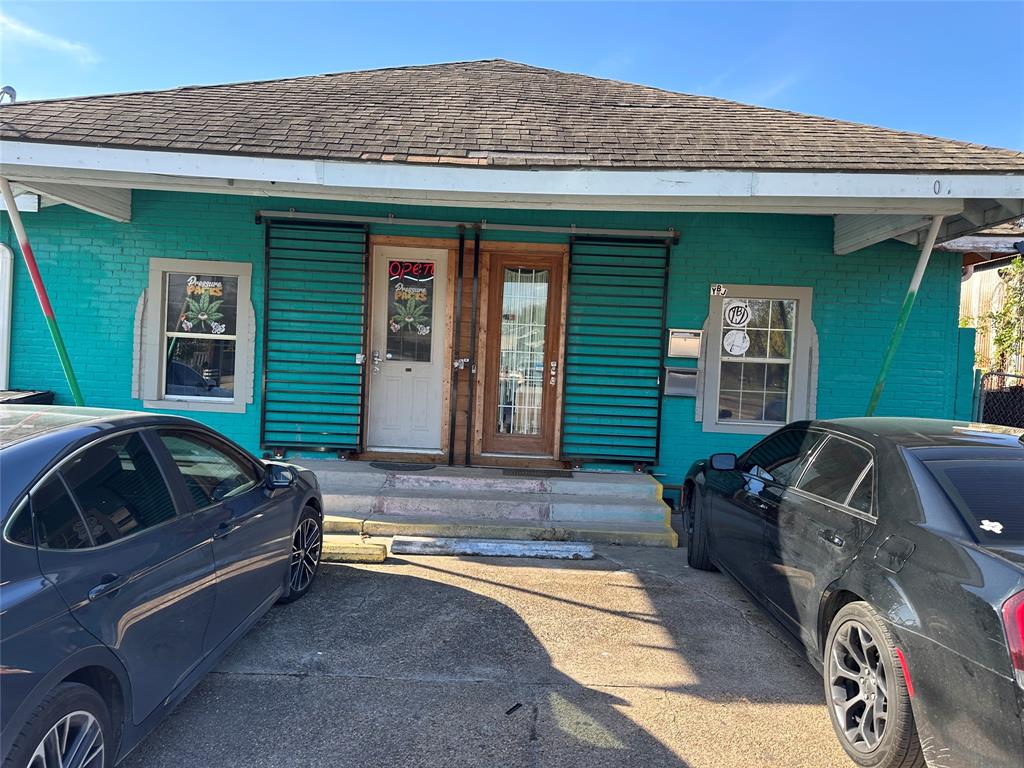
$474,900
3
bds
|
0
ba
|
1,720
sqft
|
built
2009
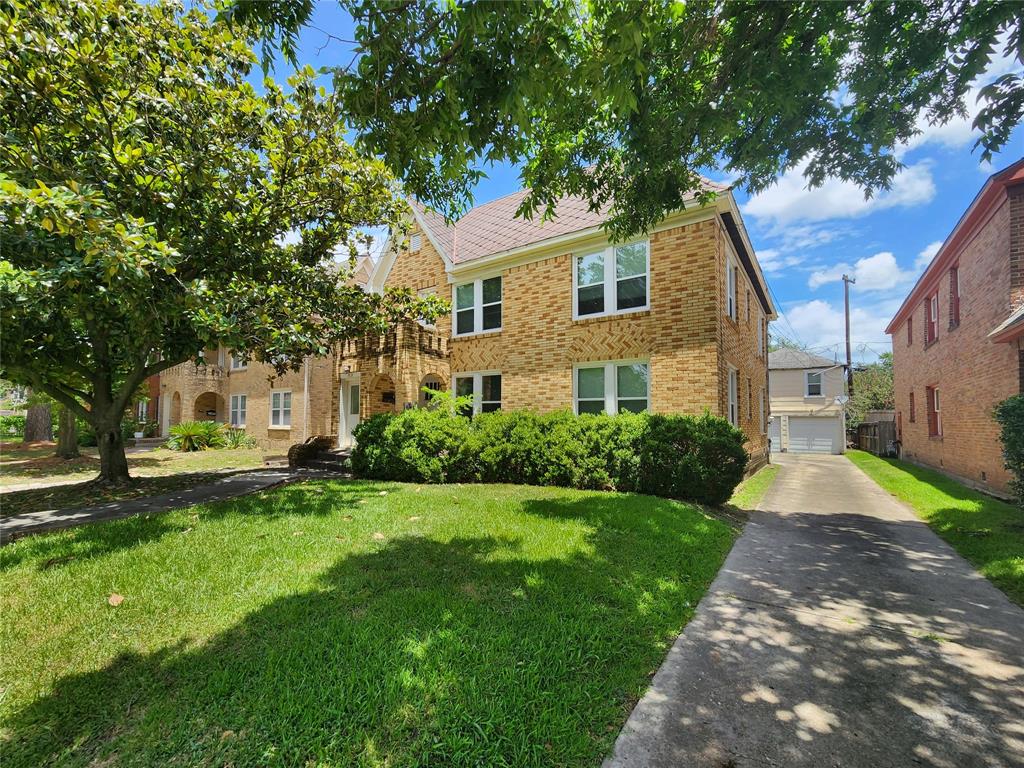
1027 Kern St, Houston, TX 77009
$-108
Cash flow
-1.2%
Cash-on-Cash Return
5.4%
Cap rate
0.7%
Rent to Value Ratio
357 out of 437 properties for sale in Houston, TX
Limited Results Shown
Create a free account, or log in to reveal all property listings and enjoy the complete experience.
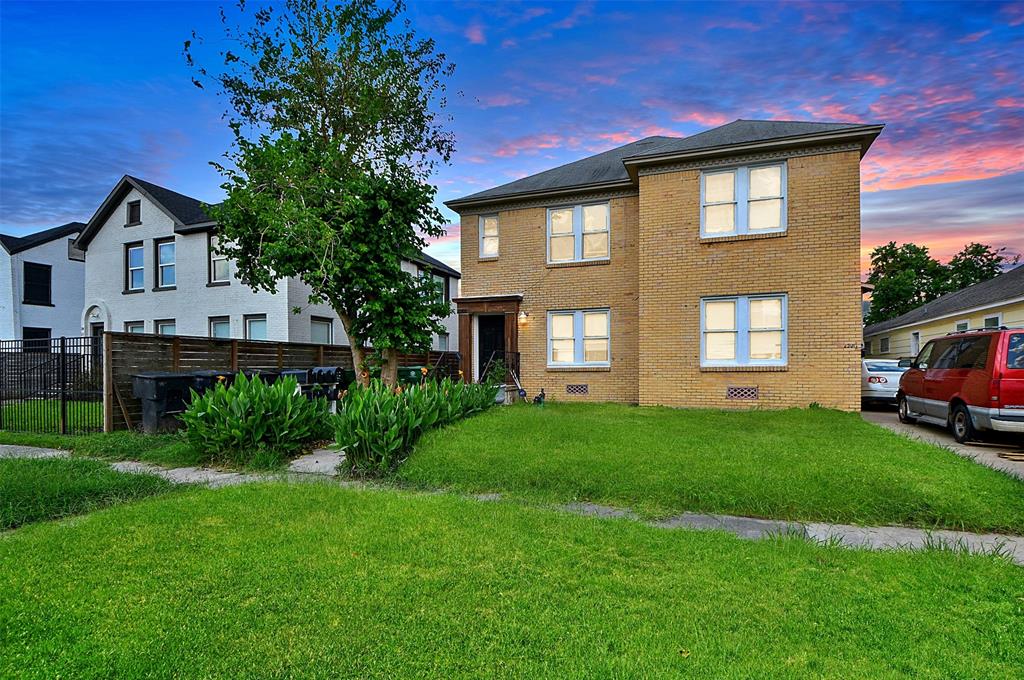
Active
$785,000
2
bds
|
0
ba
|
4,464
sqft
|
built
1930
2501 Truxillo St, Houston, TX 77004
$-2,107
Cash flow
-14.0%
Cash-on-Cash Return
2.5%
Cap rate
0.4%
Rent to Value Ratio
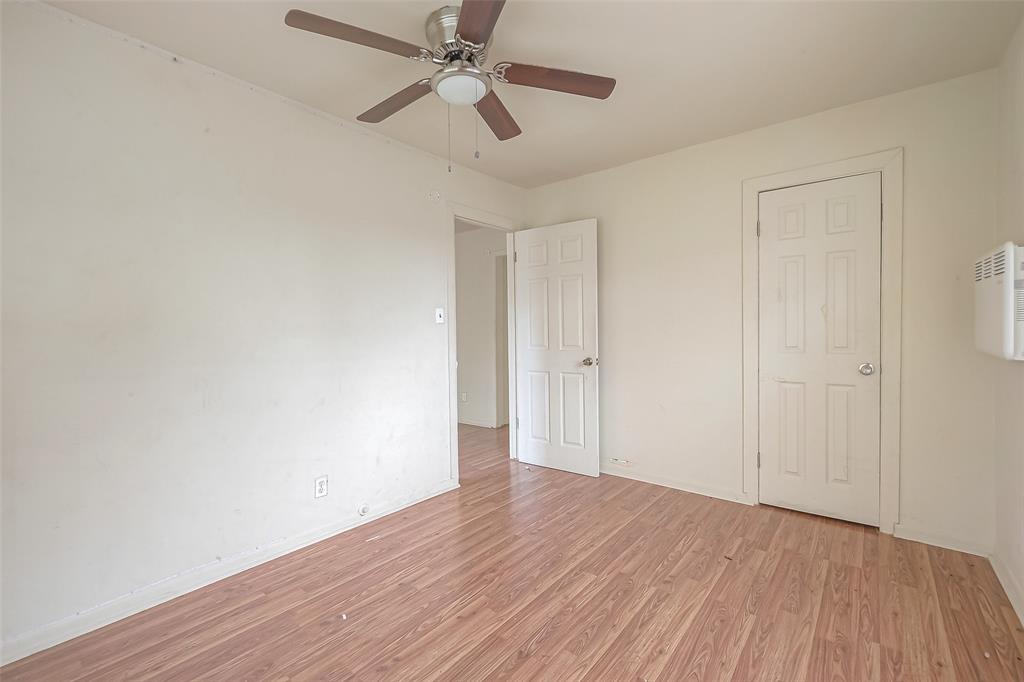
Active
$600,000
2
bds
|
0
ba
|
2,726
sqft
|
built
1946
3607 Anita St, Houston, TX 77004
$-2,140
Cash flow
-18.6%
Cash-on-Cash Return
1.4%
Cap rate
0.3%
Rent to Value Ratio
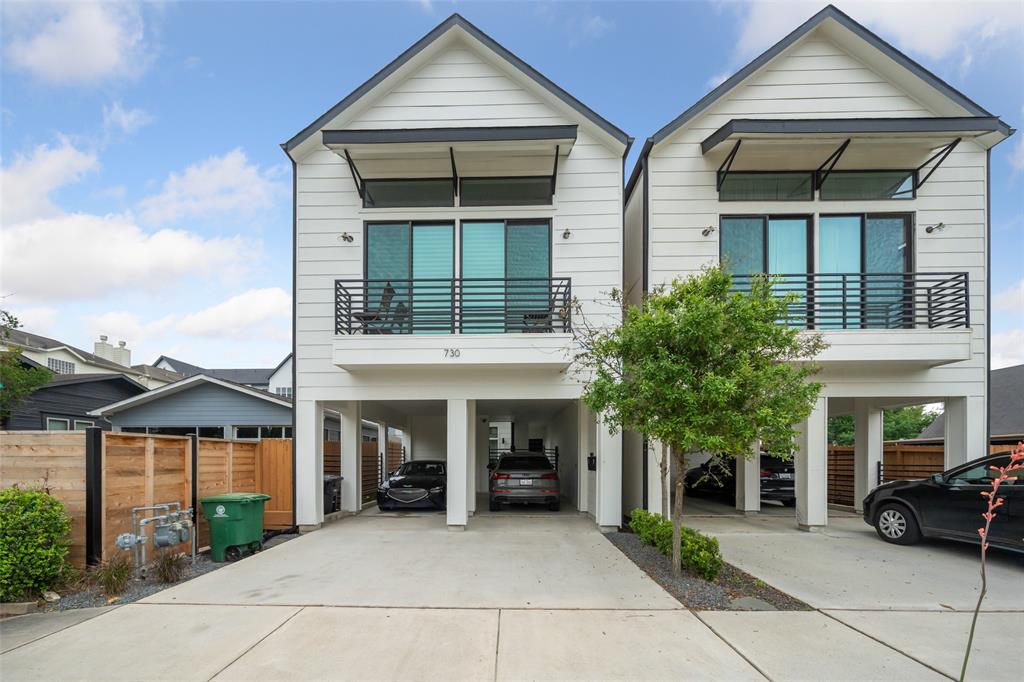
Active
$820,000
4
bds
|
0
ba
|
2,770
sqft
|
built
2018
730 W 22nd St, Houston, TX 77008
$-2,337
Cash flow
-14.9%
Cash-on-Cash Return
2.3%
Cap rate
0.5%
Rent to Value Ratio
Active
$229,000
4
bds
|
0
ba
|
2,173
sqft
|
built
1968
538 Glenvale Dr, Houston, TX 77060
$-128
Cash flow
-2.9%
Cash-on-Cash Return
5.0%
Cap rate
0.8%
Rent to Value Ratio
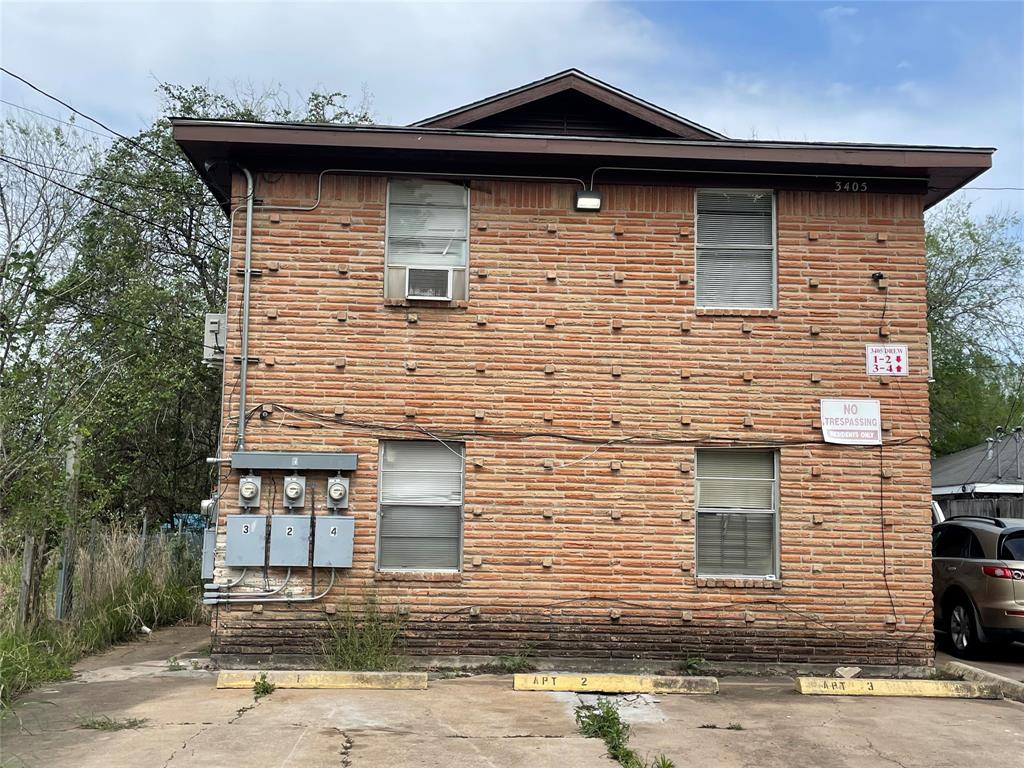
Active
$490,000
2
bds
|
0
ba
|
3,248
sqft
|
built
1964
3405 Drew St, Houston, TX 77004
$-2,256
Cash flow
-24.0%
Cash-on-Cash Return
0.2%
Cap rate
0.2%
Rent to Value Ratio
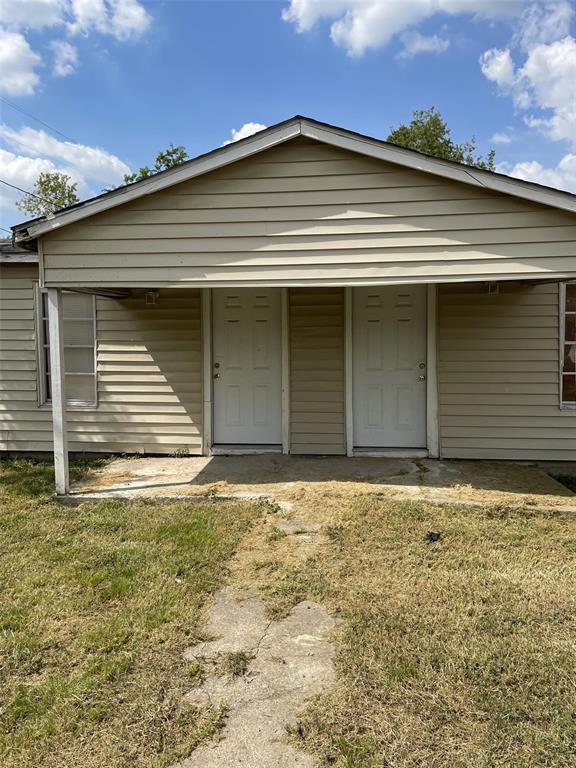
Active
$220,000
4
bds
|
0
ba
|
1,664
sqft
|
built
1945
301 Connecticut St, Houston, TX 77029
$-483
Cash flow
-11.5%
Cash-on-Cash Return
3.0%
Cap rate
0.5%
Rent to Value Ratio
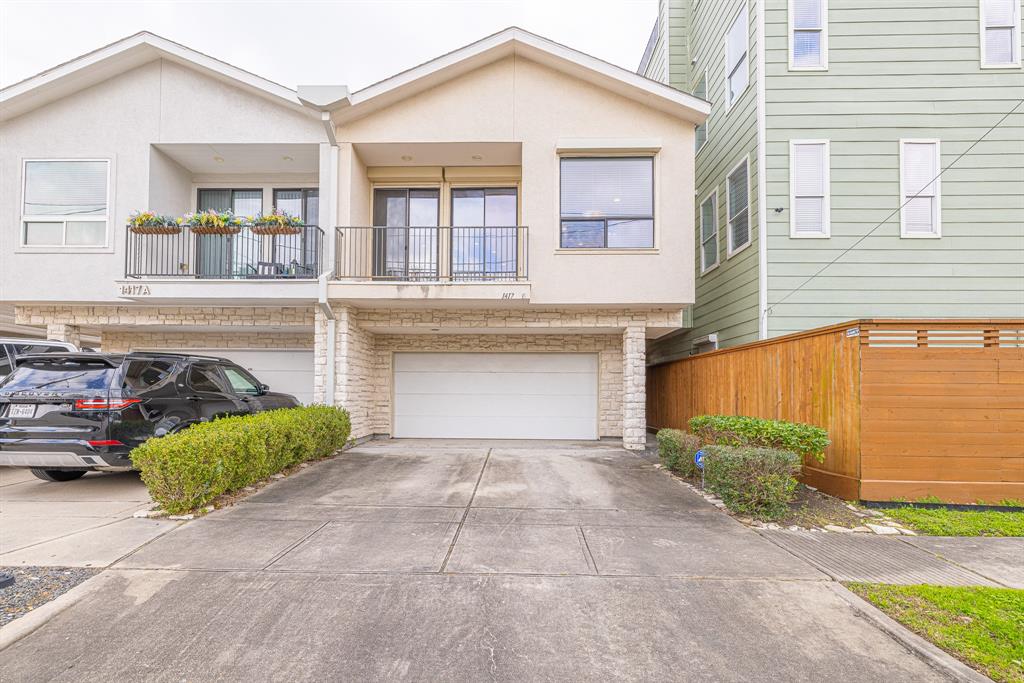
Active
$360,000
3
bds
|
0
ba
|
2,262
sqft
|
built
2005
1417 Live Oak St, Houston, TX 77003
$-562
Cash flow
-8.1%
Cash-on-Cash Return
3.8%
Cap rate
0.8%
Rent to Value Ratio
Active
$575,000
1
bds
|
0
ba
|
2,604
sqft
|
built
1955
2711 Ruth St, Houston, TX 77004
$-1,755
Cash flow
-15.9%
Cash-on-Cash Return
2.0%
Cap rate
0.2%
Rent to Value Ratio

Active
$320,000
4
bds
|
0
ba
|
2,595
sqft
|
built
2022
12518 Pelican Bay Dr, Houston, TX 77038
$-530
Cash flow
-8.6%
Cash-on-Cash Return
3.7%
Cap rate
0.8%
Rent to Value Ratio
Active
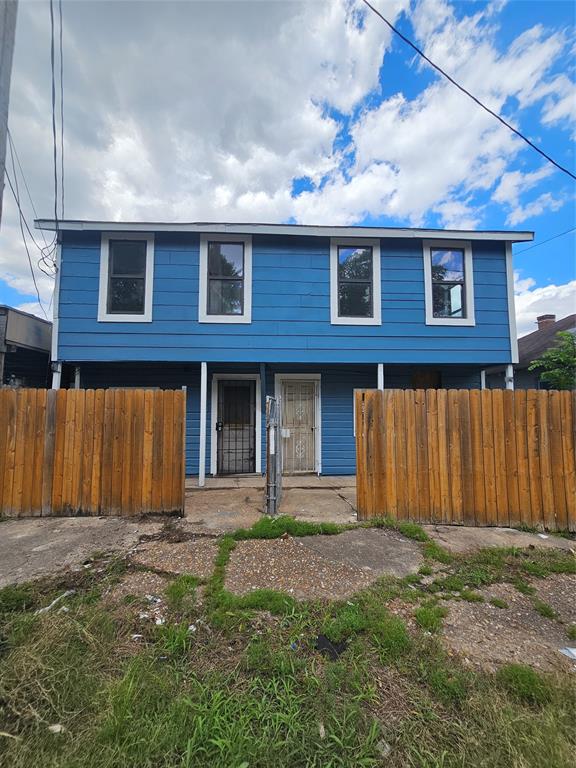
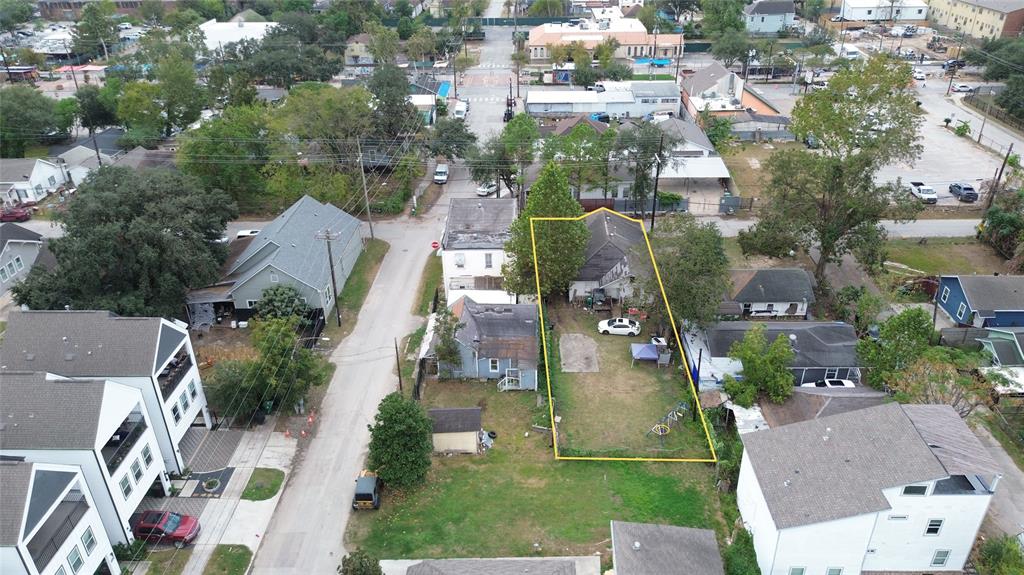
$182,000
3
bds
|
0
ba
|
1,137
sqft
|
built
1945
2152 William Tell St, Houston, TX 77093
$298
Cash flow
8.5%
Cash-on-Cash Return
7.6%
Cap rate
1.1%
Rent to Value Ratio
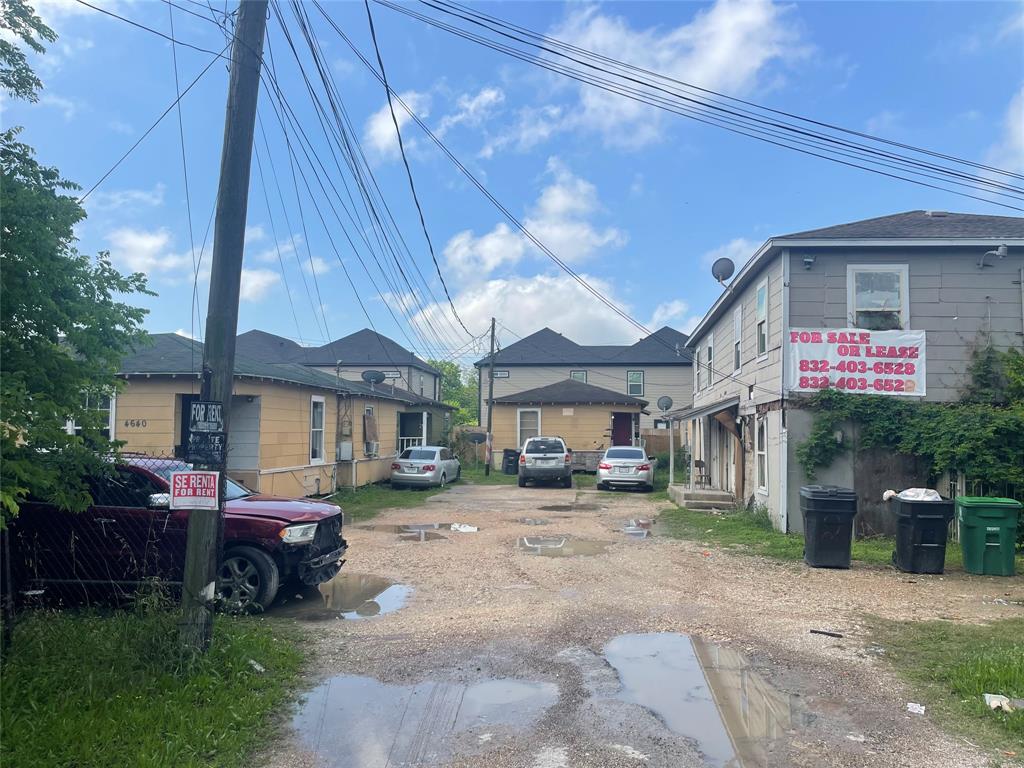
Active
$550,000
5
bds
|
0
ba
|
3,880
sqft
|
built
1940
3810 Hurley St, Houston, TX 77093
$-2,164
Cash flow
-20.5%
Cash-on-Cash Return
1.0%
Cap rate
0.2%
Rent to Value Ratio
Active
$620,000
2
bds
|
0
ba
|
1,956
sqft
|
built
1940
606 Enid St, Houston, TX 77009
$-2,799
Cash flow
-23.6%
Cash-on-Cash Return
0.3%
Cap rate
0.2%
Rent to Value Ratio
Active
$345,000
4
bds
|
0
ba
|
1,550
sqft
|
built
1938
3229 Holman St, Houston, TX 77004
$-1,603
Cash flow
-24.2%
Cash-on-Cash Return
0.1%
Cap rate
0.2%
Rent to Value Ratio
Active
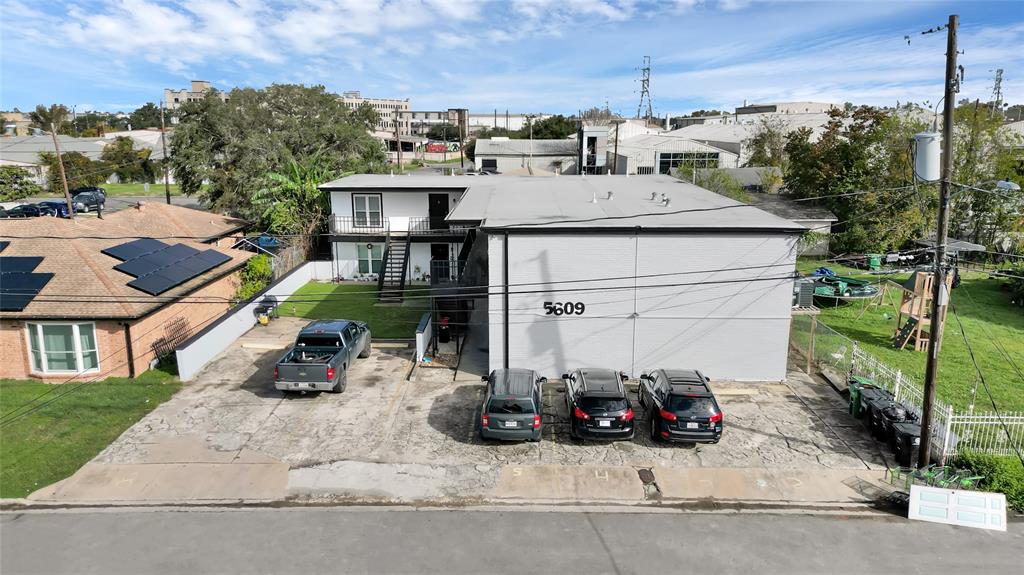
$799,999
bds
|
0
ba
|
6,428
sqft
|
built
1950
5609 Leeland St, Houston, TX 77023
$-3,594
Cash flow
-23.4%
Cash-on-Cash Return
0.3%
Cap rate
0.2%
Rent to Value Ratio
Active
$329,000
2
bds
|
0
ba
|
1,600
sqft
|
built
1937
4014 Hardy St, Houston, TX 77009
$-483
Cash flow
-7.7%
Cash-on-Cash Return
3.9%
Cap rate
0.7%
Rent to Value Ratio
Active
$380,000
2
bds
|
0
ba
|
1,689
sqft
|
built
1948
7909 Goode St, Houston, TX 77012
$-885
Cash flow
-12.2%
Cash-on-Cash Return
2.9%
Cap rate
0.5%
Rent to Value Ratio
Active
$900,000
2
bds
|
0
ba
|
6,915
sqft
|
built
1980
12955 Woodforest Blvd, Houston, TX 77015
$-7,799
Cash flow
-45.2%
Cash-on-Cash Return
-4.7%
Cap rate
0.1%
Rent to Value Ratio
Active
$399,900
3
bds
|
0
ba
|
2,300
sqft
|
built
2020
5911 Westover St, Houston, TX 77033
$-1,206
Cash flow
-15.7%
Cash-on-Cash Return
2.1%
Cap rate
0.5%
Rent to Value Ratio

Active
$1,100,000
10
bds
|
0
ba
|
4,748
sqft
|
built
1900
1015 Brooks St, Houston, TX 77009
$-1,693
Cash flow
-8.0%
Cash-on-Cash Return
3.8%
Cap rate
0.6%
Rent to Value Ratio
Active
$427,000
2
bds
|
0
ba
|
2,396
sqft
|
built
1961
11202 Waxwing St, Houston, TX 77035
$-1,437
Cash flow
-17.6%
Cash-on-Cash Return
1.6%
Cap rate
0.4%
Rent to Value Ratio
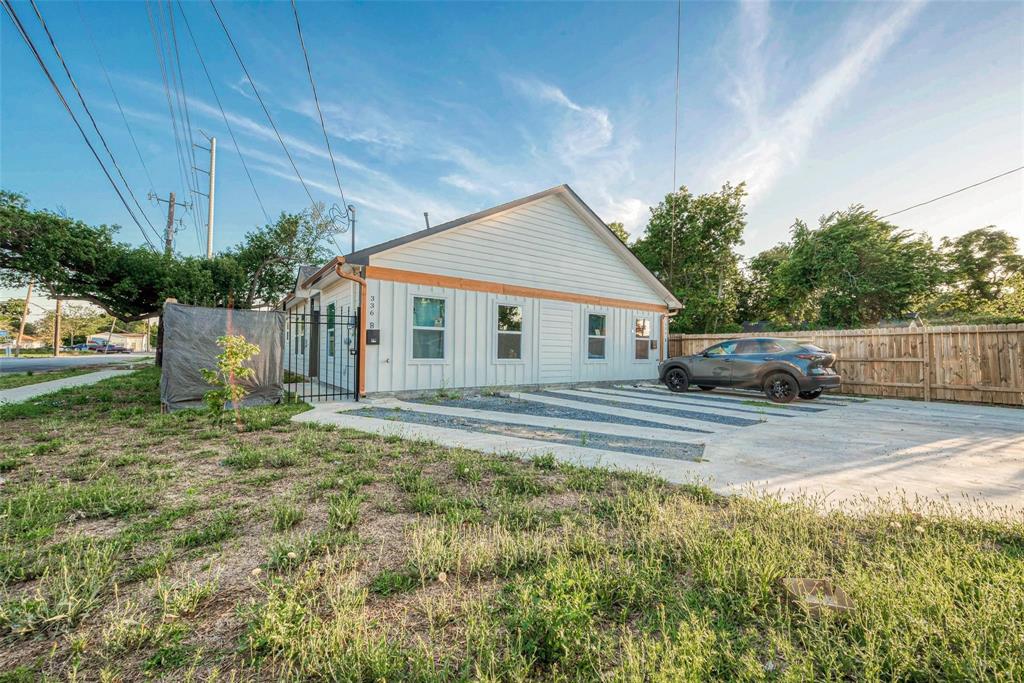
Active
$349,990
3
bds
|
0
ba
|
2,402
sqft
|
built
2022
336 De Haven St, Houston, TX 77029
$-1,031
Cash flow
-15.4%
Cash-on-Cash Return
2.1%
Cap rate
0.5%
Rent to Value Ratio
Active
$545,750
3
bds
|
0
ba
|
3,221
sqft
|
built
2022
3231 Real St, Houston, TX 77087
$-1,906
Cash flow
-18.2%
Cash-on-Cash Return
1.5%
Cap rate
0.4%
Rent to Value Ratio
Active under contract
$689,990
4
bds
|
0
ba
|
1,508
sqft
|
built
1920
824 Cortlandt St, Houston, TX 77007
$-3,008
Cash flow
-22.7%
Cash-on-Cash Return
0.4%
Cap rate
0.4%
Rent to Value Ratio
Active
$319,999
2
bds
|
0
ba
|
720
sqft
|
built
1930
3417 Bremond St, Houston, TX 77004
$-1,197
Cash flow
-19.5%
Cash-on-Cash Return
1.2%
Cap rate
0.3%
Rent to Value Ratio
Active
$400,000
4
bds
|
0
ba
|
540
sqft
|
built
1945
1414 Moody St, Houston, TX 77009
$-1,304
Cash flow
-17.0%
Cash-on-Cash Return
1.8%
Cap rate
0.3%
Rent to Value Ratio
Active
$1,595,000
bds
|
0
ba
|
1,280
sqft
|
built
1959
1914 Mc Duffie St, Houston, TX 77019
$-9,047
Cash flow
-29.6%
Cash-on-Cash Return
-1.1%
Cap rate
0.1%
Rent to Value Ratio
Active
$499,999
2
bds
|
0
ba
|
584
sqft
|
built
1945
4638 Sunflower St, Houston, TX 77051
$-1,927
Cash flow
-20.1%
Cash-on-Cash Return
1.1%
Cap rate
0.2%
Rent to Value Ratio
Active
$500,000
4
bds
|
0
ba
|
4,032
sqft
|
built
1946
4831 Gulf Fwy, Houston, TX 77023
$-2,233
Cash flow
-23.3%
Cash-on-Cash Return
0.3%
Cap rate
0.2%
Rent to Value Ratio
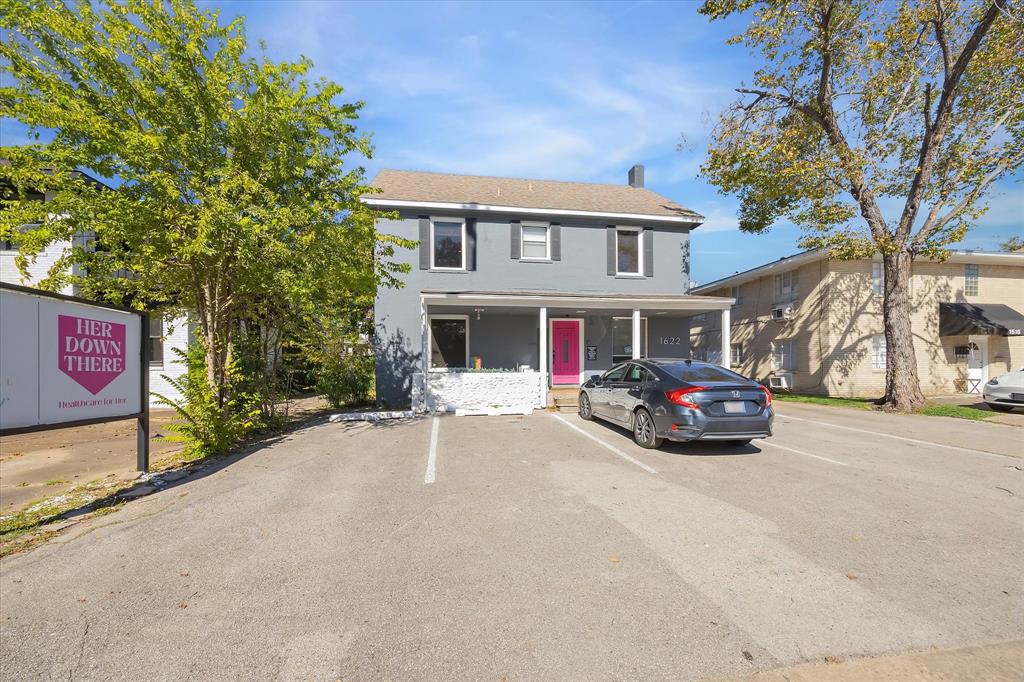
Active
$925,000
3
bds
|
0
ba
|
2,154
sqft
|
built
1920
1622 W Alabama St, Houston, TX 77006
$-3,612
Cash flow
-20.4%
Cash-on-Cash Return
1.0%
Cap rate
0.3%
Rent to Value Ratio
Active
$1,625,000
2
bds
|
0
ba
|
2,312
sqft
|
built
1939
2518 Grant St, Houston, TX 77006
$-8,468
Cash flow
-27.2%
Cash-on-Cash Return
-0.6%
Cap rate
0.1%
Rent to Value Ratio
Active
$299,000
3
bds
|
0
ba
|
1,314
sqft
|
built
1930
2515 Engelke St, Houston, TX 77003
$-519
Cash flow
-9.1%
Cash-on-Cash Return
3.6%
Cap rate
0.7%
Rent to Value Ratio
Active
$325,000
bds
|
0
ba
|
1,885
sqft
|
built
1935
304 S Lockwood Dr, Houston, TX 77011
$-618
Cash flow
-9.9%
Cash-on-Cash Return
3.4%
Cap rate
0.8%
Rent to Value Ratio
Active
$230,000
4
bds
|
0
ba
|
1,442
sqft
|
built
1986
5130 Beaverhollow Dr, Houston, TX 77084
$-246
Cash flow
-5.6%
Cash-on-Cash Return
4.4%
Cap rate
0.8%
Rent to Value Ratio
Active
$220,000
4
bds
|
0
ba
|
1,280
sqft
|
built
1955
14619 Caradine St, Houston, TX 77085
$-482
Cash flow
-11.4%
Cash-on-Cash Return
3.0%
Cap rate
0.5%
Rent to Value Ratio
Active
$420,000
3
bds
|
0
ba
|
1,600
sqft
|
built
1955
3709 Gager St, Houston, TX 77093
$-1,151
Cash flow
-14.3%
Cash-on-Cash Return
2.4%
Cap rate
0.4%
Rent to Value Ratio
Active
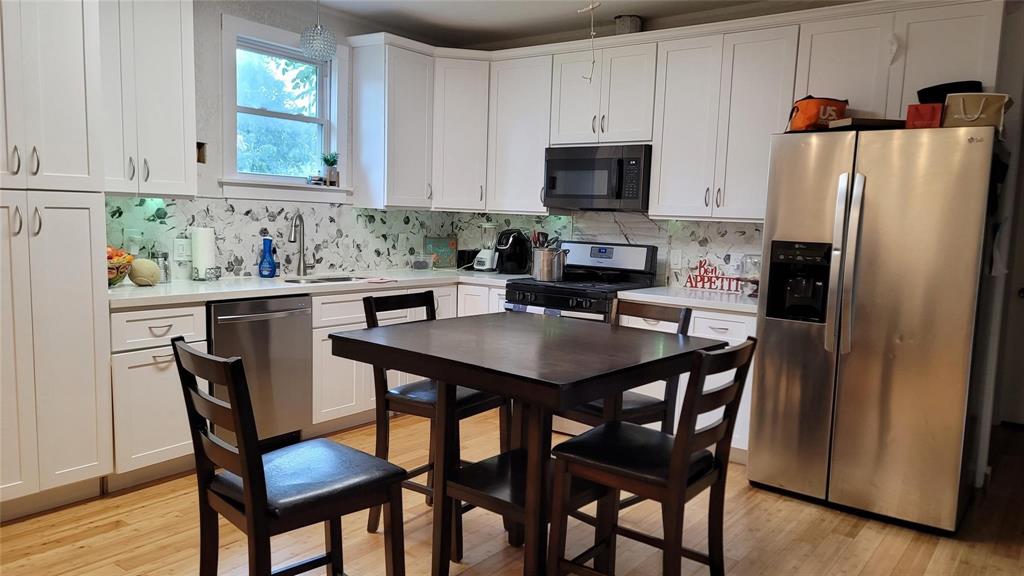
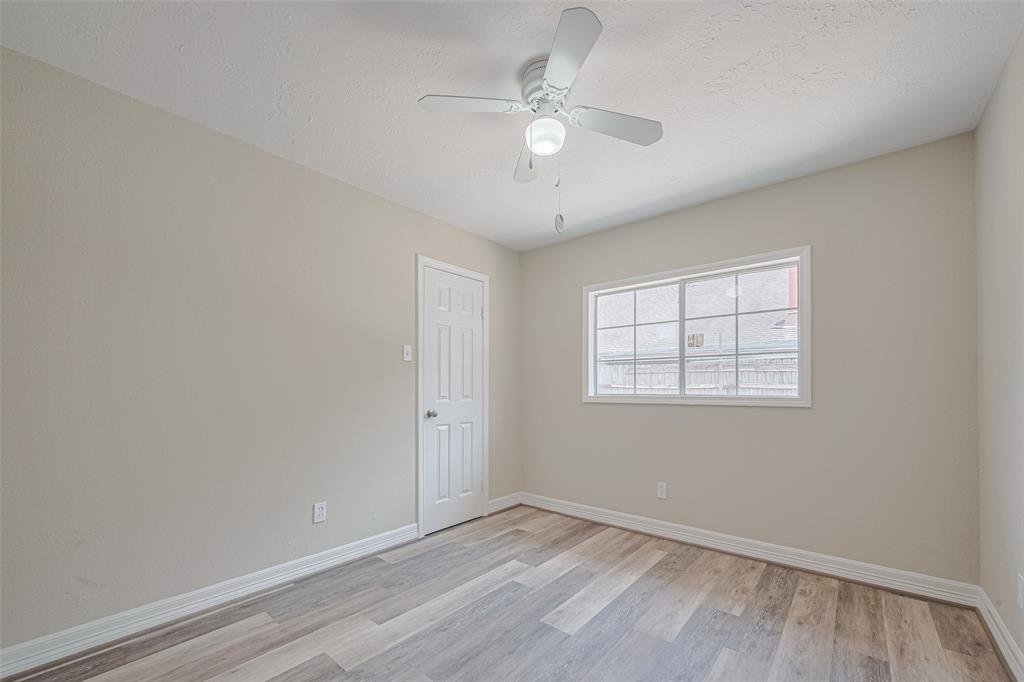
$474,900
3
bds
|
0
ba
|
1,720
sqft
|
built
2009
1027 Kern St, Houston, TX 77009
$-108
Cash flow
-1.2%
Cash-on-Cash Return
5.4%
Cap rate
0.7%
Rent to Value Ratio
Active
$175,000
2
bds
|
0
ba
|
2,346
sqft
|
built
1960
13929 Eagle Pass St, Houston, TX 77015
$-263
Cash flow
-7.8%
Cash-on-Cash Return
3.9%
Cap rate
0.8%
Rent to Value Ratio
Active
$600,000
2
bds
|
0
ba
|
5,169
sqft
|
built
1958
9305 Emnora Ln, Houston, TX 77080
$-2,360
Cash flow
-20.5%
Cash-on-Cash Return
1.0%
Cap rate
0.3%
Rent to Value Ratio
Active
$725,000
2
bds
|
0
ba
|
2,590
sqft
|
built
1930
1634 Castle Ct, Houston, TX 77006
$-3,213
Cash flow
-23.1%
Cash-on-Cash Return
0.4%
Cap rate
0.2%
Rent to Value Ratio
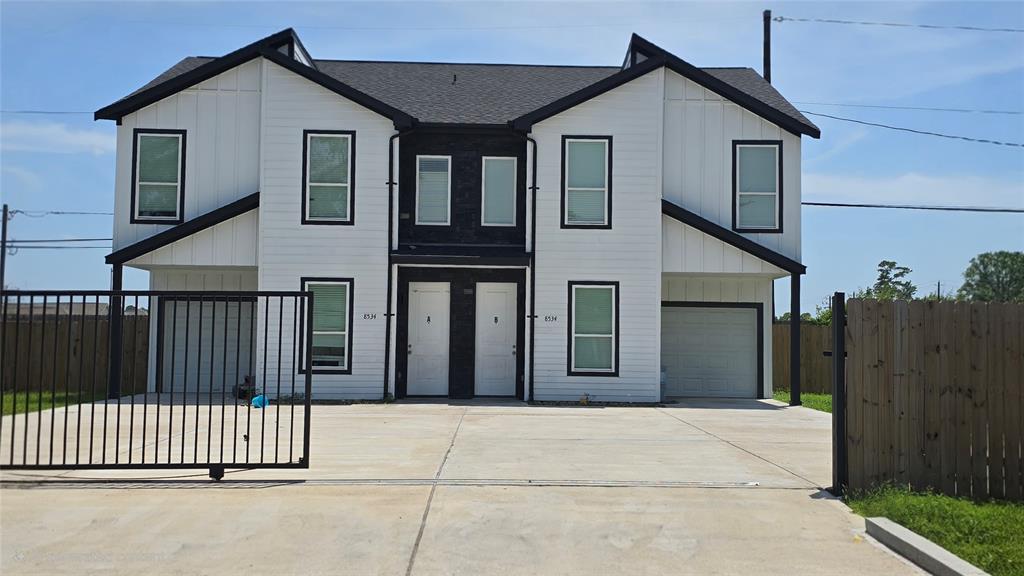
Active
$425,000
3
bds
|
0
ba
|
3,230
sqft
|
built
2021
8534 Woodlyn Rd, Houston, TX 77028
$-1,345
Cash flow
-16.5%
Cash-on-Cash Return
1.9%
Cap rate
0.5%
Rent to Value Ratio