Houston, TX Investment Properties for Sale
Browse homes for sale and investment properties in Houston, TX. Refine your search by price, property type, or more.
Best cash flowing properties in Houston, TX
Active
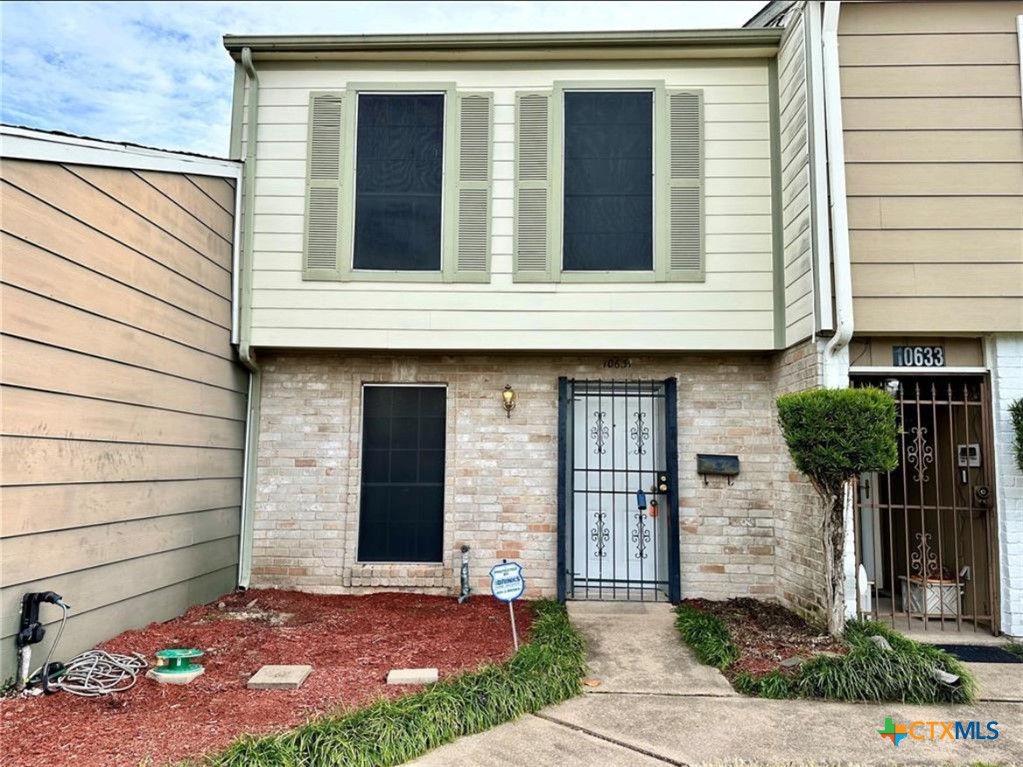
$190,000
2
bds
|
3
ba
|
1,728
sqft
|
built
1973
10631 Sandpiper Dr, Houston, TX 77096
$481
Cash flow
13.2%
Cash-on-Cash Return
8.7%
Cap rate
1.1%
Rent to Value Ratio

Active
$61,000
2
bds
|
0
ba
|
1,254
sqft
|
built
1972
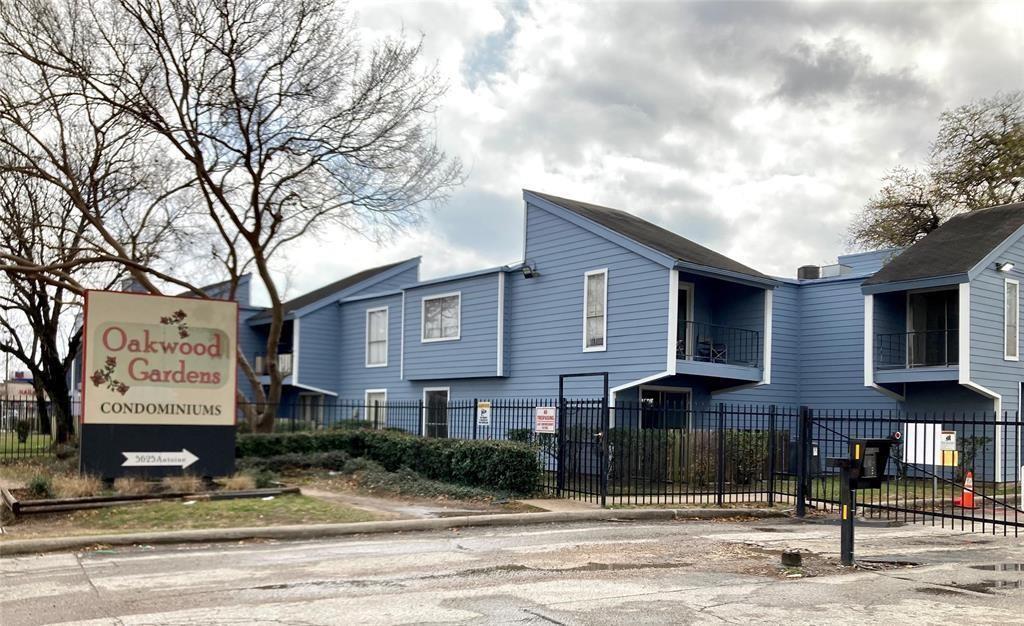
5625 Antoine Dr, Houston, TX 77091
$272
Cash flow
5.2%
Cash-on-Cash Return
5.4%
Cap rate
2.0%
Rent to Value Ratio
858 out of 977 properties for sale in Houston, TX
Limited Results Shown
Create a free account, or log in to reveal all property listings and enjoy the complete experience.
Active
$190,000
2
bds
|
3
ba
|
1,728
sqft
|
built
1973
10631 Sandpiper Dr, Houston, TX 77096
$481
Cash flow
13.2%
Cash-on-Cash Return
8.7%
Cap rate
1.1%
Rent to Value Ratio
Active
$58,000
2
bds
|
0
ba
|
1,052
sqft
|
built
1972
5625 Antoine Dr, Houston, TX 77091
$266
Cash flow
5.3%
Cash-on-Cash Return
5.5%
Cap rate
2.1%
Rent to Value Ratio
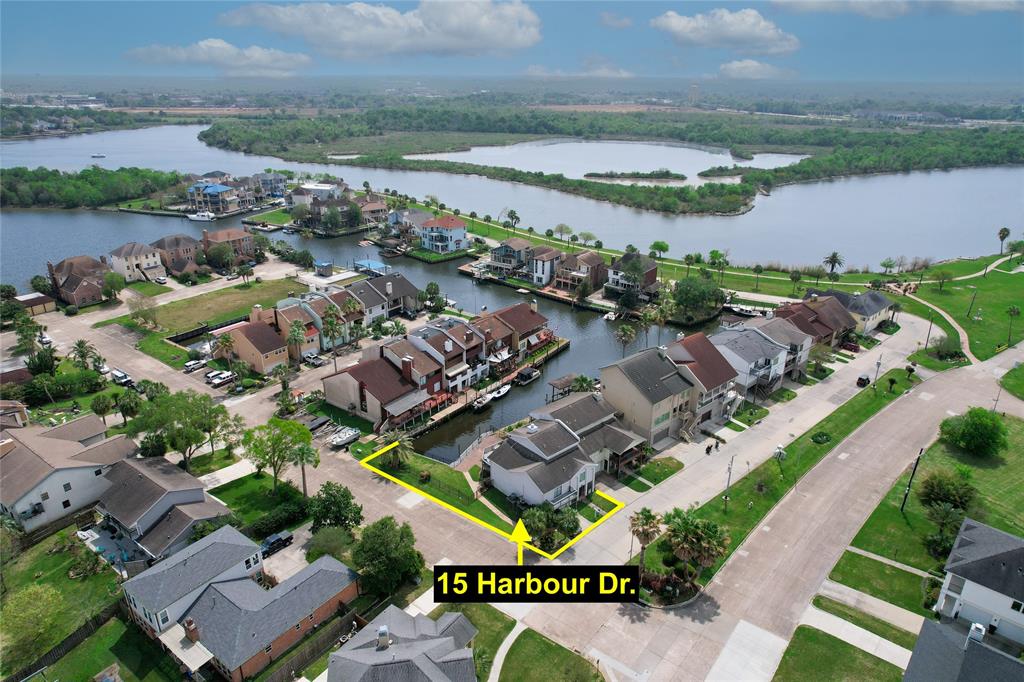
Active
$699,990
3
bds
|
0
ba
|
3,346
sqft
|
built
1981
15 Harbour Dr, Houston, TX 77058
$-1,790
Cash flow
-13.3%
Cash-on-Cash Return
2.6%
Cap rate
0.5%
Rent to Value Ratio
Active
$190,000
3
bds
|
0
ba
|
1,500
sqft
|
built
1977
12525 Wellington Park Dr, Houston, TX 77072
$-222
Cash flow
-6.1%
Cash-on-Cash Return
4.3%
Cap rate
0.9%
Rent to Value Ratio
Active
$110,000
2
bds
|
0
ba
|
1,340
sqft
|
built
1979
12331 W Village Dr, Houston, TX 77039
$183
Cash flow
8.7%
Cash-on-Cash Return
7.7%
Cap rate
1.3%
Rent to Value Ratio
Active
$135,000
1
bds
|
0
ba
|
818
sqft
|
built
1963
2727 Briarhurst Dr, Houston, TX 77057
$-331
Cash flow
-12.8%
Cash-on-Cash Return
2.7%
Cap rate
1.0%
Rent to Value Ratio
Active
$505,000
3
bds
|
0
ba
|
2,073
sqft
|
built
2021
3006 Markle Dr, Houston, TX 77003
$-901
Cash flow
-9.3%
Cash-on-Cash Return
3.5%
Cap rate
0.7%
Rent to Value Ratio
Active
$210,000
2
bds
|
0
ba
|
1,019
sqft
|
built
1983
2300 Old Spanish Trl, Houston, TX 77054
$-578
Cash flow
-14.4%
Cash-on-Cash Return
2.4%
Cap rate
0.9%
Rent to Value Ratio
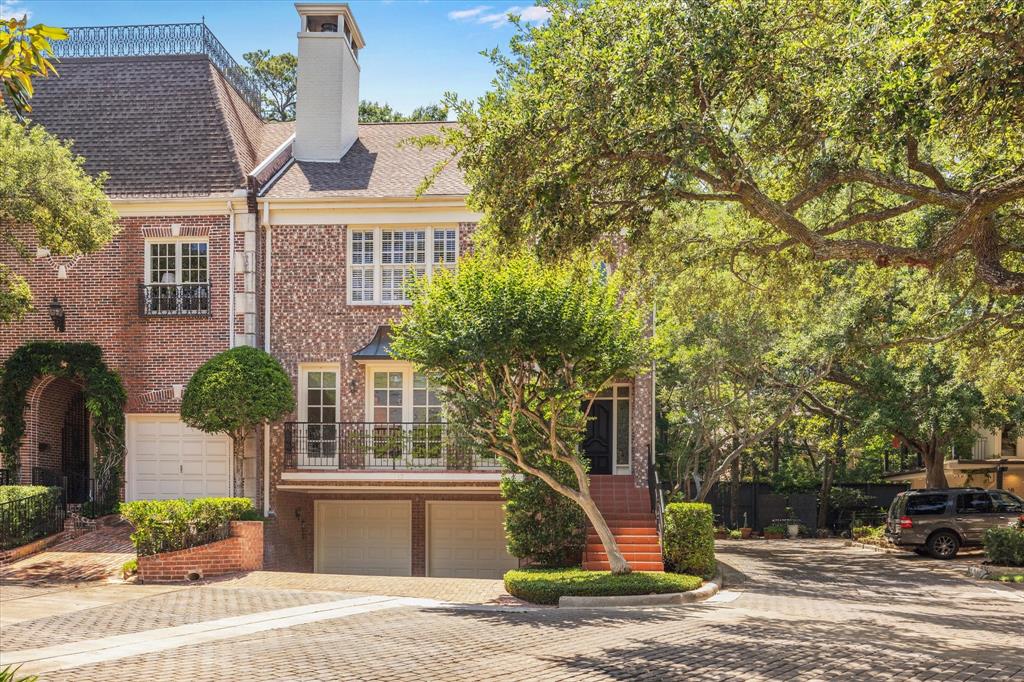
Active
$1,162,000
3
bds
|
0
ba
|
3,880
sqft
|
built
1982
17 Pine Briar Cir, Houston, TX 77056
$-3,305
Cash flow
-14.8%
Cash-on-Cash Return
2.3%
Cap rate
0.5%
Rent to Value Ratio
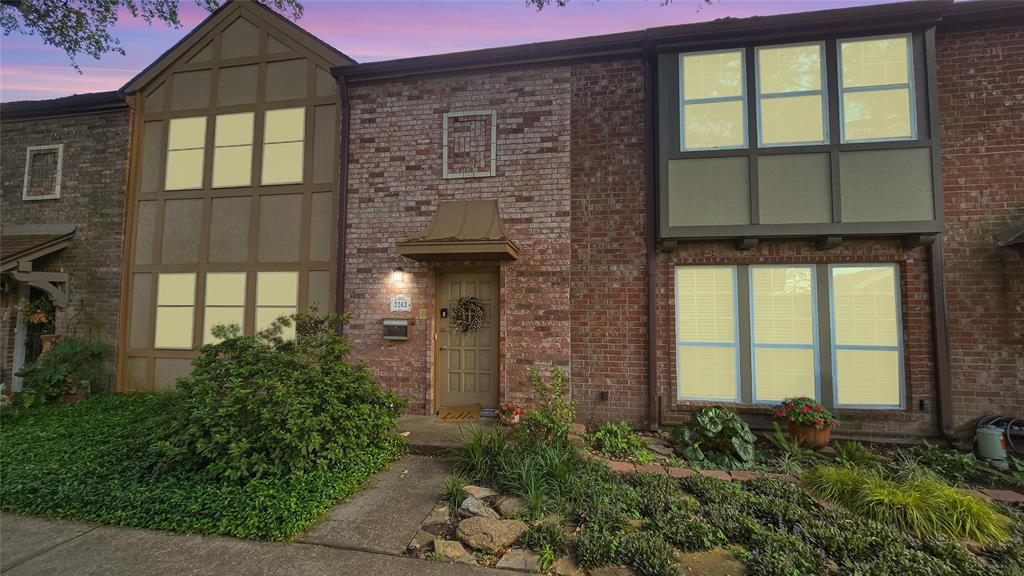
Active
$235,000
3
bds
|
0
ba
|
1,976
sqft
|
built
1970
2263 Triway Ln, Houston, TX 77043
$-378
Cash flow
-8.4%
Cash-on-Cash Return
3.7%
Cap rate
0.9%
Rent to Value Ratio
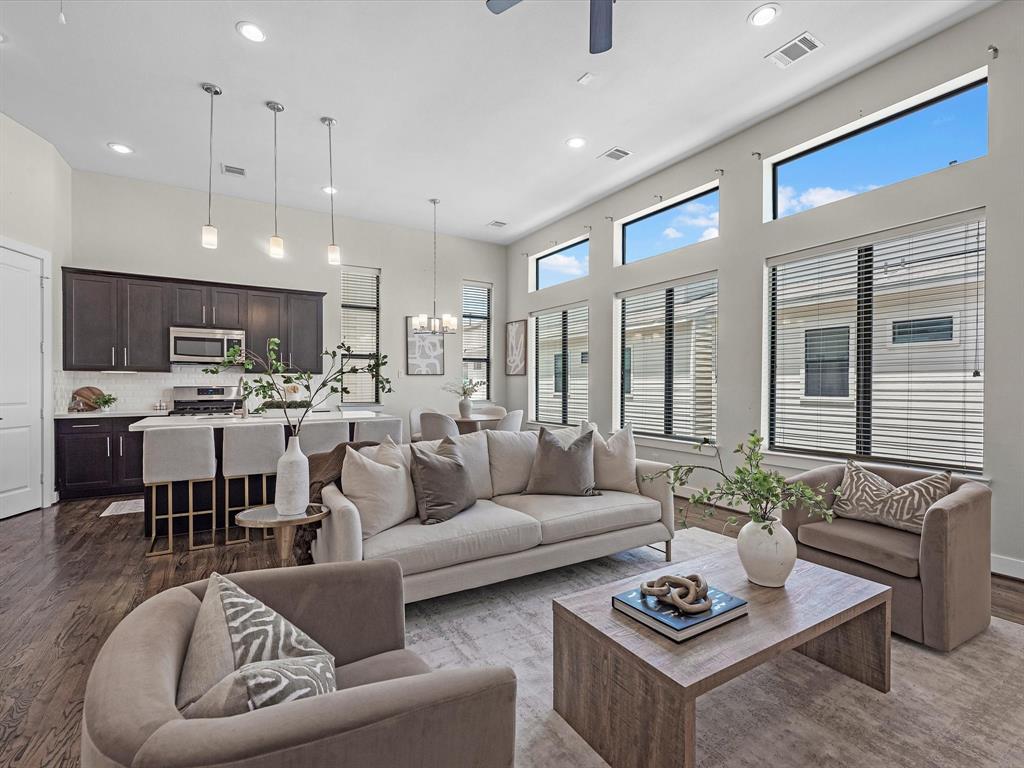
Active
$354,999
3
bds
|
0
ba
|
1,435
sqft
|
built
2018
110 N Hutcheson St, Houston, TX 77003
$-832
Cash flow
-12.2%
Cash-on-Cash Return
2.9%
Cap rate
0.7%
Rent to Value Ratio
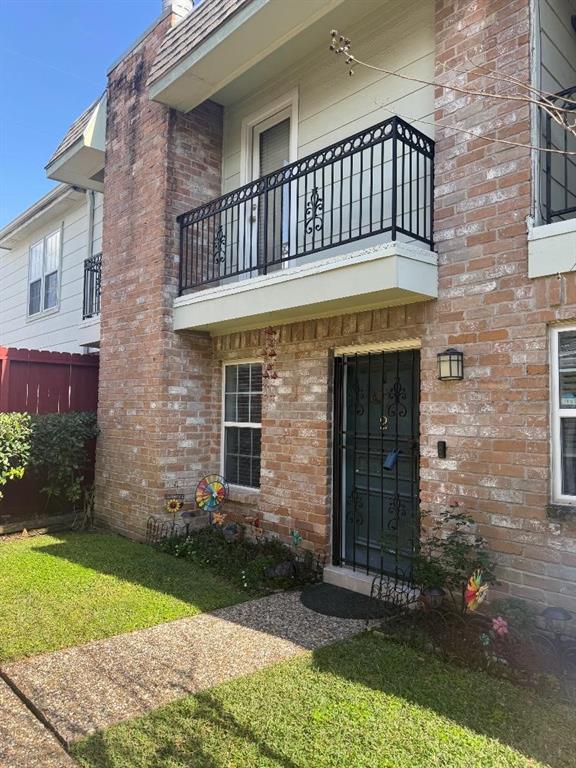
Active
$253,000
3
bds
|
0
ba
|
1,786
sqft
|
built
1973
5514 Beverlyhill St, Houston, TX 77056
$-586
Cash flow
-12.1%
Cash-on-Cash Return
2.9%
Cap rate
0.9%
Rent to Value Ratio
Active
$775,000
3
bds
|
0
ba
|
2,604
sqft
|
built
2005
614 W Bell St, Houston, TX 77019
$-890
Cash flow
-6.0%
Cash-on-Cash Return
4.3%
Cap rate
0.7%
Rent to Value Ratio
Active
$389,500
4
bds
|
0
ba
|
2,478
sqft
|
built
2004
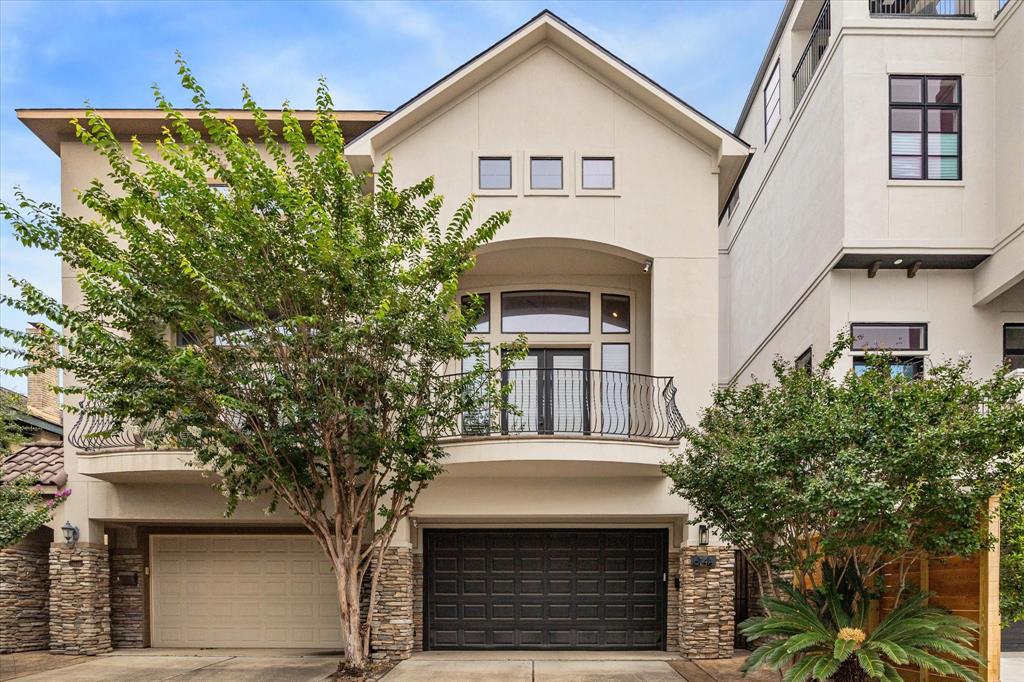
2612 Starboard Point Dr, Houston, TX 77054
$-1,028
Cash flow
-13.8%
Cash-on-Cash Return
2.5%
Cap rate
0.6%
Rent to Value Ratio
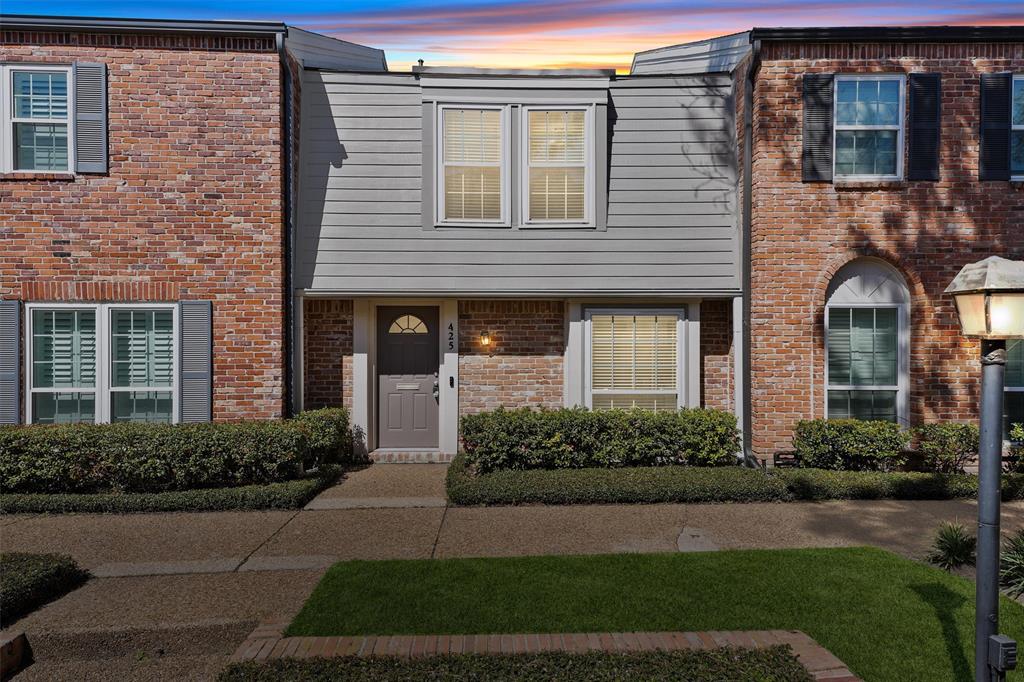
Active
$317,995
2
bds
|
0
ba
|
1,520
sqft
|
built
1967
425 Bendwood Dr, Houston, TX 77024
$-964
Cash flow
-15.8%
Cash-on-Cash Return
2.0%
Cap rate
0.7%
Rent to Value Ratio

Active
$422,299
3
bds
|
0
ba
|
2,020
sqft
|
built
2021
2711 Clinton Dr, Houston, TX 77020
$41
Cash flow
0.5%
Cash-on-Cash Return
5.8%
Cap rate
0.7%
Rent to Value Ratio
Active
$205,000
2
bds
|
0
ba
|
1,284
sqft
|
built
2004
9735 Coyote Creek Dr, Houston, TX 77095
$169
Cash flow
4.3%
Cash-on-Cash Return
6.7%
Cap rate
0.9%
Rent to Value Ratio
Active
$62,000
1
bds
|
0
ba
|
1,029
sqft
|
built
1981
6633 W Airport Blvd, Houston, TX 77035
$256
Cash flow
4.8%
Cash-on-Cash Return
5.0%
Cap rate
1.8%
Rent to Value Ratio
Active
$61,000
2
bds
|
0
ba
|
1,254
sqft
|
built
1972
5625 Antoine Dr, Houston, TX 77091
$272
Cash flow
5.2%
Cash-on-Cash Return
5.4%
Cap rate
2.0%
Rent to Value Ratio
Active
$129,999
2
bds
|
0
ba
|
1,088
sqft
|
built
1969
11547 Beechnut St, Houston, TX 77072
$27
Cash flow
1.1%
Cash-on-Cash Return
5.9%
Cap rate
1.1%
Rent to Value Ratio
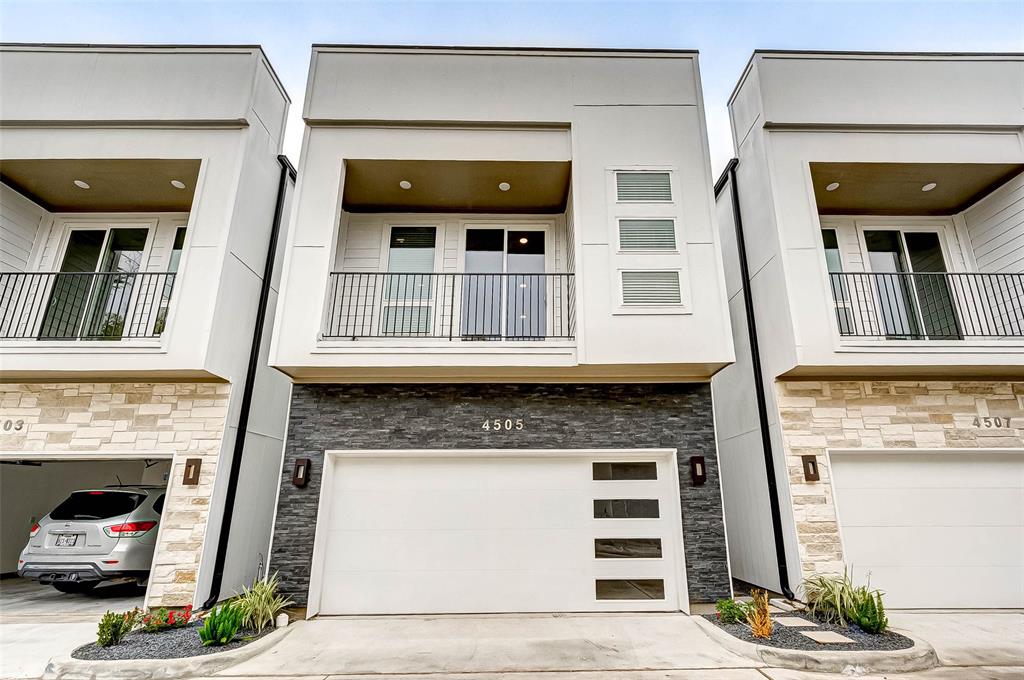
Active under contract
$299,900
3
bds
|
0
ba
|
1,624
sqft
|
built
2020
4505 Whitney Park Way, Houston, TX 77022
$156
Cash flow
2.7%
Cash-on-Cash Return
6.3%
Cap rate
0.8%
Rent to Value Ratio
Active
$99,995
2
bds
|
0
ba
|
1,274
sqft
|
built
1978
8901 S Braeswood Blvd, Houston, TX 77074
$109
Cash flow
5.7%
Cash-on-Cash Return
7.0%
Cap rate
1.4%
Rent to Value Ratio
Active under contract
$217,500
3
bds
|
0
ba
|
1,632
sqft
|
built
1973
14731 Perthshire Rd, Houston, TX 77079
$-353
Cash flow
-8.5%
Cash-on-Cash Return
3.7%
Cap rate
0.9%
Rent to Value Ratio
Active
$131,000
3
bds
|
0
ba
|
1,672
sqft
|
built
1978
9501 Windswept Ln, Houston, TX 77063
$-314
Cash flow
-12.5%
Cash-on-Cash Return
2.8%
Cap rate
1.3%
Rent to Value Ratio
Active
$115,000
2
bds
|
0
ba
|
1,426
sqft
|
built
1975
4164 Belle Park Dr, Houston, TX 77072
$-224
Cash flow
-10.2%
Cash-on-Cash Return
3.3%
Cap rate
1.3%
Rent to Value Ratio
Active
$180,000
2
bds
|
0
ba
|
1,104
sqft
|
built
1978
1845 Witte Rd, Houston, TX 77080
$-89
Cash flow
-2.6%
Cash-on-Cash Return
5.1%
Cap rate
1.0%
Rent to Value Ratio
Active
$49,500
2
bds
|
0
ba
|
1,254
sqft
|
built
1972
5625 Antoine Dr, Houston, TX 77091
$172
Cash flow
4.0%
Cash-on-Cash Return
4.2%
Cap rate
2.2%
Rent to Value Ratio

Active
$228,000
4
bds
|
0
ba
|
1,838
sqft
|
built
1983
6422 Chatham Island Ln, Houston, TX 77035
$-47
Cash flow
-1.1%
Cash-on-Cash Return
5.4%
Cap rate
0.9%
Rent to Value Ratio
Active
$229,000
2
bds
|
0
ba
|
1,492
sqft
|
built
2009
8715 Meadowcroft Dr, Houston, TX 77063
$-336
Cash flow
-7.7%
Cash-on-Cash Return
3.9%
Cap rate
1.0%
Rent to Value Ratio

Active under contract
$689,000
4
bds
|
0
ba
|
3,723
sqft
|
built
2014
2707 Rusk St, Houston, TX 77003
$-991
Cash flow
-7.5%
Cash-on-Cash Return
4.0%
Cap rate
0.8%
Rent to Value Ratio
Active
$349,900
3
bds
|
0
ba
|
2,121
sqft
|
built
1983
2619 Sailboat Dr, Houston, TX 77058
$-877
Cash flow
-13.1%
Cash-on-Cash Return
2.7%
Cap rate
0.8%
Rent to Value Ratio

Active
$345,000
2
bds
|
0
ba
|
1,500
sqft
|
built
1977
701 Bering Dr, Houston, TX 77057
$-1,322
Cash flow
-20.0%
Cash-on-Cash Return
1.1%
Cap rate
0.7%
Rent to Value Ratio
Active
$249,900
3
bds
|
0
ba
|
1,939
sqft
|
built
2016
17035 Wilthorne Gardens Ct, Houston, TX 77084
$-535
Cash flow
-11.2%
Cash-on-Cash Return
3.1%
Cap rate
0.8%
Rent to Value Ratio
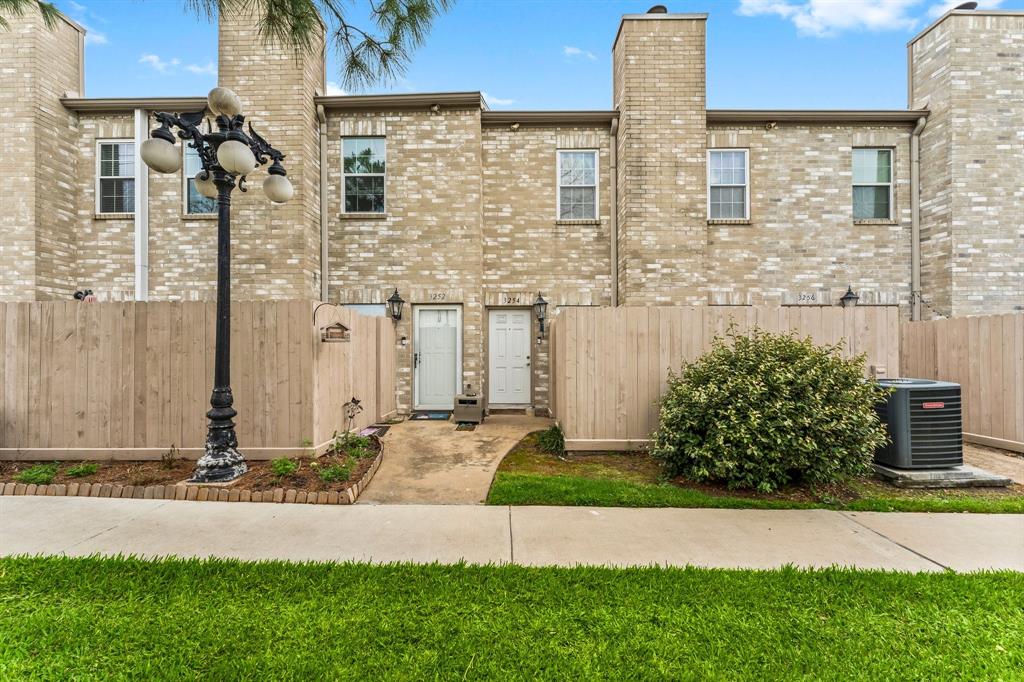
Active
$175,000
2
bds
|
0
ba
|
1,600
sqft
|
built
1984
3254 Holly Hall St, Houston, TX 77054
$-668
Cash flow
-19.9%
Cash-on-Cash Return
1.1%
Cap rate
1.0%
Rent to Value Ratio
Active
$285,000
3
bds
|
0
ba
|
2,016
sqft
|
built
1968
500 N Post Oak Rd, Houston, TX 77024
$-1,427
Cash flow
-26.1%
Cash-on-Cash Return
-0.3%
Cap rate
0.9%
Rent to Value Ratio
Active
$1,199,000
4
bds
|
0
ba
|
3,893
sqft
|
built
2007
5513 Val Verde St, Houston, TX 77056
$-3,014
Cash flow
-13.1%
Cash-on-Cash Return
2.7%
Cap rate
0.5%
Rent to Value Ratio
Active
$399,900
3
bds
|
0
ba
|
2,126
sqft
|
built
2004
17811 Skyline Arbor Ter, Houston, TX 77094
$-1,099
Cash flow
-14.3%
Cash-on-Cash Return
2.4%
Cap rate
0.7%
Rent to Value Ratio
Active
$499,000
3
bds
|
0
ba
|
2,611
sqft
|
built
2006
1524 Birdsall St, Houston, TX 77007
$-942
Cash flow
-9.8%
Cash-on-Cash Return
3.4%
Cap rate
0.6%
Rent to Value Ratio
Active
$379,000
2
bds
|
0
ba
|
1,760
sqft
|
built
1973
5803 Lynbrook Dr, Houston, TX 77057
$-801
Cash flow
-11.0%
Cash-on-Cash Return
3.1%
Cap rate
0.6%
Rent to Value Ratio
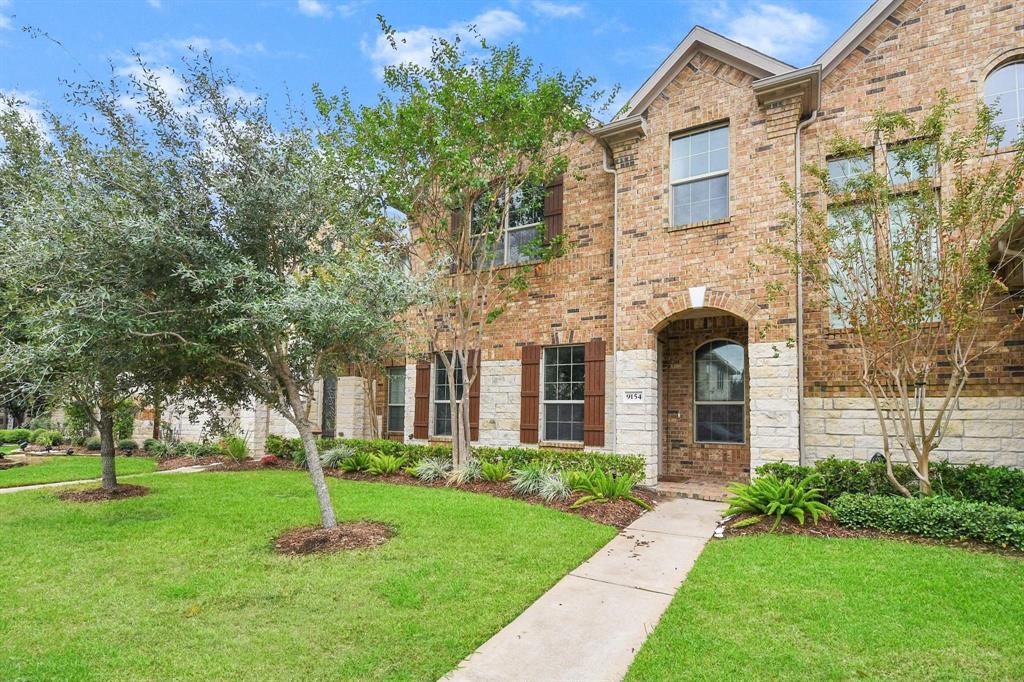
Active
$299,000
3
bds
|
0
ba
|
2,032
sqft
|
built
2015
9154 Sunlight Oak Ln, Houston, TX 77070
$-763
Cash flow
-13.3%
Cash-on-Cash Return
2.6%
Cap rate
0.8%
Rent to Value Ratio