Houston, TX Investment Properties for Sale
Browse homes for sale and investment properties in Houston, TX. Refine your search by price, property type, or more.
Best cash flowing properties in Houston, TX
Active
$255,000
4
bds
|
0
ba
|
1,403
sqft
|
built
1955
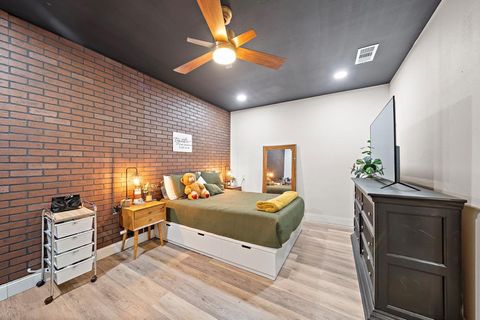
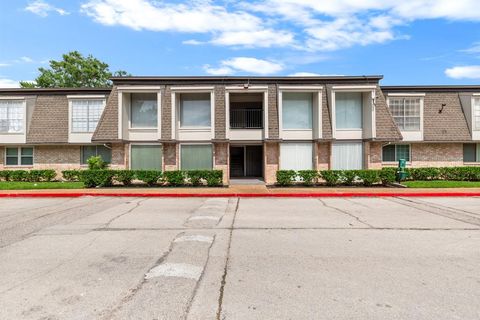
9118 St Lo Rd, Houston, TX 77033
$-113
Cash flow
-2.3%
Cash-on-Cash Return
5.7%
Cap rate
0.8%
Rent to Value Ratio

Active
$134,000
2
bds
|
0
ba
|
1,046
sqft
|
built
1983
2121 Hepburn St, Houston, TX 77054
$-207
Cash flow
-8.1%
Cash-on-Cash Return
4.4%
Cap rate
1.0%
Rent to Value Ratio
8,907 out of 9,359 properties for sale in Houston, TX
Limited Results Shown
Create a free account, or log in to reveal all property listings and enjoy the complete experience.

Active
$135,000
2
bds
|
0
ba
|
964
sqft
|
built
1980
2120 El Paseo St, Houston, TX 77054
$-503
Cash flow
-19.4%
Cash-on-Cash Return
1.8%
Cap rate
1.0%
Rent to Value Ratio

Active
$2,449,000
4
bds
|
0
ba
|
4,837
sqft
|
built
2013
56 Audubon Hollow Ln, Houston, TX 77027
$-7,292
Cash flow
-15.5%
Cash-on-Cash Return
2.7%
Cap rate
0.4%
Rent to Value Ratio
Active
$134,000
2
bds
|
0
ba
|
1,046
sqft
|
built
1983
2121 Hepburn St, Houston, TX 77054
$-207
Cash flow
-8.1%
Cash-on-Cash Return
4.4%
Cap rate
1.0%
Rent to Value Ratio

Active
$179,999
2
bds
|
0
ba
|
993
sqft
|
built
1938
7615 Avenue F, Houston, TX 77012
$-360
Cash flow
-10.4%
Cash-on-Cash Return
3.9%
Cap rate
0.6%
Rent to Value Ratio

Active
$115,000
1
bds
|
0
ba
|
678
sqft
|
built
1978
2350 Bering Dr, Houston, TX 77057
$-274
Cash flow
-12.4%
Cash-on-Cash Return
3.4%
Cap rate
1.0%
Rent to Value Ratio

Active
$350,000
4
bds
|
0
ba
|
2,407
sqft
|
built
2002
9302 Rivercroft Ln, Houston, TX 77089
$-680
Cash flow
-10.1%
Cash-on-Cash Return
3.9%
Cap rate
0.8%
Rent to Value Ratio
Active
$255,000
4
bds
|
0
ba
|
1,403
sqft
|
built
1955
9118 St Lo Rd, Houston, TX 77033
$-113
Cash flow
-2.3%
Cash-on-Cash Return
5.7%
Cap rate
0.8%
Rent to Value Ratio
Active
$246,060
2
bds
|
0
ba
|
1,427
sqft
|
built
1981
5150 Hidalgo St, Houston, TX 77056
$-1,449
Cash flow
-30.7%
Cash-on-Cash Return
-0.8%
Cap rate
0.9%
Rent to Value Ratio

Active
$130,000
2
bds
|
0
ba
|
1,103
sqft
|
built
1982
8235 Sands Point Dr, Houston, TX 77036
$-361
Cash flow
-14.5%
Cash-on-Cash Return
2.9%
Cap rate
1.1%
Rent to Value Ratio

Active
$137,500
2
bds
|
0
ba
|
1,002
sqft
|
built
1983
12550 Whittington Dr, Houston, TX 77077
$-440
Cash flow
-16.7%
Cash-on-Cash Return
2.4%
Cap rate
1.0%
Rent to Value Ratio
Active
$189,900
2
bds
|
0
ba
|
1,174
sqft
|
built
1982
7575 Cambridge St, Houston, TX 77054
$-685
Cash flow
-18.8%
Cash-on-Cash Return
1.9%
Cap rate
0.8%
Rent to Value Ratio
Active
$123,000
2
bds
|
0
ba
|
980
sqft
|
built
1983
2011 Spenwick Dr, Houston, TX 77055
$-434
Cash flow
-18.4%
Cash-on-Cash Return
2.0%
Cap rate
1.1%
Rent to Value Ratio
Active
$165,000
2
bds
|
0
ba
|
1,500
sqft
|
built
1982
3800 Tanglewilde St, Houston, TX 77063
$-453
Cash flow
-14.3%
Cash-on-Cash Return
3.0%
Cap rate
1.0%
Rent to Value Ratio

Active
$485,000
2
bds
|
0
ba
|
1,250
sqft
|
built
1983
2001 Holcombe Blvd, Houston, TX 77030
$-2,519
Cash flow
-27.1%
Cash-on-Cash Return
0.0%
Cap rate
0.5%
Rent to Value Ratio
Active
$335,000
3
bds
|
0
ba
|
2,178
sqft
|
built
1983
3350 Mc Cue Rd, Houston, TX 77056
$-2,690
Cash flow
-41.9%
Cash-on-Cash Return
-3.4%
Cap rate
0.9%
Rent to Value Ratio

Active
$490,000
2
bds
|
0
ba
|
3,248
sqft
|
built
1964
3405 Drew St, Houston, TX 77004
$-2,495
Cash flow
-26.6%
Cash-on-Cash Return
0.2%
Cap rate
0.2%
Rent to Value Ratio
Active
$205,000
2
bds
|
0
ba
|
1,996
sqft
|
built
1965
5050 Woodway Dr, Houston, TX 77056
$-801
Cash flow
-20.4%
Cash-on-Cash Return
1.6%
Cap rate
1.7%
Rent to Value Ratio

Active
$730,000
3
bds
|
0
ba
|
3,222
sqft
|
built
2023
1611 W 22nd St, Houston, TX 77008
$-547
Cash flow
-3.9%
Cash-on-Cash Return
5.4%
Cap rate
0.9%
Rent to Value Ratio
Active
$335,000
3
bds
|
0
ba
|
1,460
sqft
|
built
2016
24 N Hutcheson St, Houston, TX 77003
$-979
Cash flow
-15.2%
Cash-on-Cash Return
2.8%
Cap rate
0.7%
Rent to Value Ratio
Active
$215,000
1
bds
|
0
ba
|
719
sqft
|
built
2015
1011 Studemont St, Houston, TX 77007
$-760
Cash flow
-18.4%
Cash-on-Cash Return
2.0%
Cap rate
0.7%
Rent to Value Ratio

Active
$253,000
3
bds
|
0
ba
|
1,786
sqft
|
built
1973
5514 Beverlyhill St, Houston, TX 77056
$-710
Cash flow
-14.6%
Cash-on-Cash Return
2.9%
Cap rate
0.9%
Rent to Value Ratio
Active
$155,900
2
bds
|
0
ba
|
720
sqft
|
built
1963
3300 Yorktown St, Houston, TX 77056
$-868
Cash flow
-29.0%
Cash-on-Cash Return
-0.4%
Cap rate
0.9%
Rent to Value Ratio
Active
$145,900
2
bds
|
0
ba
|
1,298
sqft
|
built
1974
5005 Georgi Ln, Houston, TX 77092
$-463
Cash flow
-16.6%
Cash-on-Cash Return
2.5%
Cap rate
1.1%
Rent to Value Ratio
Active
$299,000
2
bds
|
0
ba
|
1,875
sqft
|
built
1977
2323 Augusta Dr, Houston, TX 77057
$-910
Cash flow
-15.9%
Cash-on-Cash Return
2.6%
Cap rate
0.8%
Rent to Value Ratio

Active
$335,000
2
bds
|
0
ba
|
1,500
sqft
|
built
1977
701 Bering Dr, Houston, TX 77057
$-1,438
Cash flow
-22.4%
Cash-on-Cash Return
1.1%
Cap rate
0.7%
Rent to Value Ratio
Active
$215,000
3
bds
|
0
ba
|
1,522
sqft
|
built
1969
12633 Memorial Dr, Houston, TX 77024
$-636
Cash flow
-15.4%
Cash-on-Cash Return
2.7%
Cap rate
0.9%
Rent to Value Ratio

Active
$299,786
4
bds
|
0
ba
|
2,541
sqft
|
built
2017
11646 Downey Violet Ln, Houston, TX 77044
$-767
Cash flow
-13.3%
Cash-on-Cash Return
3.2%
Cap rate
0.8%
Rent to Value Ratio
Active
$385,000
2
bds
|
0
ba
|
1,665
sqft
|
built
1911
1700 Main St, Houston, TX 77002
$-1,698
Cash flow
-23.0%
Cash-on-Cash Return
1.0%
Cap rate
0.8%
Rent to Value Ratio
Active
$218,000
2
bds
|
0
ba
|
858
sqft
|
built
1963
3944 W Alabama St, Houston, TX 77027
$-647
Cash flow
-15.5%
Cash-on-Cash Return
2.7%
Cap rate
0.9%
Rent to Value Ratio

Active
$950,000
3
bds
|
0
ba
|
3,250
sqft
|
built
2021
846 Dunleigh Meadows Ln, Houston, TX 77055
$-2,542
Cash flow
-14.0%
Cash-on-Cash Return
3.1%
Cap rate
0.7%
Rent to Value Ratio
Active
$110,000
2
bds
|
0
ba
|
700
sqft
|
built
1979
2110 Wilcrest Dr, Houston, TX 77042
$-343
Cash flow
-16.3%
Cash-on-Cash Return
2.5%
Cap rate
1.0%
Rent to Value Ratio
Active
$225,000
1
bds
|
0
ba
|
768
sqft
|
built
1964
3614 Montrose Blvd, Houston, TX 77006
$-993
Cash flow
-23.0%
Cash-on-Cash Return
1.0%
Cap rate
0.9%
Rent to Value Ratio

Active
$137,500
1
bds
|
0
ba
|
680
sqft
|
built
1980
8801 Hammerly Blvd, Houston, TX 77080
$-286
Cash flow
-10.9%
Cash-on-Cash Return
3.8%
Cap rate
0.9%
Rent to Value Ratio

Active
$1,135,000
3
bds
|
0
ba
|
3,783
sqft
|
built
2015
5505 Jackson St, Houston, TX 77004
$-2,692
Cash flow
-12.4%
Cash-on-Cash Return
3.4%
Cap rate
0.6%
Rent to Value Ratio

Active
$899,000
5
bds
|
0
ba
|
3,434
sqft
|
built
2018
7822 Coachwood Dr, Houston, TX 77071
$-1,707
Cash flow
-9.9%
Cash-on-Cash Return
4.0%
Cap rate
0.5%
Rent to Value Ratio
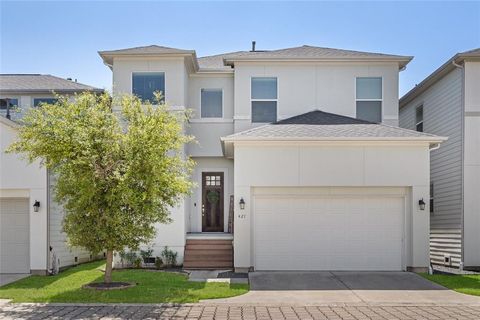
Active
$349,000
3
bds
|
0
ba
|
1,958
sqft
|
built
2018
427 Yale Oaks Ln, Houston, TX 77091
$-686
Cash flow
-10.3%
Cash-on-Cash Return
3.9%
Cap rate
0.8%
Rent to Value Ratio

Active
$279,900
3
bds
|
0
ba
|
1,707
sqft
|
built
2018
14726 Meadow Acre Trl, Houston, TX 77049
$-788
Cash flow
-14.7%
Cash-on-Cash Return
2.9%
Cap rate
0.7%
Rent to Value Ratio
Active
$749,900
5
bds
|
0
ba
|
3,849
sqft
|
built
2018
5711 Greenwood Colony Ct, Houston, TX 77059
$-3,077
Cash flow
-21.4%
Cash-on-Cash Return
1.3%
Cap rate
0.5%
Rent to Value Ratio
Active
$350,000
3
bds
|
0
ba
|
1,729
sqft
|
built
2019
9504 Retriever Way, Houston, TX 77055
$-791
Cash flow
-11.8%
Cash-on-Cash Return
3.6%
Cap rate
0.8%
Rent to Value Ratio

Active
$120,000
2
bds
|
0
ba
|
1,035
sqft
|
built
1978
1500 Bay Area Blvd, Houston, TX 77058
$-294
Cash flow
-12.8%
Cash-on-Cash Return
3.3%
Cap rate
1.2%
Rent to Value Ratio