Houston, TX Investment Properties for Sale
Browse homes for sale and investment properties in Houston, TX. Refine your search by price, property type, or more.
Best cash flowing properties in Houston, TX

Active
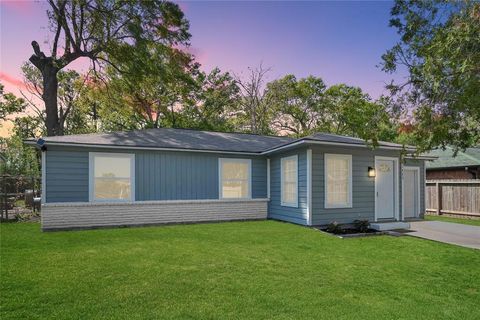
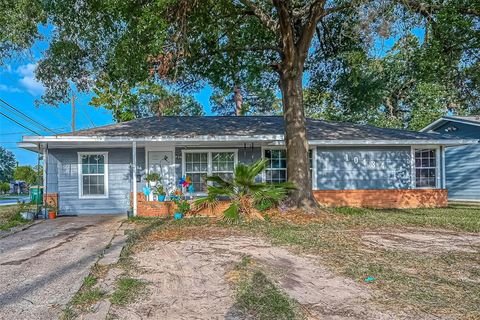
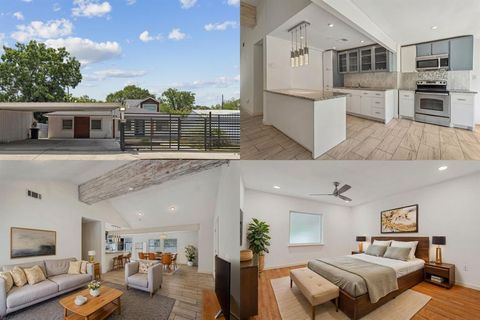
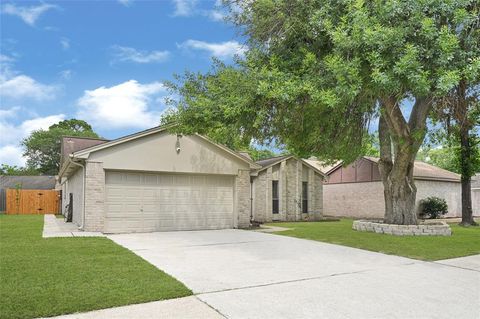
$179,000
3
bds
|
0
ba
|
1,231
sqft
|
built
1953
10124 Homestead Rd, Houston, TX 77016
$16
Cash flow
0.5%
Cash-on-Cash Return
6.4%
Cap rate
0.9%
Rent to Value Ratio

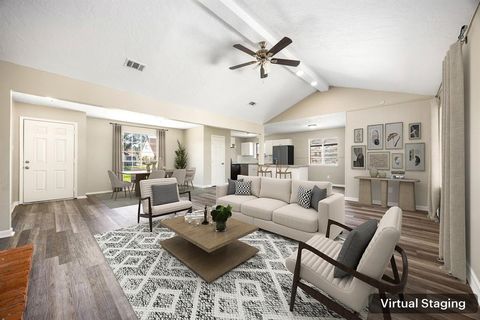
Active
$199,990
3
bds
|
0
ba
|
1,606
sqft
|
built
1950
10118 Norvic St, Houston, TX 77029
$-112
Cash flow
-2.9%
Cash-on-Cash Return
5.6%
Cap rate
0.9%
Rent to Value Ratio
8,406 out of 8,846 properties for sale in Houston, TX
Limited Results Shown
Create a free account, or log in to reveal all property listings and enjoy the complete experience.
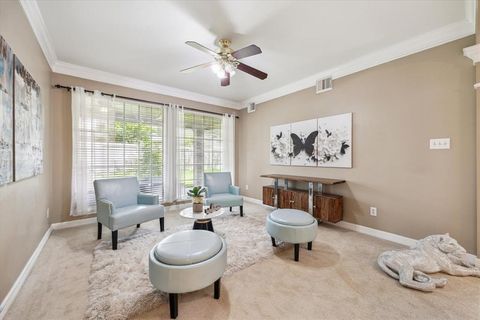
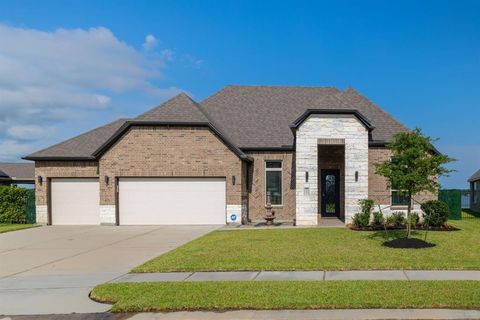
Active
$238,900
4
bds
|
0
ba
|
1,307
sqft
|
built
1960
11423 Raincove Dr, Houston, TX 77016
$-430
Cash flow
-9.4%
Cash-on-Cash Return
4.1%
Cap rate
0.6%
Rent to Value Ratio
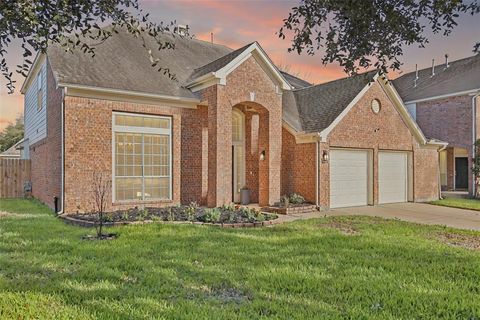
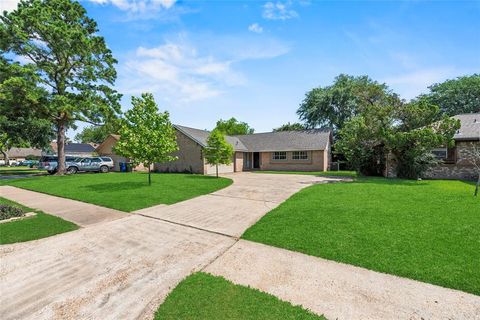
Active
$335,000
3
bds
|
0
ba
|
1,801
sqft
|
built
1969
1919 Tallulah Ln, Houston, TX 77077
$-800
Cash flow
-12.5%
Cash-on-Cash Return
3.4%
Cap rate
0.7%
Rent to Value Ratio
Pending
$475,000
5
bds
|
0
ba
|
3,549
sqft
|
built
1998
4210 Olive Oak Ct, Houston, TX 77059
$-1,055
Cash flow
-11.6%
Cash-on-Cash Return
3.6%
Cap rate
0.7%
Rent to Value Ratio
Active
$379,999
4
bds
|
0
ba
|
2,809
sqft
|
built
1999
16210 Broken Timber Cir, Houston, TX 77095
$-338
Cash flow
-4.6%
Cash-on-Cash Return
5.2%
Cap rate
0.7%
Rent to Value Ratio
Active under contract
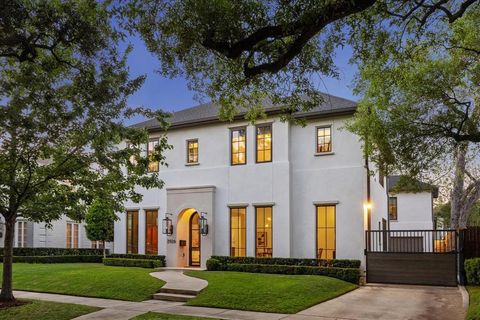
$2,495,000
5
bds
|
0
ba
|
4,253
sqft
|
built
2018
2926 Wroxton Rd, Houston, TX 77005
$-10,663
Cash flow
-22.3%
Cash-on-Cash Return
1.1%
Cap rate
0.3%
Rent to Value Ratio
Active
$148,000
1
bds
|
0
ba
|
815
sqft
|
built
1983
2300 Old Spanish Trl, Houston, TX 77054
$-475
Cash flow
-16.7%
Cash-on-Cash Return
2.4%
Cap rate
0.9%
Rent to Value Ratio
Active
$205,000
4
bds
|
0
ba
|
1,323
sqft
|
built
1955
10434 Envoy St, Houston, TX 77016
$-219
Cash flow
-5.6%
Cash-on-Cash Return
5.0%
Cap rate
0.8%
Rent to Value Ratio
Active
$375,000
3
bds
|
0
ba
|
2,415
sqft
|
built
1982
14110 Muirfield Ln, Houston, TX 77095
$-814
Cash flow
-11.3%
Cash-on-Cash Return
3.7%
Cap rate
0.7%
Rent to Value Ratio
Active
$325,000
4
bds
|
0
ba
|
2,150
sqft
|
built
1949
6414 Crestridge St, Houston, TX 77033
$-1,581
Cash flow
-25.4%
Cash-on-Cash Return
0.4%
Cap rate
0.3%
Rent to Value Ratio
Active
$385,000
4
bds
|
0
ba
|
2,419
sqft
|
built
2006
2617 Edgefield Lakes Dr, Houston, TX 77054
$-1,036
Cash flow
-14.0%
Cash-on-Cash Return
3.0%
Cap rate
0.7%
Rent to Value Ratio
Active
$199,990
3
bds
|
0
ba
|
1,606
sqft
|
built
1950
10118 Norvic St, Houston, TX 77029
$-112
Cash flow
-2.9%
Cash-on-Cash Return
5.6%
Cap rate
0.9%
Rent to Value Ratio
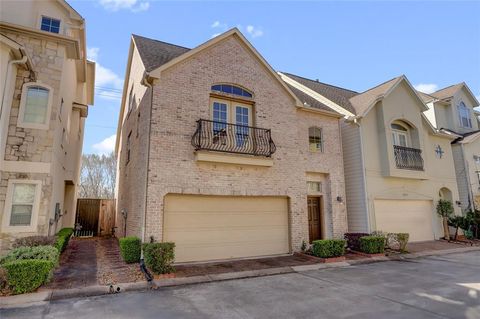
Pending
$1,200,000
3
bds
|
0
ba
|
2,360
sqft
|
built
1991
613 E 18th St, Houston, TX 77008
$-3,983
Cash flow
-17.3%
Cash-on-Cash Return
2.3%
Cap rate
0.5%
Rent to Value Ratio
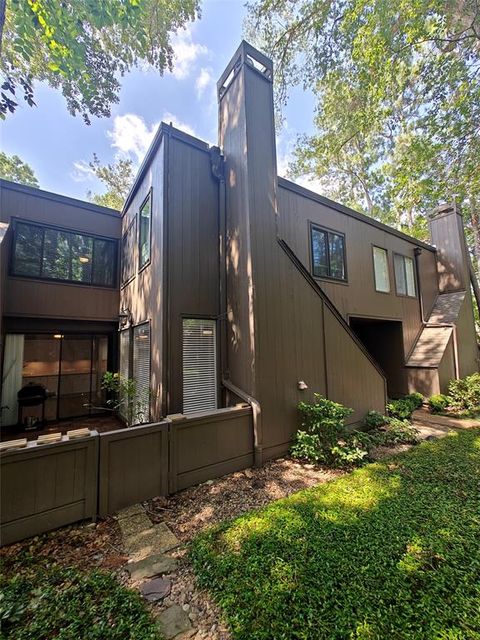
Active
$376,000
3
bds
|
0
ba
|
1,639
sqft
|
built
1977
161 Litchfield Ln, Houston, TX 77024
$-1,264
Cash flow
-17.5%
Cash-on-Cash Return
2.2%
Cap rate
0.7%
Rent to Value Ratio
Active
$417,300
4
bds
|
0
ba
|
2,420
sqft
|
built
1988
14515 Redbud Valley Trl, Houston, TX 77062
$-1,025
Cash flow
-12.8%
Cash-on-Cash Return
3.3%
Cap rate
0.6%
Rent to Value Ratio
Active
$2,790,000
4
bds
|
0
ba
|
4,846
sqft
|
built
2015
507 Terrace Dr, Houston, TX 77007
$-12,694
Cash flow
-23.7%
Cash-on-Cash Return
0.8%
Cap rate
0.3%
Rent to Value Ratio
Active
$390,000
4
bds
|
0
ba
|
3,403
sqft
|
built
2005
8714 Ridgebury Cir, Houston, TX 77095
$-904
Cash flow
-12.1%
Cash-on-Cash Return
3.5%
Cap rate
0.7%
Rent to Value Ratio
Active
$689,500
2
bds
|
0
ba
|
1,953
sqft
|
built
1981
101 Westcott St, Houston, TX 77007
$-3,232
Cash flow
-24.5%
Cash-on-Cash Return
0.6%
Cap rate
0.5%
Rent to Value Ratio
Active
$108,000
1
bds
|
0
ba
|
765
sqft
|
built
1967
7900 Westheimer Rd, Houston, TX 77063
$-321
Cash flow
-15.5%
Cash-on-Cash Return
2.7%
Cap rate
1.1%
Rent to Value Ratio
Active
$315,000
3
bds
|
0
ba
|
1,868
sqft
|
built
2022
6405 Highland Pine Ln, Houston, TX 77091
$-585
Cash flow
-9.7%
Cash-on-Cash Return
4.0%
Cap rate
0.8%
Rent to Value Ratio
Active
$439,000
4
bds
|
0
ba
|
2,592
sqft
|
built
2018
10407 Quiet Courtyard Rd, Houston, TX 77043
$-1,147
Cash flow
-13.6%
Cash-on-Cash Return
3.1%
Cap rate
0.7%
Rent to Value Ratio

Active
$375,000
3
bds
|
0
ba
|
1,960
sqft
|
built
1976
6335 Portal Dr, Houston, TX 77096
$-338
Cash flow
-4.7%
Cash-on-Cash Return
5.2%
Cap rate
0.7%
Rent to Value Ratio
Active
$209,900
3
bds
|
0
ba
|
1,712
sqft
|
built
1979
11002 Hammerly Blvd, Houston, TX 77043
$-484
Cash flow
-12.0%
Cash-on-Cash Return
3.5%
Cap rate
1.0%
Rent to Value Ratio
Active
$1,225,000
3
bds
|
0
ba
|
4,863
sqft
|
built
1982
7 Pine Briar Cir, Houston, TX 77056
$-5,983
Cash flow
-25.5%
Cash-on-Cash Return
0.4%
Cap rate
0.3%
Rent to Value Ratio
Active
$1,895,000
4
bds
|
0
ba
|
4,276
sqft
|
built
1999
5710 Logan Ln, Houston, TX 77007
$-7,191
Cash flow
-19.8%
Cash-on-Cash Return
1.7%
Cap rate
0.3%
Rent to Value Ratio
Active
$509,000
3
bds
|
0
ba
|
2,416
sqft
|
built
2012
1610 Knox St, Houston, TX 77007
$-1,321
Cash flow
-13.5%
Cash-on-Cash Return
3.1%
Cap rate
0.6%
Rent to Value Ratio
Pending
$314,000
4
bds
|
0
ba
|
2,041
sqft
|
built
1968
5906 Burning Tree Dr, Houston, TX 77036
$-616
Cash flow
-10.2%
Cash-on-Cash Return
3.9%
Cap rate
0.7%
Rent to Value Ratio
Active under contract
$240,000
3
bds
|
0
ba
|
1,671
sqft
|
built
1979
8118 Wind Forest Dr, Houston, TX 77040
$-344
Cash flow
-7.5%
Cash-on-Cash Return
4.5%
Cap rate
0.8%
Rent to Value Ratio
Active
$379,000
4
bds
|
0
ba
|
2,364
sqft
|
built
1999
9622 Hanging Moss Trl, Houston, TX 77064
$-1,012
Cash flow
-13.9%
Cash-on-Cash Return
3.1%
Cap rate
0.6%
Rent to Value Ratio
Active
$949,900
4
bds
|
0
ba
|
3,033
sqft
|
built
2021
9314 Brunel Ln, Houston, TX 77044
$-3,063
Cash flow
-16.8%
Cash-on-Cash Return
2.4%
Cap rate
0.5%
Rent to Value Ratio
Pending
$245,000
3
bds
|
0
ba
|
1,802
sqft
|
built
1976
5930 Bihia Forest Dr, Houston, TX 77088
$-373
Cash flow
-7.9%
Cash-on-Cash Return
4.4%
Cap rate
0.8%
Rent to Value Ratio
Active
$289,999
3
bds
|
0
ba
|
2,271
sqft
|
built
2007
14851 Tuttle Point Dr, Houston, TX 77082
$-591
Cash flow
-10.6%
Cash-on-Cash Return
3.8%
Cap rate
0.7%
Rent to Value Ratio
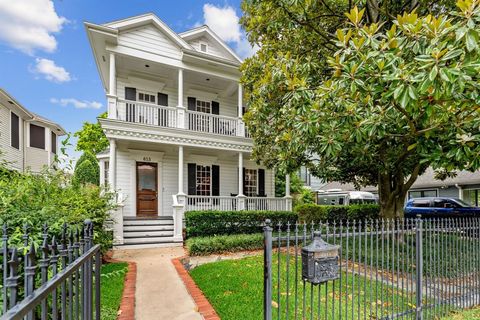
Active
$949,900
5
bds
|
0
ba
|
2,850
sqft
|
built
2014
428 W 26th St, Houston, TX 77008
$-681
Cash flow
-3.7%
Cash-on-Cash Return
5.4%
Cap rate
0.7%
Rent to Value Ratio
Active
$179,000
3
bds
|
0
ba
|
1,231
sqft
|
built
1953
10124 Homestead Rd, Houston, TX 77016
$16
Cash flow
0.5%
Cash-on-Cash Return
6.4%
Cap rate
0.9%
Rent to Value Ratio
Active
$310,000
4
bds
|
0
ba
|
2,040
sqft
|
built
1982
15511 Glenwood Park Dr, Houston, TX 77095
$-588
Cash flow
-9.9%
Cash-on-Cash Return
4.0%
Cap rate
0.7%
Rent to Value Ratio

Active
$675,000
3
bds
|
0
ba
|
2,780
sqft
|
built
2013
1509 Colorado St, Houston, TX 77007
$-1,452
Cash flow
-11.2%
Cash-on-Cash Return
3.7%
Cap rate
0.7%
Rent to Value Ratio

Active
$389,000
4
bds
|
0
ba
|
2,989
sqft
|
built
2000
8034 High Hollow Ln, Houston, TX 77070
$-905
Cash flow
-12.1%
Cash-on-Cash Return
3.5%
Cap rate
0.6%
Rent to Value Ratio
Active
$205,000
3
bds
|
0
ba
|
1,832
sqft
|
built
2006
3127 Atherton Canyon Ln, Houston, TX 77014
$-451
Cash flow
-11.5%
Cash-on-Cash Return
3.6%
Cap rate
0.9%
Rent to Value Ratio

Active
$290,000
3
bds
|
0
ba
|
1,581
sqft
|
built
2016
4809 Nichols St, Houston, TX 77020
$-472
Cash flow
-8.5%
Cash-on-Cash Return
4.3%
Cap rate
0.8%
Rent to Value Ratio
Active
$179,999
3
bds
|
0
ba
|
1,106
sqft
|
built
1975
5739 Gatewood Ave, Houston, TX 77053
$-148
Cash flow
-4.3%
Cash-on-Cash Return
5.3%
Cap rate
0.9%
Rent to Value Ratio

Active
$399,000
3
bds
|
0
ba
|
1,533
sqft
|
built
1952
6625 Fairfield St, Houston, TX 77023
$-1,263
Cash flow
-16.5%
Cash-on-Cash Return
2.5%
Cap rate
0.5%
Rent to Value Ratio