Huntington Beach, CA Investment Properties for Sale
Browse homes for sale and investment properties in Huntington Beach, CA. Refine your search by price, property type, or more.
Best cash flowing properties in Huntington Beach, CA

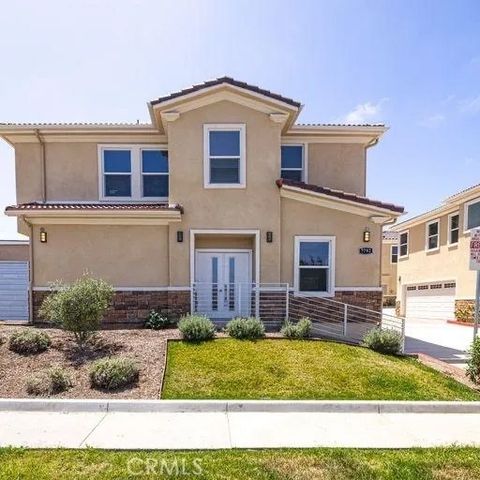
Active
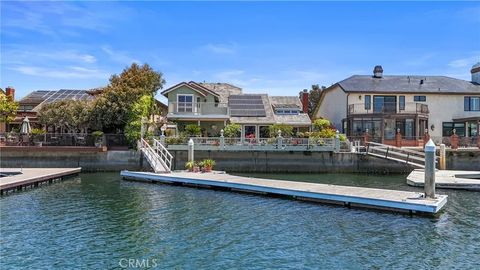
$829,000
2
bds
|
2
ba
|
1,056
sqft
|
built
1978
8566 Fallbrook Cir, Huntington Beach, CA 92646
$-2,308
Cash flow
-14.5%
Cash-on-Cash Return
2.7%
Cap rate
0.4%
Rent to Value Ratio

Active
$1,285,000
4
bds
|
3
ba
|
1,912
sqft
|
built
2022
19209 Tideline Ct, Huntington Beach, CA 92648
$-3,073
Cash flow
-12.5%
Cash-on-Cash Return
3.2%
Cap rate
0.4%
Rent to Value Ratio
20 out of 129 properties for sale in Huntington Beach, CA
Limited Results Shown
Create a free account, or log in to reveal all property listings and enjoy the complete experience.

Active
$1,450,000
4
bds
|
5
ba
|
2,236
sqft
|
built
1963
9331 Grand Dr, Huntington Beach, CA 92646
$-3,537
Cash flow
-12.7%
Cash-on-Cash Return
3.1%
Cap rate
0.4%
Rent to Value Ratio

Active
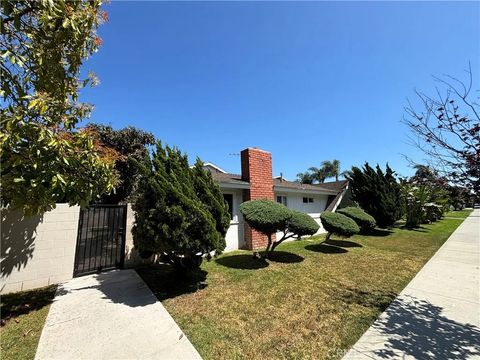
$1,799,000
3
bds
|
3
ba
|
2,406
sqft
|
built
1989
1208 California St, Huntington Beach, CA 92648
$-4,750
Cash flow
-13.8%
Cash-on-Cash Return
2.9%
Cap rate
0.4%
Rent to Value Ratio

Active
$1,999,999
7
bds
|
4
ba
|
0
sqft
|
built
1954
1701 Lake St, Huntington Beach, CA 92648
$-5,946
Cash flow
-15.5%
Cash-on-Cash Return
2.1%
Cap rate
0.3%
Rent to Value Ratio

Active
$1,995,000
3
bds
|
3
ba
|
2,561
sqft
|
built
2003
613 Frankfort Ave, Huntington Beach, CA 92648
$-5,189
Cash flow
-13.6%
Cash-on-Cash Return
2.9%
Cap rate
0.4%
Rent to Value Ratio
Active
$5,699,900
16
bds
|
18
ba
|
0
sqft
|
built
2021
7792 Liberty Dr, Huntington Beach, CA 92647
$-24,475
Cash flow
-22.4%
Cash-on-Cash Return
0.9%
Cap rate
0.1%
Rent to Value Ratio

Active
$5,750,000
6
bds
|
4
ba
|
4,772
sqft
|
built
1973
16181 Santa Barbara Ln, Huntington Beach, CA 92649
$-23,153
Cash flow
-21.0%
Cash-on-Cash Return
1.2%
Cap rate
0.2%
Rent to Value Ratio
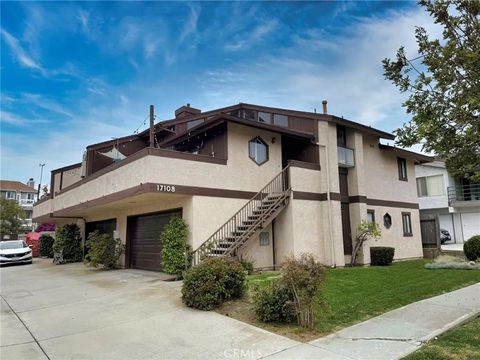
Active
$2,295,000
6
bds
|
9
ba
|
0
sqft
|
built
1981
17108 Sims Ln, Huntington Beach, CA 92649
$-8,845
Cash flow
-20.1%
Cash-on-Cash Return
1.4%
Cap rate
0.2%
Rent to Value Ratio
Active
$2,239,000
4
bds
|
5
ba
|
0
sqft
|
built
1976
16771 Green Ln, Huntington Beach, CA 92649
$-9,597
Cash flow
-22.4%
Cash-on-Cash Return
0.9%
Cap rate
0.1%
Rent to Value Ratio

Active
$1,750,000
3
bds
|
3
ba
|
2,413
sqft
|
built
1979
420 19th St, Huntington Beach, CA 92648
$-4,502
Cash flow
-13.4%
Cash-on-Cash Return
3.0%
Cap rate
0.4%
Rent to Value Ratio
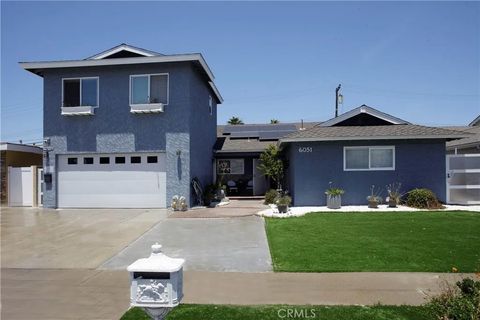
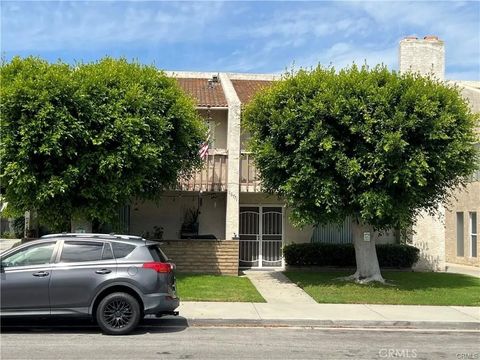
Active
$1,800,000
6
bds
|
4
ba
|
2,422
sqft
|
built
1965
6051 Summerdale Dr, Huntington Beach, CA 92647
$-5,721
Cash flow
-16.6%
Cash-on-Cash Return
2.3%
Cap rate
0.3%
Rent to Value Ratio

Active
$2,150,000
9
bds
|
7
ba
|
0
sqft
|
built
1971
18712 Demion Ln, Huntington Beach, CA 92646
$-8,664
Cash flow
-21.0%
Cash-on-Cash Return
1.2%
Cap rate
0.1%
Rent to Value Ratio
Active
$5,800,000
4
bds
|
3
ba
|
3,102
sqft
|
built
1977
3562 Venture Dr, Huntington Beach, CA 92649
$-24,182
Cash flow
-21.8%
Cash-on-Cash Return
1.1%
Cap rate
0.1%
Rent to Value Ratio

Active
$2,649,000
4
bds
|
5
ba
|
3,193
sqft
|
built
1999
18742 Calera Ln, Huntington Beach, CA 92648
$-8,243
Cash flow
-16.2%
Cash-on-Cash Return
2.3%
Cap rate
0.3%
Rent to Value Ratio
Active
$2,000,000
9
bds
|
7
ba
|
0
sqft
|
built
1968
16542 Sabot Ln, Huntington Beach, CA 92647
$-7,905
Cash flow
-20.6%
Cash-on-Cash Return
1.3%
Cap rate
0.2%
Rent to Value Ratio
Active
$1,995,000
8
bds
|
6
ba
|
0
sqft
|
built
1964
17082 Emerald Ln, Huntington Beach, CA 92647
$-7,949
Cash flow
-20.8%
Cash-on-Cash Return
1.3%
Cap rate
0.2%
Rent to Value Ratio

Active
$2,150,000
4
bds
|
3
ba
|
3,848
sqft
|
built
1970
9522 Yellowstone Dr, Huntington Beach, CA 92646
$-6,042
Cash flow
-14.7%
Cash-on-Cash Return
2.7%
Cap rate
0.3%
Rent to Value Ratio
Active
$2,700,000
6
bds
|
5
ba
|
0
sqft
|
built
1950
7736 Sugar Dr, Huntington Beach, CA 92647
$-10,134
Cash flow
-19.6%
Cash-on-Cash Return
1.6%
Cap rate
0.2%
Rent to Value Ratio
Active
$2,499,000
10
bds
|
9
ba
|
0
sqft
|
built
1977
16642 Algonquin St, Huntington Beach, CA 92649
$-9,876
Cash flow
-20.6%
Cash-on-Cash Return
1.3%
Cap rate
0.2%
Rent to Value Ratio