Hyde Park, UT Investment Properties for Sale
Browse homes for sale and investment properties in Hyde Park, UT. Refine your search by price, property type, or more.
Best cash flowing properties in Hyde Park, UT
Active
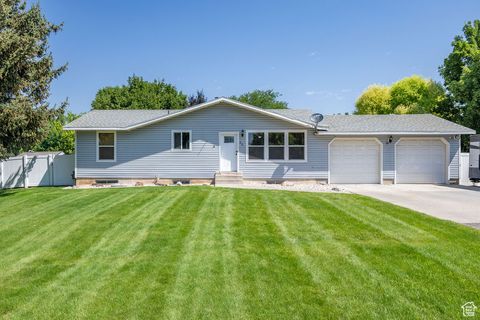
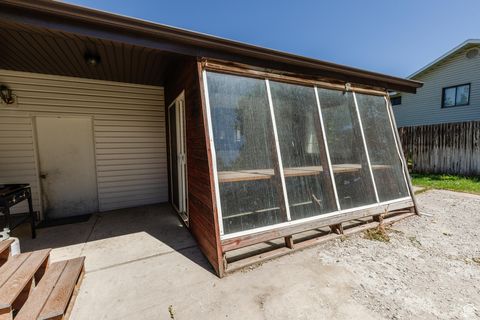
$430,000
5
bds
|
2
ba
|
2,184
sqft
|
built
1980
55 W 300 N, Hyde Park, UT 84318
$-645
Cash flow
-7.8%
Cash-on-Cash Return
3.9%
Cap rate
0.5%
Rent to Value Ratio
Active
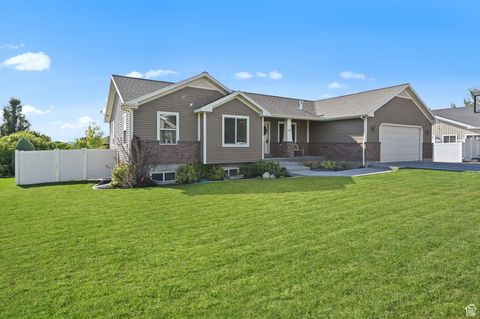
$549,900
4
bds
|
3
ba
|
2,972
sqft
|
built
1983
330 E 100 N, Hyde Park, UT 84318
$-1,044
Cash flow
-9.9%
Cash-on-Cash Return
3.4%
Cap rate
0.5%
Rent to Value Ratio
16 out of 19 properties for sale in Hyde Park, UT
Limited Results Shown
Create a free account, or log in to reveal all property listings and enjoy the complete experience.
Active
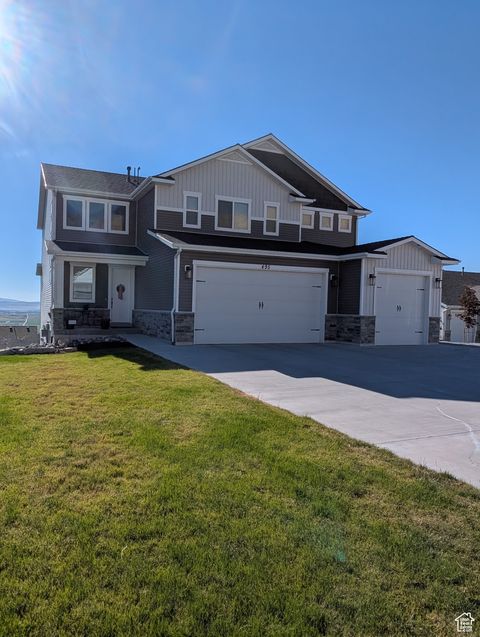
$575,000
5
bds
|
3
ba
|
3,029
sqft
|
built
2009
481 N 100 W, Hyde Park, UT 84318
$-1,574
Cash flow
-14.3%
Cash-on-Cash Return
2.4%
Cap rate
0.3%
Rent to Value Ratio
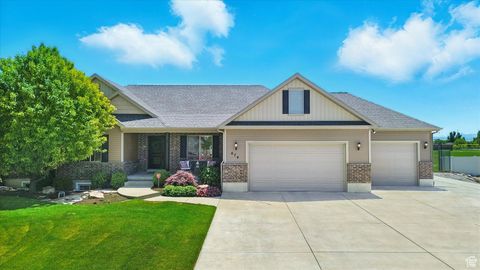
Active
$835,900
5
bds
|
4
ba
|
4,001
sqft
|
built
2021
495 N 900 E, Hyde Park, UT 84318
$-2,690
Cash flow
-16.8%
Cash-on-Cash Return
1.8%
Cap rate
0.3%
Rent to Value Ratio
Active
$729,900
4
bds
|
4
ba
|
3,580
sqft
|
built
2013
84 N 820 E, Hyde Park, UT 84318
$-1,216
Cash flow
-8.7%
Cash-on-Cash Return
3.7%
Cap rate
0.5%
Rent to Value Ratio
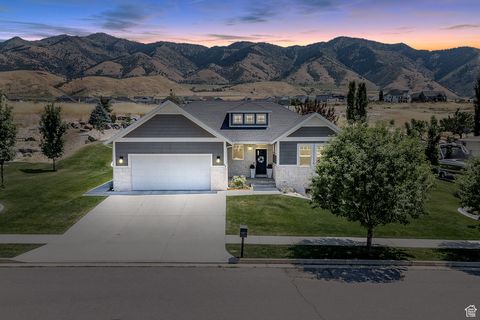
Active
$885,000
5
bds
|
5
ba
|
3,811
sqft
|
built
1995
355 N 1100 E, Hyde Park, UT 84318
$-2,061
Cash flow
-12.2%
Cash-on-Cash Return
2.9%
Cap rate
0.4%
Rent to Value Ratio
Active
$1,125,000
6
bds
|
4
ba
|
5,172
sqft
|
built
2007
531 E Center St, Hyde Park, UT 84318
$-3,481
Cash flow
-16.1%
Cash-on-Cash Return
2.0%
Cap rate
0.3%
Rent to Value Ratio
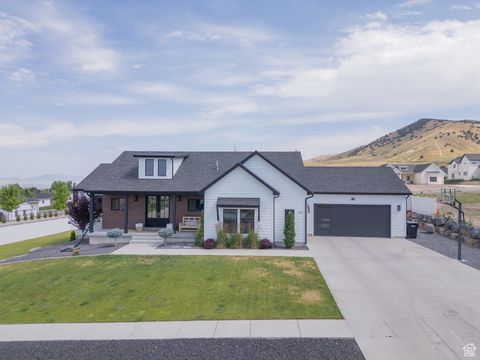
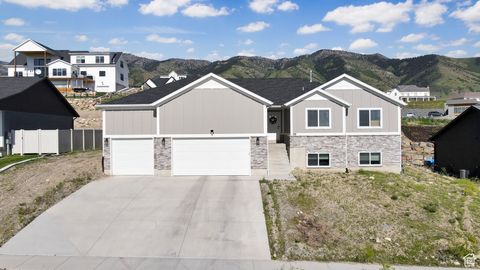
Active
$839,000
5
bds
|
4
ba
|
3,704
sqft
|
built
2020
142 N 1100 E, Hyde Park, UT 84318
$-2,692
Cash flow
-16.7%
Cash-on-Cash Return
1.8%
Cap rate
0.3%
Rent to Value Ratio
Active
$750,000
6
bds
|
3
ba
|
4,164
sqft
|
built
2009
674 S 150 W, Hyde Park, UT 84318
$-2,238
Cash flow
-15.6%
Cash-on-Cash Return
2.1%
Cap rate
0.3%
Rent to Value Ratio
Active
$599,000
5
bds
|
3
ba
|
3,220
sqft
|
built
2022
108 S 900 E, Hyde Park, UT 84318
$-1,080
Cash flow
-9.4%
Cash-on-Cash Return
3.5%
Cap rate
0.5%
Rent to Value Ratio

Active
$1,090,000
5
bds
|
6
ba
|
5,484
sqft
|
built
2022
94 S 950 E, Hyde Park, UT 84318
$-1,654
Cash flow
-7.9%
Cash-on-Cash Return
3.9%
Cap rate
0.5%
Rent to Value Ratio
Active
$694,000
3
bds
|
3
ba
|
3,770
sqft
|
built
2022
437 N 800 E, Hyde Park, UT 84318
$-2,018
Cash flow
-15.2%
Cash-on-Cash Return
2.2%
Cap rate
0.3%
Rent to Value Ratio

Active
$1,369,000
8
bds
|
5
ba
|
5,981
sqft
|
built
2017
116 N 820 E, Hyde Park, UT 84318
$-5,011
Cash flow
-19.1%
Cash-on-Cash Return
1.3%
Cap rate
0.2%
Rent to Value Ratio
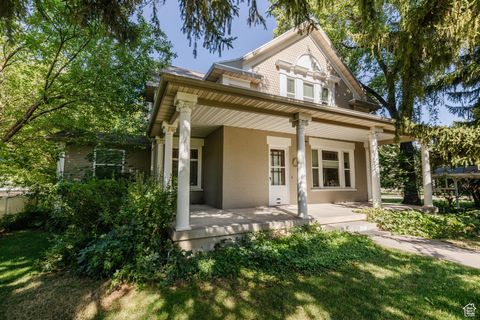
Active
$649,000
4
bds
|
3
ba
|
3,807
sqft
|
built
1910
291 N Main St, Hyde Park, UT 84318
$-1,144
Cash flow
-9.2%
Cash-on-Cash Return
3.6%
Cap rate
0.5%
Rent to Value Ratio
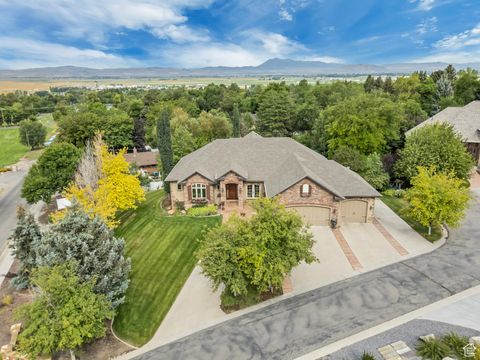
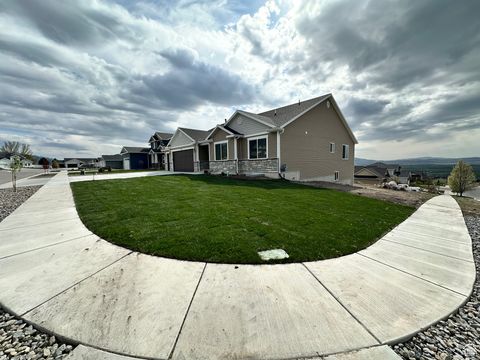
Active
$940,000
5
bds
|
3
ba
|
4,994
sqft
|
built
2021
615 N 750 E, Hyde Park, UT 84318
$-1,653
Cash flow
-9.2%
Cash-on-Cash Return
3.6%
Cap rate
0.5%
Rent to Value Ratio
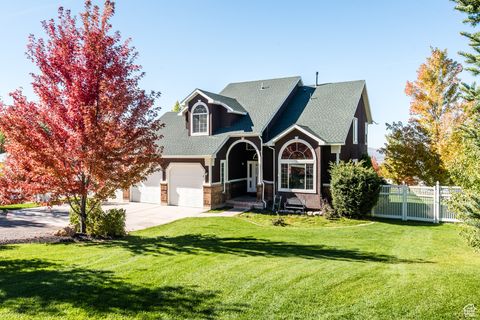
Active
$1,190,000
4
bds
|
5
ba
|
5,082
sqft
|
built
2004
898 E 260 N, Hyde Park, UT 84318
$-2,853
Cash flow
-12.5%
Cash-on-Cash Return
2.8%
Cap rate
0.4%
Rent to Value Ratio