Scott County Investment Properties for Sale
Browse homes for sale and investment properties in Scott County. Refine your search by price, property type, or more.
Best cash flowing properties in Scott County
Active
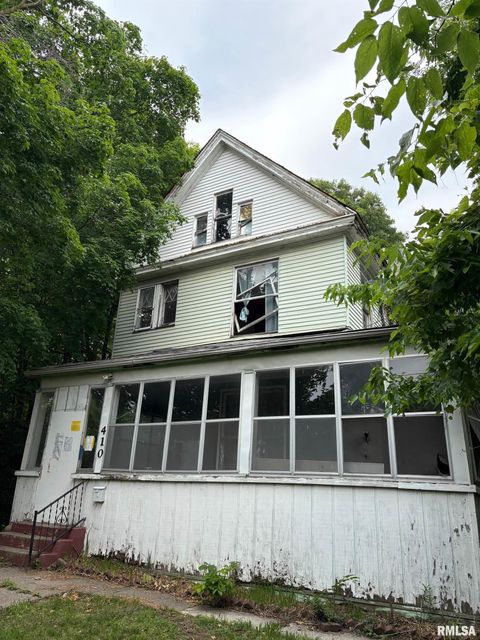
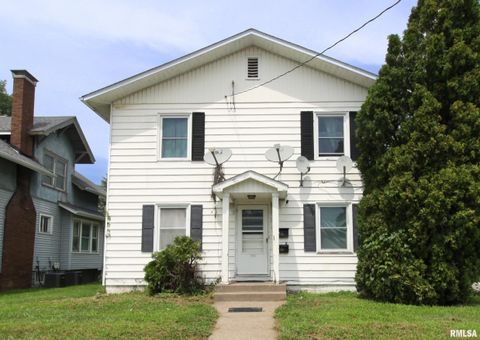
$22,500
3
bds
|
2
ba
|
3,310
sqft
|
built
1910
410 W 8th St, Davenport, IA 52803
$960
Cash flow
49.7%
Cash-on-Cash Return
51.2%
Cap rate
7.1%
Rent to Value Ratio
Active
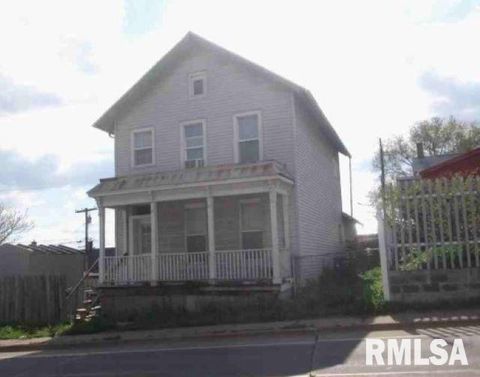
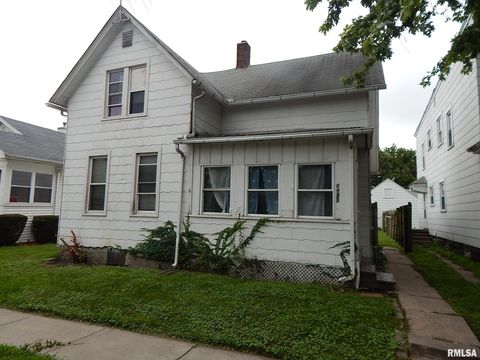
$64,680
3
bds
|
1
ba
|
1,563
sqft
|
built
1900
422 N Marquette St, Davenport, IA 52802
$571
Cash flow
10.3%
Cash-on-Cash Return
10.6%
Cap rate
1.7%
Rent to Value Ratio
166 out of 219 properties for sale in Scott County
Limited Results Shown
Create a free account, or log in to reveal all property listings and enjoy the complete experience.
Active
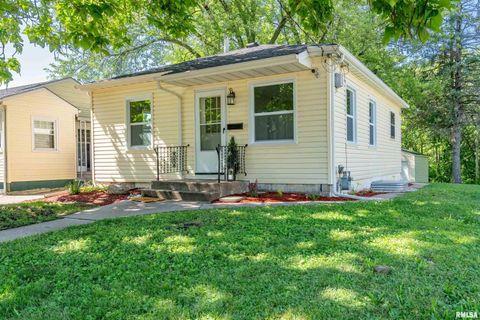
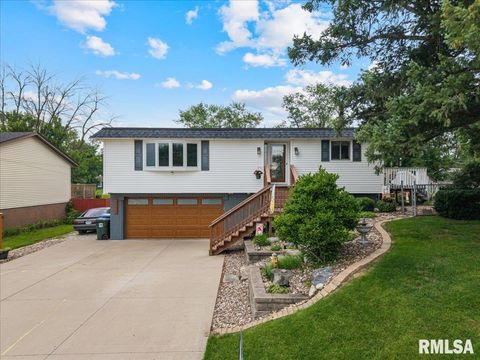
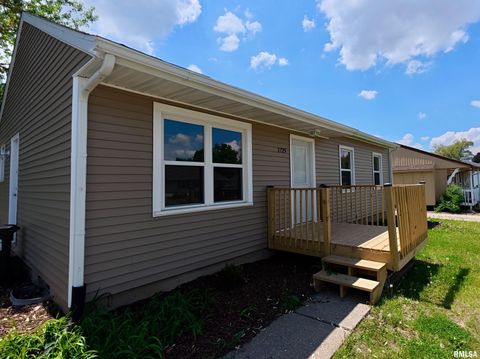
$159,900
4
bds
|
2
ba
|
1,231
sqft
|
built
1955
1814 E 13th St, Davenport, IA 52803
$5
Cash flow
0.2%
Cash-on-Cash Return
5.7%
Cap rate
0.8%
Rent to Value Ratio
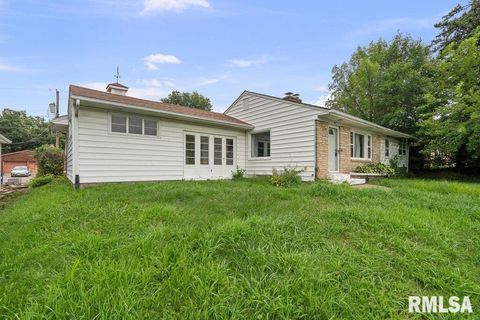
Active
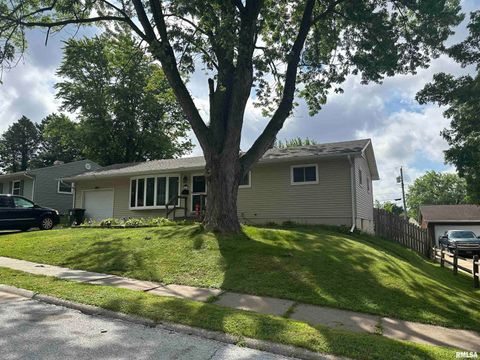
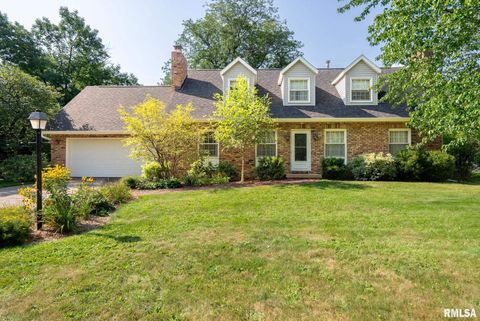
$149,900
3
bds
|
1
ba
|
1,893
sqft
|
built
1956
2633 Farragut Pl, Davenport, IA 52804
$56
Cash flow
1.9%
Cash-on-Cash Return
6.1%
Cap rate
0.9%
Rent to Value Ratio
Active
$550,000
3
bds
|
4
ba
|
3,259
sqft
|
built
1931
248 River Dr, Bettendorf, IA 52722
$-1,138
Cash flow
-10.8%
Cash-on-Cash Return
3.2%
Cap rate
0.6%
Rent to Value Ratio
Active
$245,000
3
bds
|
2
ba
|
2,240
sqft
|
built
1957
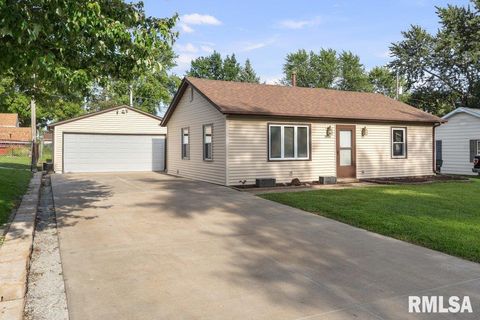
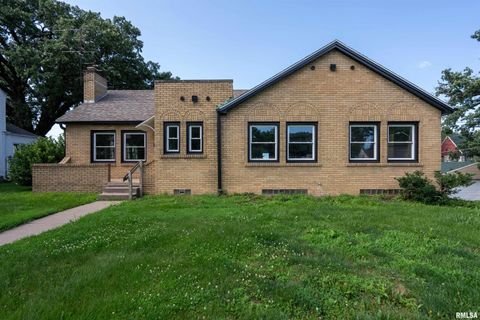
3430 W Locust St, Davenport, IA 52804
$-40
Cash flow
-0.9%
Cash-on-Cash Return
5.5%
Cap rate
0.8%
Rent to Value Ratio
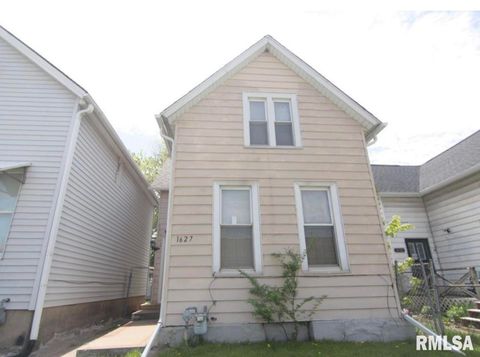
Active
$95,000
2
bds
|
1
ba
|
988
sqft
|
built
1900
1627 W 4th St, Davenport, IA 52802
$169
Cash flow
9.3%
Cash-on-Cash Return
7.8%
Cap rate
1.1%
Rent to Value Ratio
Active
$98,000
3
bds
|
0
ba
|
0
sqft
|
built
1880
415 E 7th St, Davenport, IA 52803
$93
Cash flow
5.0%
Cash-on-Cash Return
6.8%
Cap rate
1.0%
Rent to Value Ratio
Active
$245,000
3
bds
|
2
ba
|
2,306
sqft
|
built
1969
3816 Woodland Ct, Davenport, IA 52807
$39
Cash flow
0.8%
Cash-on-Cash Return
5.9%
Cap rate
0.9%
Rent to Value Ratio
Active
$339,000
4
bds
|
3
ba
|
2,650
sqft
|
built
1992
4612 Marquette St, Davenport, IA 52806
$-317
Cash flow
-4.9%
Cash-on-Cash Return
4.6%
Cap rate
0.7%
Rent to Value Ratio
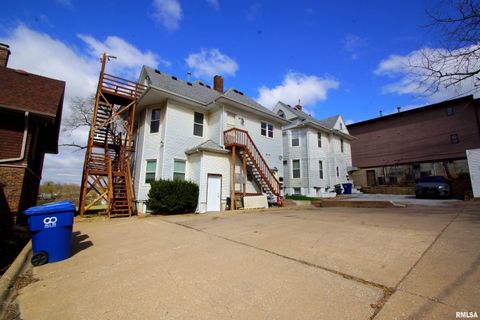
Active
$179,900
6
bds
|
0
ba
|
0
sqft
|
built
1900
707 Brady St, Davenport, IA 52803
$-167
Cash flow
-4.8%
Cash-on-Cash Return
4.6%
Cap rate
0.7%
Rent to Value Ratio
Active
$145,000
2
bds
|
1
ba
|
977
sqft
|
built
1950
3438 Taylor St, Davenport, IA 52806
$46
Cash flow
1.7%
Cash-on-Cash Return
6.1%
Cap rate
0.9%
Rent to Value Ratio
Active
$139,900
4
bds
|
0
ba
|
0
sqft
|
built
1956
1634 W 17th St, Davenport, IA 52804
$-83
Cash flow
-3.1%
Cash-on-Cash Return
5.0%
Cap rate
0.8%
Rent to Value Ratio
Active
$79,500
4
bds
|
2
ba
|
1,077
sqft
|
built
1910
1721 Madison St, Davenport, IA 52804
$334
Cash flow
21.9%
Cash-on-Cash Return
10.7%
Cap rate
1.5%
Rent to Value Ratio
Active
$259,900
3
bds
|
2
ba
|
1,786
sqft
|
built
1971
2325 N Zenith Ave, Davenport, IA 52804
$-361
Cash flow
-7.2%
Cash-on-Cash Return
4.0%
Cap rate
0.6%
Rent to Value Ratio
Active
$299,900
4
bds
|
3
ba
|
2,634
sqft
|
built
1975
2105 E 46th St, Davenport, IA 52807
$-234
Cash flow
-4.1%
Cash-on-Cash Return
4.7%
Cap rate
0.8%
Rent to Value Ratio
Active
$139,900
2
bds
|
1
ba
|
816
sqft
|
built
1954
7115 Cedar St, Davenport, IA 52806
$81
Cash flow
3.0%
Cash-on-Cash Return
6.4%
Cap rate
0.9%
Rent to Value Ratio
Active
$284,900
4
bds
|
2
ba
|
2,034
sqft
|
built
1948
922 W Lombard St, Davenport, IA 52804
$-47
Cash flow
-0.9%
Cash-on-Cash Return
5.5%
Cap rate
0.9%
Rent to Value Ratio
Active
$184,900
3
bds
|
2
ba
|
1,664
sqft
|
built
1920
2707 Arlington Ave, Davenport, IA 52803
$157
Cash flow
4.4%
Cash-on-Cash Return
6.7%
Cap rate
1.0%
Rent to Value Ratio
Active
$182,000
6
bds
|
0
ba
|
0
sqft
|
built
1976
5516 N Division St, Davenport, IA 52806
$-187
Cash flow
-5.4%
Cash-on-Cash Return
4.4%
Cap rate
0.7%
Rent to Value Ratio
Active
$232,900
3
bds
|
2
ba
|
1,425
sqft
|
built
1965
3514 Greenbrier Dr, Bettendorf, IA 52722
$-250
Cash flow
-5.6%
Cash-on-Cash Return
4.4%
Cap rate
0.7%
Rent to Value Ratio
Active
$167,000
2
bds
|
1
ba
|
900
sqft
|
built
1982
4190 Mallard Ct, Bettendorf, IA 52722
$-173
Cash flow
-5.4%
Cash-on-Cash Return
4.4%
Cap rate
0.7%
Rent to Value Ratio
Active
$214,900
3
bds
|
2
ba
|
1,786
sqft
|
built
1978
3518 Cedarview Ct, Bettendorf, IA 52722
$-140
Cash flow
-3.4%
Cash-on-Cash Return
4.9%
Cap rate
0.7%
Rent to Value Ratio
Active
$390,000
4
bds
|
3
ba
|
2,940
sqft
|
built
1998
18 Dexter Blvd, Eldridge, IA 52748
$-455
Cash flow
-6.1%
Cash-on-Cash Return
4.3%
Cap rate
0.6%
Rent to Value Ratio
Active
$389,000
5
bds
|
2
ba
|
2,336
sqft
|
built
1900
26805 255th Ave, Princeton, IA 52768
$-491
Cash flow
-6.6%
Cash-on-Cash Return
4.2%
Cap rate
0.6%
Rent to Value Ratio
Active
$419,900
4
bds
|
4
ba
|
2,987
sqft
|
built
1999
1199 Scenic Pl, Le Claire, IA 52753
$-583
Cash flow
-7.2%
Cash-on-Cash Return
4.0%
Cap rate
0.6%
Rent to Value Ratio
Active
$415,000
4
bds
|
3
ba
|
2,608
sqft
|
built
1977
4280 Newport Ct, Bettendorf, IA 52722
$37
Cash flow
0.5%
Cash-on-Cash Return
5.8%
Cap rate
0.7%
Rent to Value Ratio
Active
$159,900
2
bds
|
1
ba
|
775
sqft
|
built
1955
3505 W Lombard St, Davenport, IA 52804
$-23
Cash flow
-0.8%
Cash-on-Cash Return
5.5%
Cap rate
0.9%
Rent to Value Ratio
Active
$112,500
5
bds
|
2
ba
|
1,752
sqft
|
built
1902
1607 W 8th St, Davenport, IA 52802
$87
Cash flow
4.0%
Cash-on-Cash Return
6.6%
Cap rate
1.0%
Rent to Value Ratio
Active
$299,900
3
bds
|
3
ba
|
1,751
sqft
|
built
1978
513 S 7th St, Eldridge, IA 52748
$-197
Cash flow
-3.4%
Cash-on-Cash Return
4.9%
Cap rate
0.7%
Rent to Value Ratio
Active
$159,000
3
bds
|
2
ba
|
1,704
sqft
|
built
1910
1201 W 17th St, Davenport, IA 52804
$114
Cash flow
3.7%
Cash-on-Cash Return
6.5%
Cap rate
0.9%
Rent to Value Ratio
Active
$325,000
4
bds
|
2
ba
|
2,748
sqft
|
built
1940
21780 Great River Rd, Le Claire, IA 52753
$-389
Cash flow
-6.2%
Cash-on-Cash Return
4.2%
Cap rate
0.6%
Rent to Value Ratio
Active
$167,900
3
bds
|
1
ba
|
925
sqft
|
built
1970
1729 Welshire Dr, Davenport, IA 52806
$-224
Cash flow
-7.0%
Cash-on-Cash Return
4.1%
Cap rate
0.7%
Rent to Value Ratio
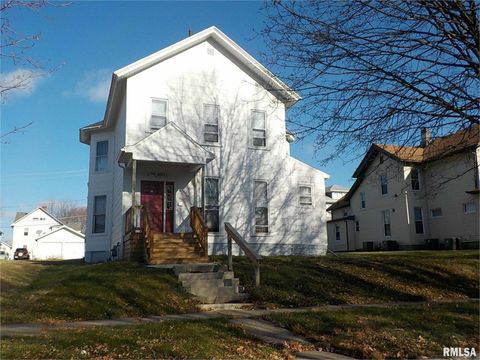
Active
$220,000
4
bds
|
0
ba
|
0
sqft
|
built
1900
705 Brady St, Davenport, IA 52803
$-323
Cash flow
-7.7%
Cash-on-Cash Return
3.9%
Cap rate
0.7%
Rent to Value Ratio
Active
$200,000
3
bds
|
1
ba
|
1,080
sqft
|
built
1952
816 Spalding Blvd, Davenport, IA 52804
$-163
Cash flow
-4.3%
Cash-on-Cash Return
4.7%
Cap rate
0.8%
Rent to Value Ratio
Active
$89,900
3
bds
|
0
ba
|
0
sqft
|
built
1900
320 E 14th St, Davenport, IA 52803
$133
Cash flow
7.7%
Cash-on-Cash Return
7.4%
Cap rate
1.2%
Rent to Value Ratio

Active
$129,900
2
bds
|
2
ba
|
1,286
sqft
|
built
1950
714 S Fairmount St, Davenport, IA 52802
$137
Cash flow
5.5%
Cash-on-Cash Return
6.9%
Cap rate
1.0%
Rent to Value Ratio
Active
$145,000
3
bds
|
1
ba
|
1,042
sqft
|
built
1895
3711 Pearl Ave, Davenport, IA 52802
$-136
Cash flow
-4.9%
Cash-on-Cash Return
4.6%
Cap rate
0.7%
Rent to Value Ratio
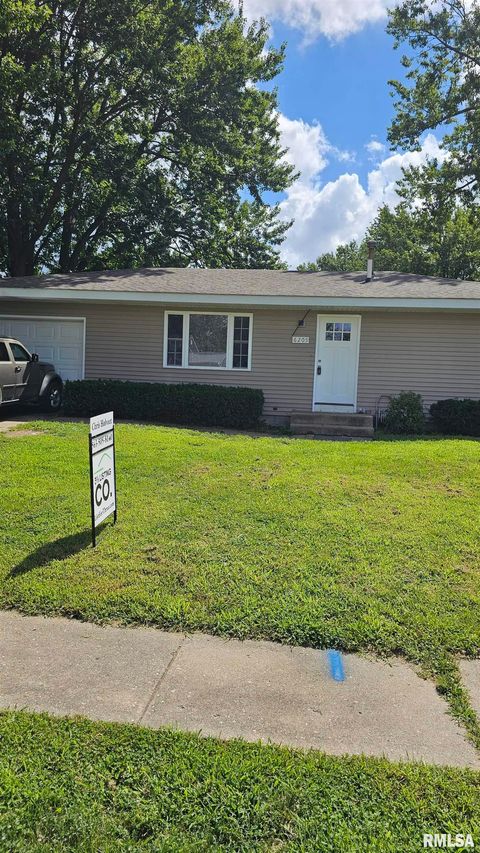
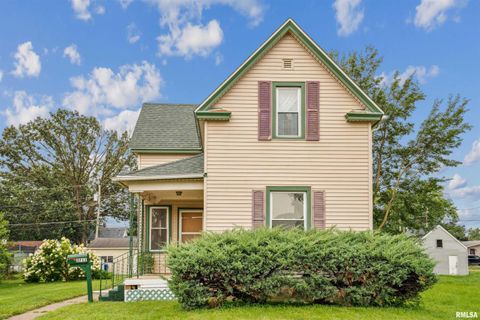
Active
$139,900
3
bds
|
1
ba
|
864
sqft
|
built
1972
6205 N Ripley St, Davenport, IA 52806
$267
Cash flow
10.0%
Cash-on-Cash Return
8.0%
Cap rate
1.1%
Rent to Value Ratio
Active
$309,900
3
bds
|
3
ba
|
1,664
sqft
|
built
1982
2511 Emerald Dr, Davenport, IA 52804
$-673
Cash flow
-11.3%
Cash-on-Cash Return
3.1%
Cap rate
0.5%
Rent to Value Ratio