De Kalb County Investment Properties for Sale
Browse homes for sale and investment properties in De Kalb County. Refine your search by price, property type, or more.
Best cash flowing properties in De Kalb County
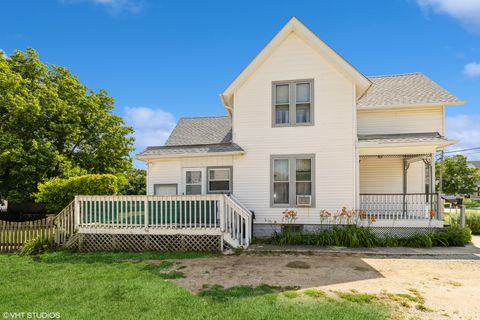
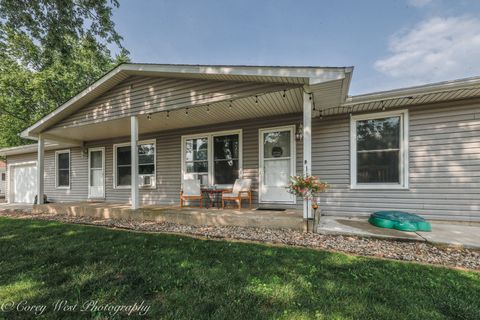
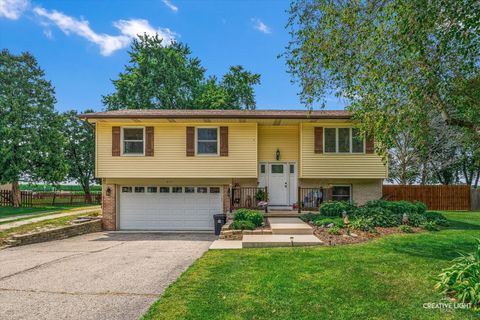
Active
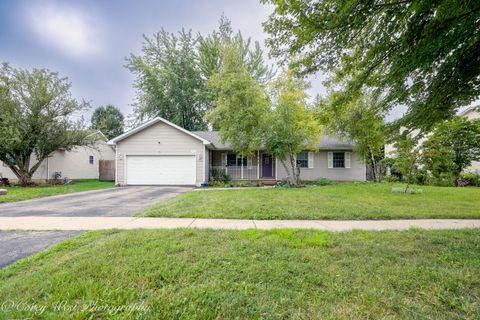
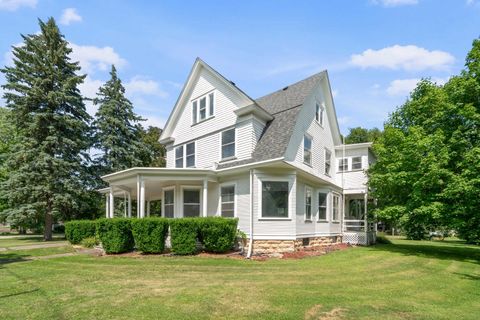
$209,000
4
bds
|
1
ba
|
1,758
sqft
|
built
211 E Main St, Genoa, IL 60135
$265
Cash flow
6.6%
Cash-on-Cash Return
7.2%
Cap rate
1.1%
Rent to Value Ratio
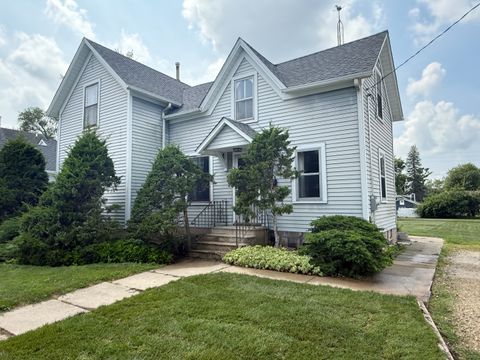
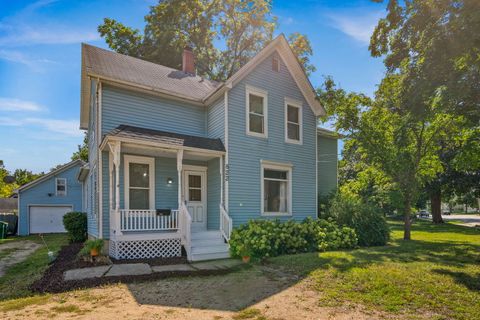
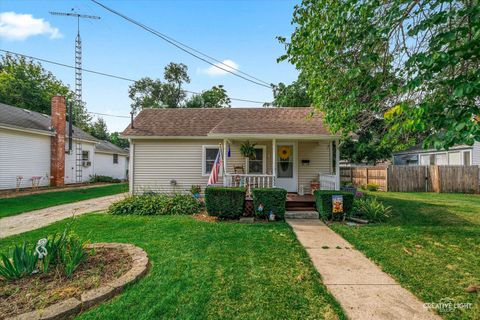
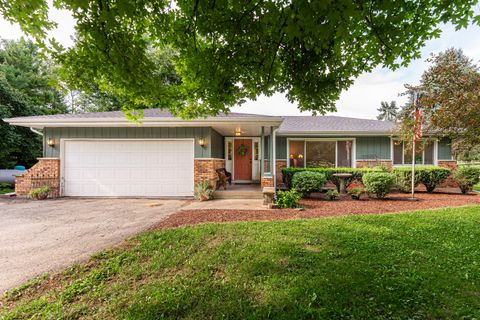
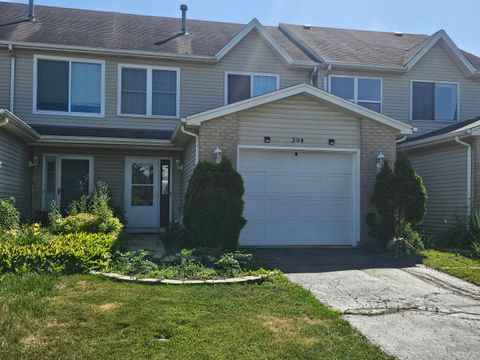
Active
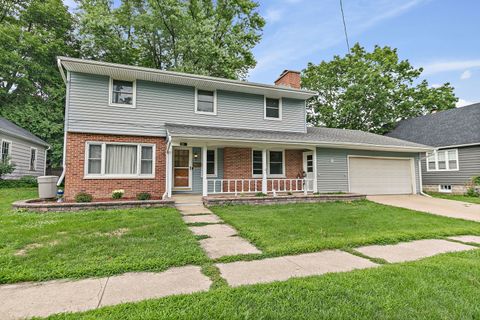
$194,900
4
bds
|
2
ba
|
1,720
sqft
|
built
1920
719 Park Ave, Sycamore, IL 60178
$120
Cash flow
3.2%
Cash-on-Cash Return
6.4%
Cap rate
1.0%
Rent to Value Ratio
46 out of 89 properties for sale in De Kalb County
Limited Results Shown
Create a free account, or log in to reveal all property listings and enjoy the complete experience.
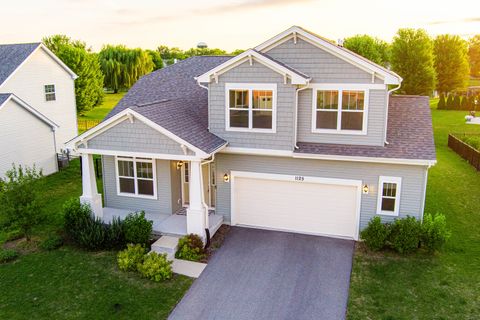
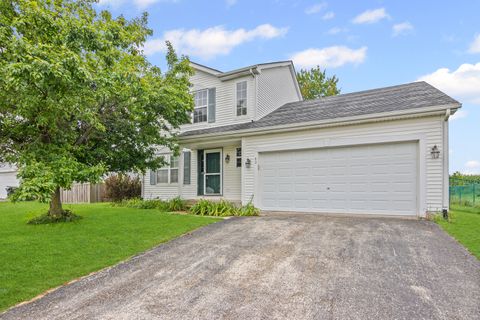
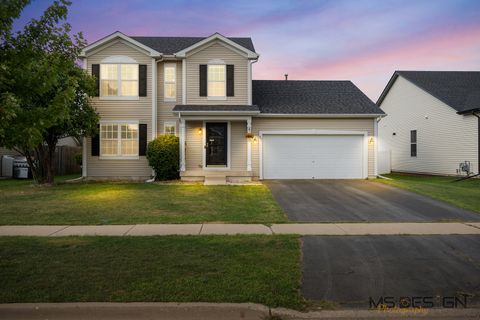
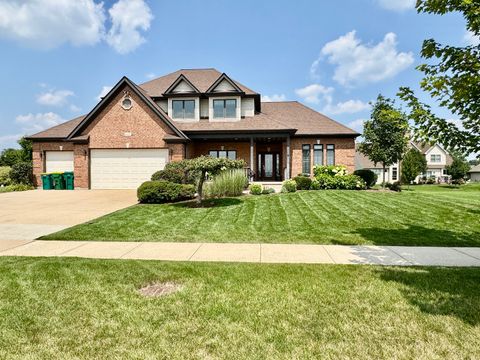
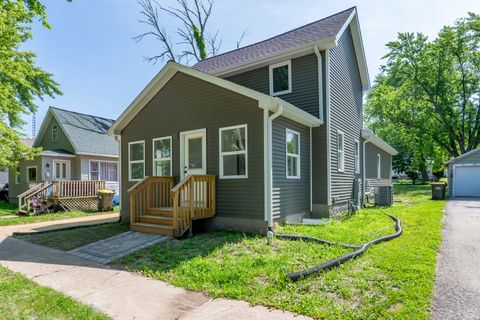
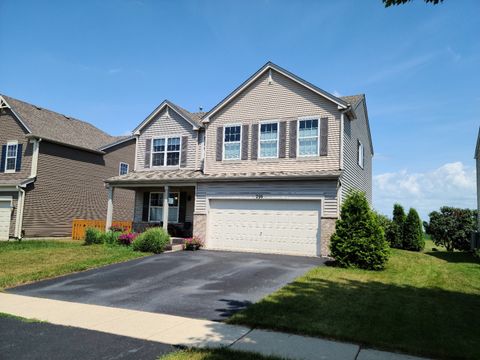
Active
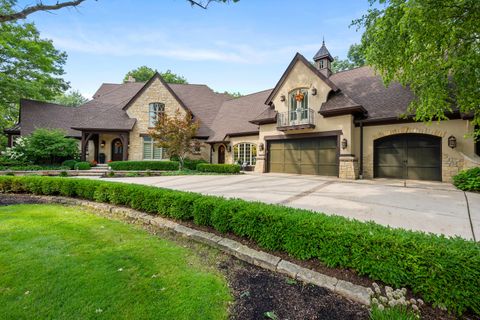
$415,000
4
bds
|
3
ba
|
2,019
sqft
|
built
2022
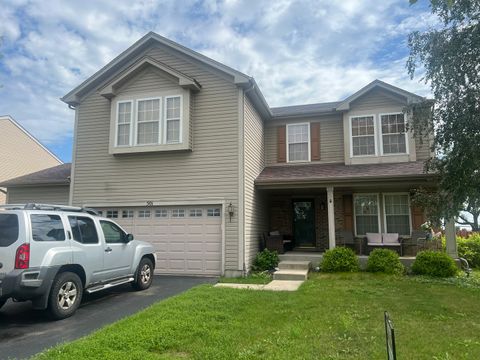
1125 Juniper Dr, Sycamore, IL 60178
$-734
Cash flow
-9.2%
Cash-on-Cash Return
3.6%
Cap rate
0.8%
Rent to Value Ratio
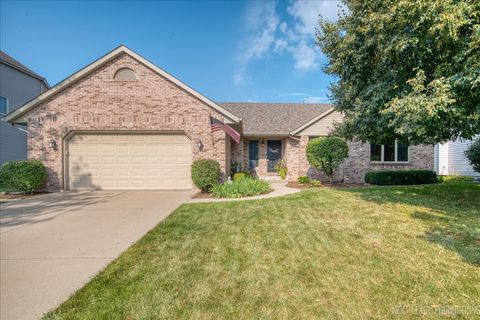
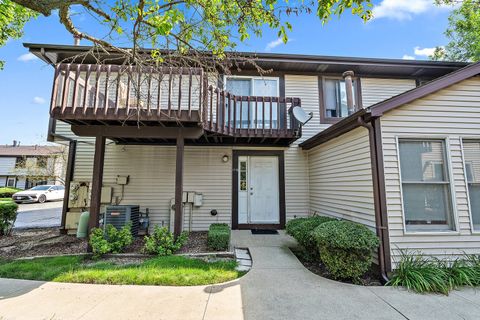
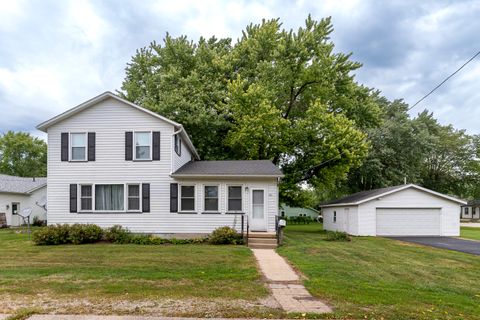
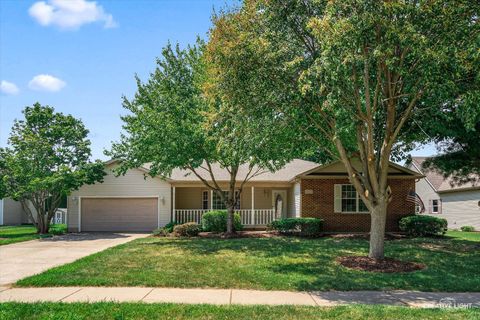
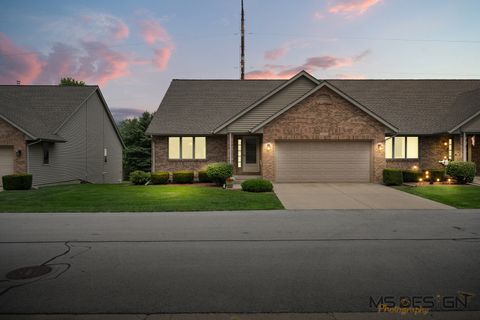
Active
$419,900
3
bds
|
3
ba
|
2,298
sqft
|
built
1998
1331 Yorkshire Dr N, Sycamore, IL 60178
$-1,010
Cash flow
-12.5%
Cash-on-Cash Return
2.8%
Cap rate
0.6%
Rent to Value Ratio
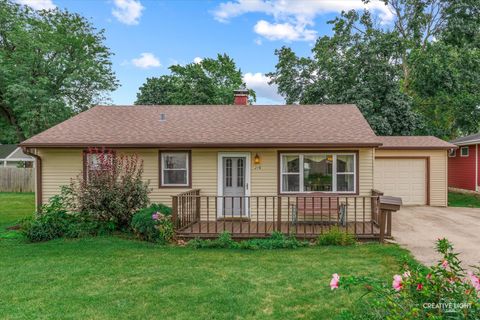
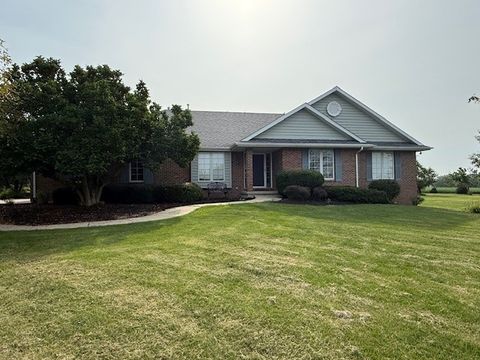
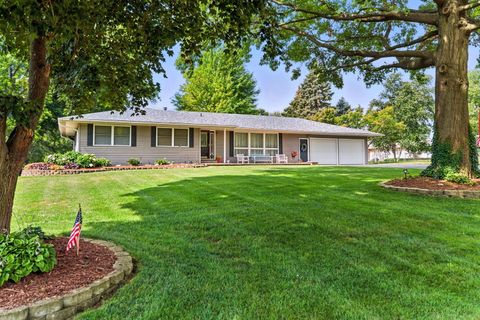
Active
$295,000
3
bds
|
3
ba
|
1,500
sqft
|
built
2002
42 W Auburndale Ave, Cortland, IL 60112
$-281
Cash flow
-5.0%
Cash-on-Cash Return
4.5%
Cap rate
0.8%
Rent to Value Ratio
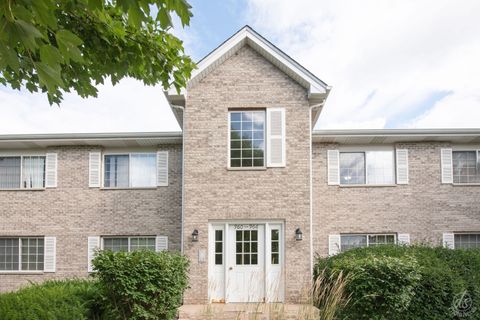
Active
$187,900
3
bds
|
1
ba
|
1,056
sqft
|
built
1977
1715 Cedarbrook Ct, Sycamore, IL 60178
$-128
Cash flow
-3.6%
Cash-on-Cash Return
4.9%
Cap rate
1.0%
Rent to Value Ratio
Active
$225,000
3
bds
|
1
ba
|
912
sqft
|
built
316 W 5th St, Sandwich, IL 60548
$-111
Cash flow
-2.6%
Cash-on-Cash Return
5.1%
Cap rate
0.8%
Rent to Value Ratio
Active
$184,900
2
bds
|
2
ba
|
1,220
sqft
|
built
1997
966 Constance Ln, Sycamore, IL 60178
$-138
Cash flow
-3.9%
Cash-on-Cash Return
4.8%
Cap rate
1.0%
Rent to Value Ratio
Active
$350,000
3
bds
|
2
ba
|
0
sqft
|
built
1996
134 Brian St, Sycamore, IL 60178
$-537
Cash flow
-8.0%
Cash-on-Cash Return
3.8%
Cap rate
0.7%
Rent to Value Ratio
Active
$339,800
4
bds
|
3
ba
|
1,980
sqft
|
built
1965
211 E Ottawa St, Sycamore, IL 60178
$-341
Cash flow
-5.2%
Cash-on-Cash Return
4.5%
Cap rate
0.8%
Rent to Value Ratio
Active
$1,299,000
4
bds
|
8
ba
|
8,440
sqft
|
built
2009
361 Merry Oaks Dr, Sycamore, IL 60178
$-3,699
Cash flow
-14.9%
Cash-on-Cash Return
2.3%
Cap rate
0.5%
Rent to Value Ratio
Active
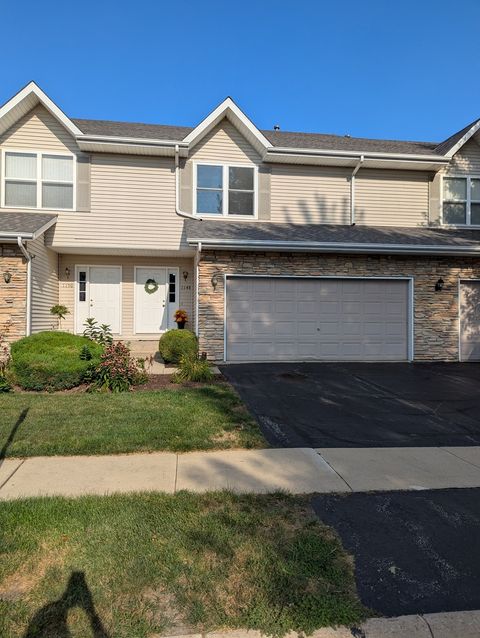
$249,900
2
bds
|
4
ba
|
1,778
sqft
|
built
2005
1148 Rose Dr, Sycamore, IL 60178
$-265
Cash flow
-5.5%
Cash-on-Cash Return
4.4%
Cap rate
0.9%
Rent to Value Ratio
Active
$314,900
6
bds
|
3
ba
|
0
sqft
|
built
1962
1509 Oak Ln, Sycamore, IL 60178
$-237
Cash flow
-3.9%
Cash-on-Cash Return
4.8%
Cap rate
0.8%
Rent to Value Ratio
Active
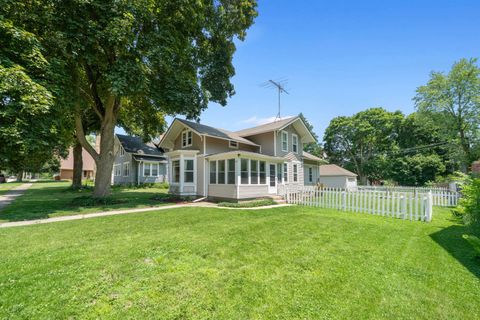
$225,000
4
bds
|
2
ba
|
2,150
sqft
|
built
1900
822 Dekalb Ave, Sycamore, IL 60178
$95
Cash flow
2.2%
Cash-on-Cash Return
6.2%
Cap rate
1.1%
Rent to Value Ratio
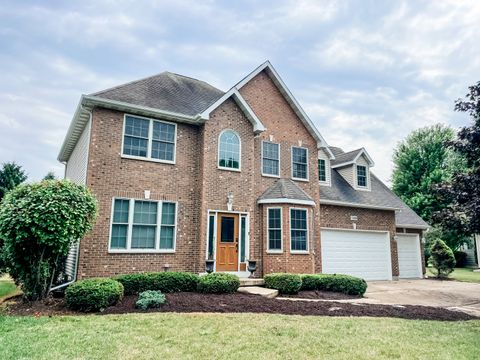
Active
$325,000
3
bds
|
3
ba
|
1,868
sqft
|
built
2007
87 W Crabapple Ave, Cortland, IL 60112
$-474
Cash flow
-7.6%
Cash-on-Cash Return
3.9%
Cap rate
0.8%
Rent to Value Ratio
Active
$249,000
3
bds
|
2
ba
|
1,700
sqft
|
built
507 W 1st St, Sandwich, IL 60548
$-672
Cash flow
-14.1%
Cash-on-Cash Return
2.4%
Cap rate
0.5%
Rent to Value Ratio
Active
$379,900
3
bds
|
2
ba
|
1,522
sqft
|
built
2005
214 Stearn Dr, Genoa, IL 60135
$-589
Cash flow
-8.1%
Cash-on-Cash Return
3.8%
Cap rate
0.7%
Rent to Value Ratio
Active
$424,900
3
bds
|
3
ba
|
2,000
sqft
|
built
2002
475 John Marshall Ln, Sycamore, IL 60178
$-1,178
Cash flow
-14.5%
Cash-on-Cash Return
2.4%
Cap rate
0.6%
Rent to Value Ratio
Active
$250,000
3
bds
|
3
ba
|
1,620
sqft
|
built
1970
245 S Somonauk Rd, Cortland, IL 60112
$-247
Cash flow
-5.2%
Cash-on-Cash Return
4.5%
Cap rate
0.8%
Rent to Value Ratio
Active
$474,900
4
bds
|
3
ba
|
3,400
sqft
|
built
1850
100 E Miller Ave, Hinckley, IL 60520
$-497
Cash flow
-5.5%
Cash-on-Cash Return
4.4%
Cap rate
0.8%
Rent to Value Ratio
Active
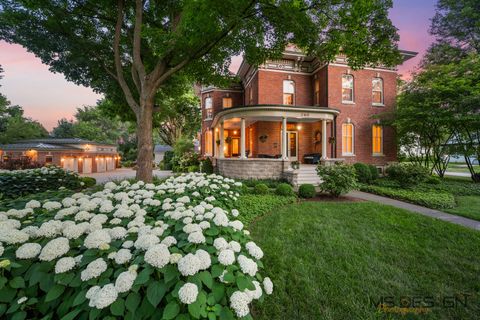
$595,000
4
bds
|
4
ba
|
2,600
sqft
|
built
2007
607 Emanuel Ln, Sycamore, IL 60178
$-998
Cash flow
-8.8%
Cash-on-Cash Return
3.7%
Cap rate
0.7%
Rent to Value Ratio
Active
$215,000
2
bds
|
1
ba
|
815
sqft
|
built
332 W 1st St, Sandwich, IL 60548
$-277
Cash flow
-6.7%
Cash-on-Cash Return
4.1%
Cap rate
0.7%
Rent to Value Ratio
Active
$435,000
3
bds
|
3
ba
|
1,852
sqft
|
built
1995
712 S Moccasin Dr, Shabbona, IL 60550
$-1,229
Cash flow
-14.7%
Cash-on-Cash Return
2.3%
Cap rate
0.5%
Rent to Value Ratio
Active
$354,900
3
bds
|
3
ba
|
1,636
sqft
|
built
2000
1333 Anthony Ln, Sandwich, IL 60548
$-561
Cash flow
-8.2%
Cash-on-Cash Return
3.8%
Cap rate
0.6%
Rent to Value Ratio
Active
$380,000
3
bds
|
3
ba
|
1,600
sqft
|
built
1969
1623 Vale St, Sandwich, IL 60548
$-917
Cash flow
-12.6%
Cash-on-Cash Return
2.8%
Cap rate
0.5%
Rent to Value Ratio
Active
$739,000
3
bds
|
2
ba
|
1,700
sqft
|
built
1976
17751 Scott Rd, Hinckley, IL 60520
$-2,451
Cash flow
-17.3%
Cash-on-Cash Return
1.7%
Cap rate
0.3%
Rent to Value Ratio
Active
$469,000
2
bds
|
4
ba
|
3,160
sqft
|
built
128 N Brown St, Genoa, IL 60135
$-1,074
Cash flow
-11.9%
Cash-on-Cash Return
2.9%
Cap rate
0.4%
Rent to Value Ratio
Active
$330,000
2
bds
|
2
ba
|
1,683
sqft
|
built
1993
1123 Milan Dr N, Sycamore, IL 60178
$-672
Cash flow
-10.6%
Cash-on-Cash Return
3.2%
Cap rate
0.8%
Rent to Value Ratio
Active
$320,000
3
bds
|
3
ba
|
2,861
sqft
|
built
2006
501 E Garfield St, Waterman, IL 60556
$-200
Cash flow
-3.3%
Cash-on-Cash Return
4.9%
Cap rate
0.8%
Rent to Value Ratio
Active
$725,000
5
bds
|
3
ba
|
4,913
sqft
|
built
1873
740 W State St, Sycamore, IL 60178
$-2,962
Cash flow
-21.3%
Cash-on-Cash Return
0.8%
Cap rate
0.4%
Rent to Value Ratio
Active
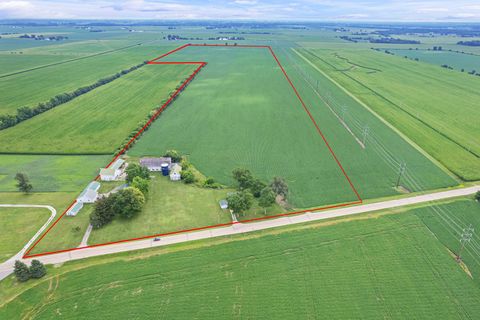
$2,250,000
4
bds
|
2
ba
|
2,362
sqft
|
built
1918
3720 W Sandwich Rd, Sandwich, IL 60548
$-10,029
Cash flow
-23.3%
Cash-on-Cash Return
0.3%
Cap rate
0.1%
Rent to Value Ratio
Active
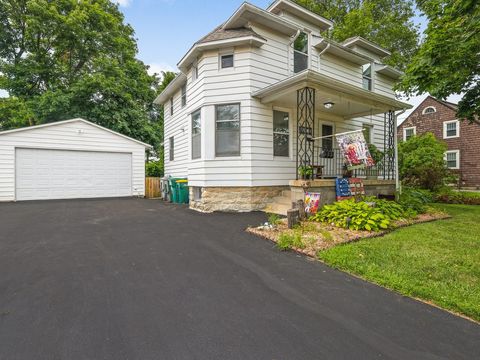
$289,900
4
bds
|
1
ba
|
1,744
sqft
|
built
1900
250 Edward St, Sycamore, IL 60178
$-390
Cash flow
-7.0%
Cash-on-Cash Return
4.1%
Cap rate
0.7%
Rent to Value Ratio
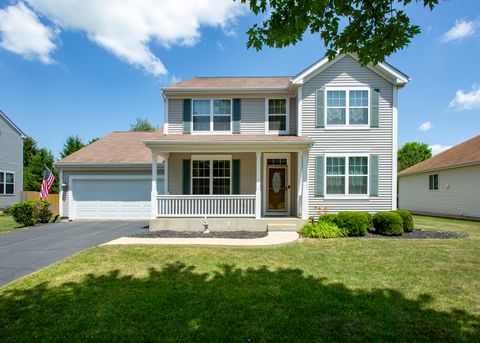
Active
$334,900
3
bds
|
4
ba
|
1,780
sqft
|
built
2005
296 N Cardinal St, Cortland, IL 60112
$-782
Cash flow
-12.2%
Cash-on-Cash Return
2.9%
Cap rate
0.7%
Rent to Value Ratio
Active
$398,000
3
bds
|
3
ba
|
1,750
sqft
|
built
1974
14692 Hiawatha Ln, Somonauk, IL 60552
$-1,074
Cash flow
-14.1%
Cash-on-Cash Return
2.4%
Cap rate
0.5%
Rent to Value Ratio
Active
$449,900
4
bds
|
3
ba
|
3,672
sqft
|
built
2005
1308 Axcel Ln, Sycamore, IL 60178
$-1,492
Cash flow
-17.3%
Cash-on-Cash Return
1.7%
Cap rate
0.5%
Rent to Value Ratio
Active
$414,888
5
bds
|
3
ba
|
3,214
sqft
|
built
2007
220 Stearn Dr, Genoa, IL 60135
$-505
Cash flow
-6.4%
Cash-on-Cash Return
4.2%
Cap rate
0.8%
Rent to Value Ratio
Active
$289,000
4
bds
|
2
ba
|
2,600
sqft
|
built
1902
205 S Gage St, Somonauk, IL 60552
$-690
Cash flow
-12.5%
Cash-on-Cash Return
2.8%
Cap rate
0.6%
Rent to Value Ratio
Active
$213,000
2
bds
|
3
ba
|
1,200
sqft
|
built
1996
904 N Oak Creek Dr, Genoa, IL 60135
$-72
Cash flow
-1.8%
Cash-on-Cash Return
5.3%
Cap rate
0.8%
Rent to Value Ratio
Active
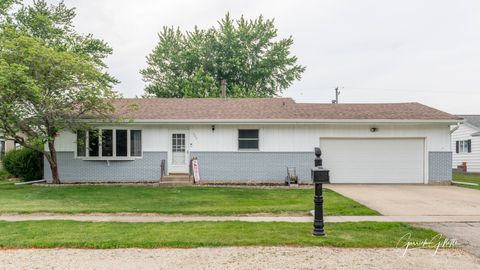
$219,000
4
bds
|
1
ba
|
1,450
sqft
|
built
220 N Cedar St, Waterman, IL 60556
$80
Cash flow
1.9%
Cash-on-Cash Return
6.1%
Cap rate
0.9%
Rent to Value Ratio
Active
$290,000
3
bds
|
2
ba
|
1,700
sqft
|
built
1998
423 N Pine St, Waterman, IL 60556
$-232
Cash flow
-4.2%
Cash-on-Cash Return
4.7%
Cap rate
0.8%
Rent to Value Ratio