La Salle County Investment Properties for Sale
Browse homes for sale and investment properties in La Salle County. Refine your search by price, property type, or more.
Best cash flowing properties in La Salle County
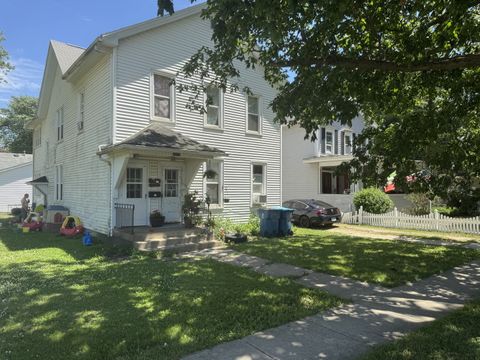
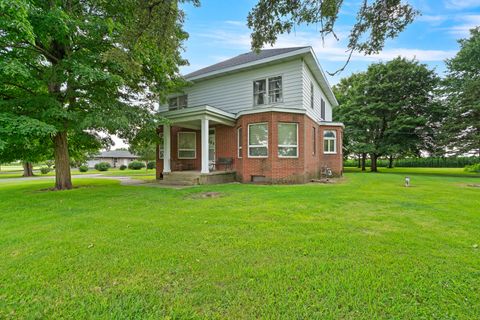
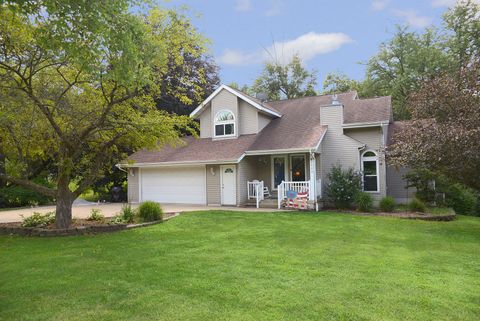
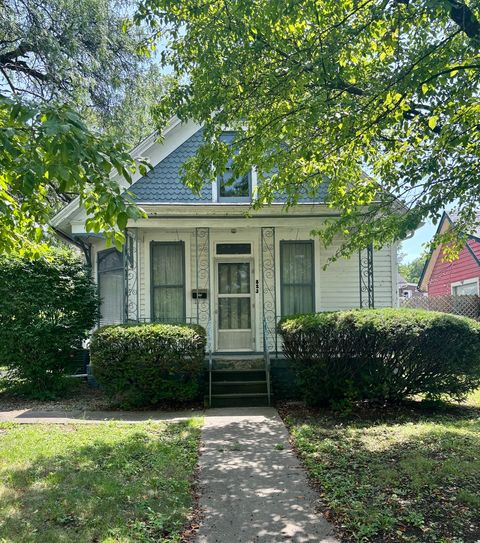
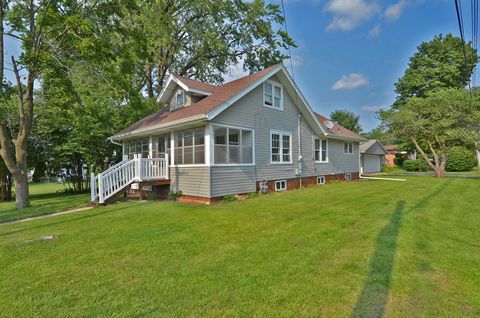
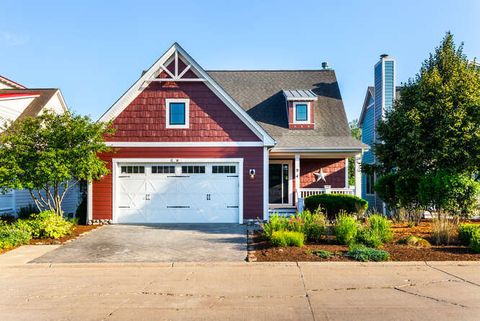
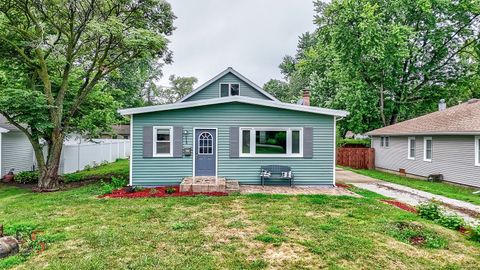
Active
$155,000
7
bds
|
2
ba
|
0
sqft
|
built
1870
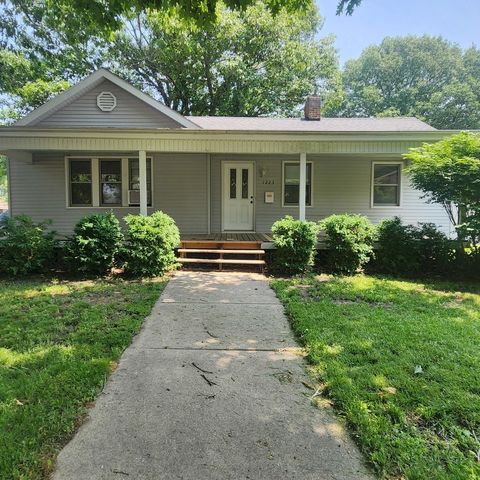
611 13th Ave, Mendota, IL 61342
$368
Cash flow
12.4%
Cash-on-Cash Return
8.5%
Cap rate
1.1%
Rent to Value Ratio
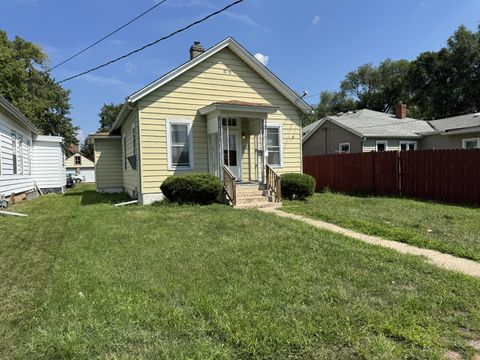
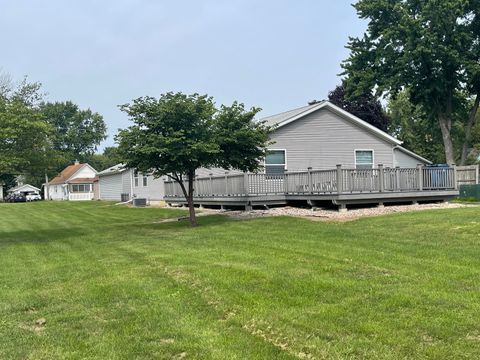
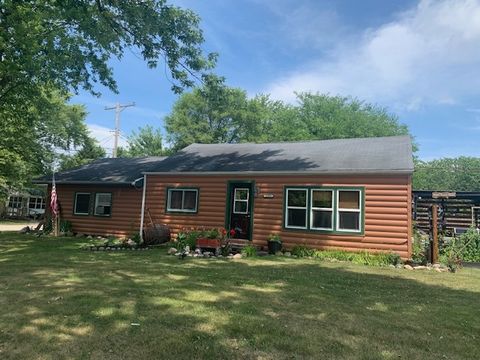
Active
$120,000
2
bds
|
1
ba
|
1,312
sqft
|
built
1979
2063 N 35th Rd, Ottawa, IL 61350
$305
Cash flow
13.3%
Cash-on-Cash Return
8.7%
Cap rate
1.1%
Rent to Value Ratio
84 out of 181 properties for sale in La Salle County
Limited Results Shown
Create a free account, or log in to reveal all property listings and enjoy the complete experience.
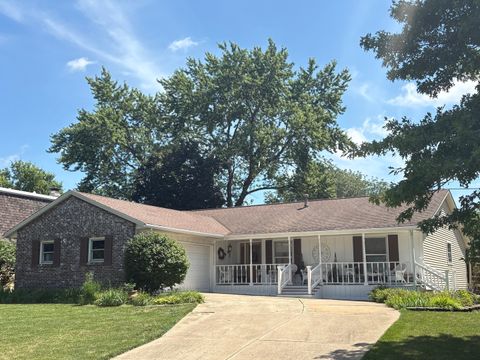
Active
$165,000
1
bds
|
2
ba
|
904
sqft
|
built
1950
645 Cornell St, Ottawa, IL 61350
$-211
Cash flow
-6.7%
Cash-on-Cash Return
4.1%
Cap rate
0.8%
Rent to Value Ratio
Active
$263,900
3
bds
|
2
ba
|
1,196
sqft
|
built
1963
609 9th Ave, Ottawa, IL 61350
$-372
Cash flow
-7.4%
Cash-on-Cash Return
4.0%
Cap rate
0.6%
Rent to Value Ratio
Active
$299,900
5
bds
|
2
ba
|
3,574
sqft
|
built
1940
3307 N State Route 23, Ottawa, IL 61350
$-446
Cash flow
-7.8%
Cash-on-Cash Return
3.9%
Cap rate
0.7%
Rent to Value Ratio
Active
$79,500
2
bds
|
1
ba
|
788
sqft
|
built
1936
1118 W Jackson St, Ottawa, IL 61350
$234
Cash flow
15.4%
Cash-on-Cash Return
9.2%
Cap rate
1.5%
Rent to Value Ratio
Active
$159,900
3
bds
|
2
ba
|
1,471
sqft
|
built
1890
537 2nd Ave, Ottawa, IL 61350
$-76
Cash flow
-2.5%
Cash-on-Cash Return
5.1%
Cap rate
1.0%
Rent to Value Ratio
Active
$380,000
2
bds
|
4
ba
|
1,800
sqft
|
built
2022
100 Great Loop Dr, Ottawa, IL 61350
$-1,252
Cash flow
-17.2%
Cash-on-Cash Return
1.7%
Cap rate
0.6%
Rent to Value Ratio
Active
$199,000
3
bds
|
2
ba
|
1,350
sqft
|
built
2005
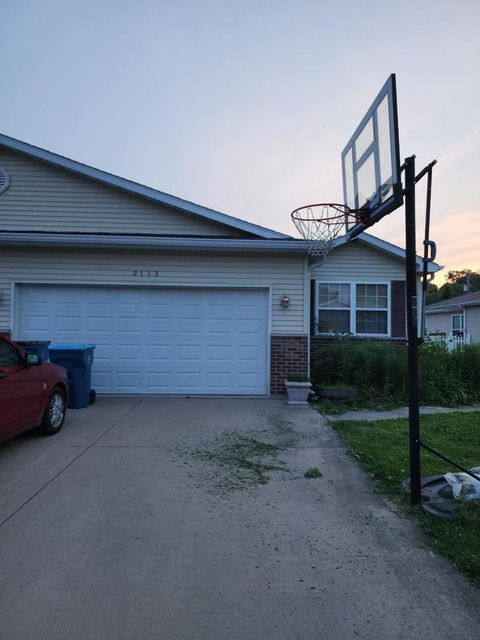
2113 Mary Ln, Ottawa, IL 61350
$-186
Cash flow
-4.9%
Cash-on-Cash Return
4.6%
Cap rate
0.9%
Rent to Value Ratio
Active
$167,000
2
bds
|
1
ba
|
1,080
sqft
|
built
1998
2117 Fox Chase Dr, Ottawa, IL 61350
$-244
Cash flow
-7.6%
Cash-on-Cash Return
3.9%
Cap rate
0.8%
Rent to Value Ratio
Active
$145,000
3
bds
|
1
ba
|
900
sqft
|
built
1946
148 E Fremont St, Ottawa, IL 61350
$8
Cash flow
0.3%
Cash-on-Cash Return
5.7%
Cap rate
0.9%
Rent to Value Ratio
Active
$175,000
3
bds
|
2
ba
|
1,170
sqft
|
built
1900
584 Broadway St, Marseilles, IL 61341
$-102
Cash flow
-3.0%
Cash-on-Cash Return
5.0%
Cap rate
0.7%
Rent to Value Ratio
Active
$399,999
4
bds
|
4
ba
|
2,316
sqft
|
built
1994
2520 Champlain St, Ottawa, IL 61350
$-1,217
Cash flow
-15.9%
Cash-on-Cash Return
2.0%
Cap rate
0.5%
Rent to Value Ratio
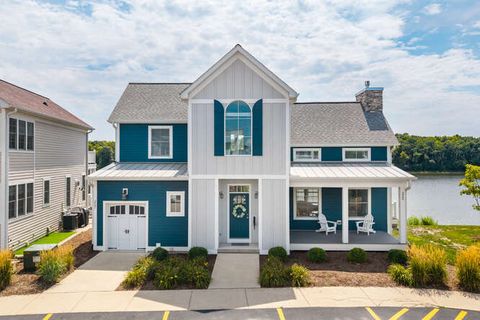
Active
$699,000
3
bds
|
3
ba
|
2,400
sqft
|
built
2021
215 Leeward Way, Ottawa, IL 61350
$-3,501
Cash flow
-26.1%
Cash-on-Cash Return
-0.3%
Cap rate
0.4%
Rent to Value Ratio
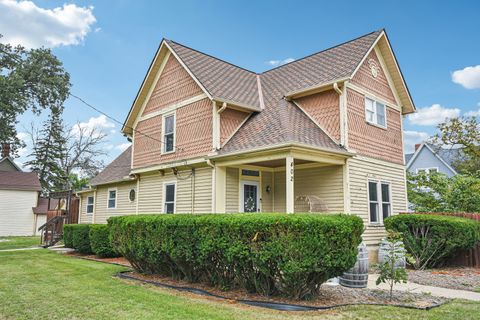
Active
$229,900
2
bds
|
2
ba
|
1,550
sqft
|
built
1893
402 E Van Buren St, Ottawa, IL 61350
$-349
Cash flow
-7.9%
Cash-on-Cash Return
3.9%
Cap rate
0.7%
Rent to Value Ratio
Active
$128,000
3
bds
|
1
ba
|
1,259
sqft
|
built
1918
1409 Pulaski St, Peru, IL 61354
$220
Cash flow
9.0%
Cash-on-Cash Return
7.7%
Cap rate
1.3%
Rent to Value Ratio
Active
$110,000
2
bds
|
1
ba
|
1,203
sqft
|
built
1891
823 W Madison St, Ottawa, IL 61350
$169
Cash flow
8.0%
Cash-on-Cash Return
7.5%
Cap rate
1.3%
Rent to Value Ratio
Active
$229,900
3
bds
|
2
ba
|
1,749
sqft
|
built
2001
1832 La Salle St, Ottawa, IL 61350
$-280
Cash flow
-6.4%
Cash-on-Cash Return
4.2%
Cap rate
0.8%
Rent to Value Ratio
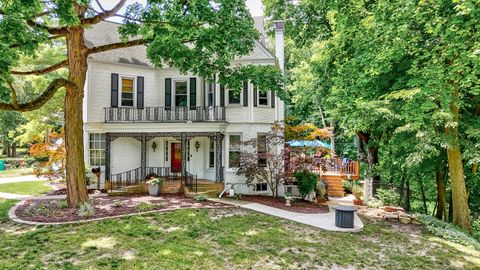
Active
$319,000
4
bds
|
4
ba
|
3,569
sqft
|
built
1870
202 Pleasant Ave, Streator, IL 61364
$-806
Cash flow
-13.2%
Cash-on-Cash Return
2.6%
Cap rate
0.6%
Rent to Value Ratio
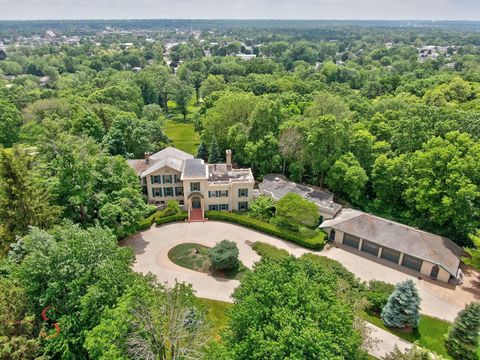
Active
$1,500,000
5
bds
|
5
ba
|
5,050
sqft
|
built
1842
2011 Caton Rd, Ottawa, IL 61350
$-8,162
Cash flow
-28.4%
Cash-on-Cash Return
-0.9%
Cap rate
0.1%
Rent to Value Ratio
Active
$225,000
4
bds
|
1
ba
|
1,518
sqft
|
built
1925
760 Guthrie St, Ottawa, IL 61350
$-528
Cash flow
-12.2%
Cash-on-Cash Return
2.9%
Cap rate
0.6%
Rent to Value Ratio
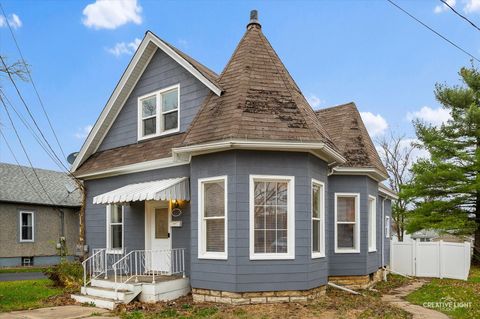
Active
$136,900
2
bds
|
1
ba
|
701
sqft
|
built
1926
1617 Pine St, Ottawa, IL 61350
$-115
Cash flow
-4.4%
Cash-on-Cash Return
4.7%
Cap rate
0.8%
Rent to Value Ratio
Active
$799,000
3
bds
|
3
ba
|
3,114
sqft
|
built
2017
17 Windward Way, Ottawa, IL 61350
$-4,375
Cash flow
-28.6%
Cash-on-Cash Return
-0.9%
Cap rate
0.3%
Rent to Value Ratio
Active
$112,900
2
bds
|
1
ba
|
850
sqft
|
built
1893
1038 Wright St, La Salle, IL 61301
$54
Cash flow
2.5%
Cash-on-Cash Return
6.2%
Cap rate
1.1%
Rent to Value Ratio
Active
$615,000
3
bds
|
3
ba
|
2,160
sqft
|
built
2010
9 Windward Way, Ottawa, IL 61350
$-3,425
Cash flow
-29.1%
Cash-on-Cash Return
-1.0%
Cap rate
0.3%
Rent to Value Ratio
Active
$330,000
4
bds
|
3
ba
|
1,650
sqft
|
built
1972
753 Fort St, Ottawa, IL 61350
$-799
Cash flow
-12.6%
Cash-on-Cash Return
2.8%
Cap rate
0.5%
Rent to Value Ratio
Active
$299,900
4
bds
|
3
ba
|
1,928
sqft
|
built
1962
515 4th St, Earlville, IL 60518
$-516
Cash flow
-9.0%
Cash-on-Cash Return
3.6%
Cap rate
0.6%
Rent to Value Ratio
Active
$359,000
4
bds
|
3
ba
|
2,300
sqft
|
built
2024
1845 La Salle St, Ottawa, IL 61350
$-319
Cash flow
-4.6%
Cash-on-Cash Return
4.6%
Cap rate
0.6%
Rent to Value Ratio
Active
$205,000
4
bds
|
2
ba
|
1,232
sqft
|
built
1940
913 Marcy St, Ottawa, IL 61350
$-106
Cash flow
-2.7%
Cash-on-Cash Return
5.1%
Cap rate
0.9%
Rent to Value Ratio
Active
$189,500
3
bds
|
1
ba
|
1,200
sqft
|
built
1940
2102 Franklin Ave, Ottawa, IL 61350
$-275
Cash flow
-7.6%
Cash-on-Cash Return
3.9%
Cap rate
0.7%
Rent to Value Ratio
Active
$229,900
3
bds
|
2
ba
|
1,595
sqft
|
built
1966
1331 W Washington St, Ottawa, IL 61350
$-311
Cash flow
-7.1%
Cash-on-Cash Return
4.1%
Cap rate
0.8%
Rent to Value Ratio
Active
$259,900
3
bds
|
3
ba
|
2,338
sqft
|
built
1967
1819 Boyce Ln, Ottawa, IL 61350
$-558
Cash flow
-11.2%
Cash-on-Cash Return
3.1%
Cap rate
0.7%
Rent to Value Ratio
Active
$1,300,000
3
bds
|
6
ba
|
4,217
sqft
|
built
2002
12 Gunia Ave, Peru, IL 61354
$-5,691
Cash flow
-22.8%
Cash-on-Cash Return
0.4%
Cap rate
0.3%
Rent to Value Ratio
Active
$223,500
4
bds
|
2
ba
|
1,760
sqft
|
built
1957
1217 Retz Dr, Ottawa, IL 61350
$-267
Cash flow
-6.2%
Cash-on-Cash Return
4.2%
Cap rate
0.8%
Rent to Value Ratio
Active
$129,500
2
bds
|
1
ba
|
816
sqft
|
built
1948
907 Polk St, Streator, IL 61364
$-286
Cash flow
-11.5%
Cash-on-Cash Return
3.0%
Cap rate
0.6%
Rent to Value Ratio
Active
$248,000
3
bds
|
2
ba
|
1,801
sqft
|
built
1896
718 Sycamore St, Ottawa, IL 61350
$-621
Cash flow
-13.1%
Cash-on-Cash Return
2.7%
Cap rate
0.5%
Rent to Value Ratio
Active
$112,000
2
bds
|
1
ba
|
1,149
sqft
|
built
1880
1223 Putnam St, Peru, IL 61354
$247
Cash flow
11.5%
Cash-on-Cash Return
8.3%
Cap rate
1.3%
Rent to Value Ratio
Active
$150,000
3
bds
|
1
ba
|
1,056
sqft
|
built
430 N 2nd St, Tonica, IL 61370
$-72
Cash flow
-2.5%
Cash-on-Cash Return
5.1%
Cap rate
0.9%
Rent to Value Ratio
Active
$249,900
3
bds
|
2
ba
|
1,008
sqft
|
built
1974
312 Water St, Earlville, IL 60518
$-563
Cash flow
-11.8%
Cash-on-Cash Return
3.0%
Cap rate
0.6%
Rent to Value Ratio
Active
$150,000
3
bds
|
1
ba
|
1,358
sqft
|
built
1956
2001 Eastwood Ave, Streator, IL 61364
$197
Cash flow
6.9%
Cash-on-Cash Return
7.3%
Cap rate
1.1%
Rent to Value Ratio