Mc Henry County Investment Properties for Sale
Browse homes for sale and investment properties in Mc Henry County. Refine your search by price, property type, or more.
Best cash flowing properties in Mc Henry County
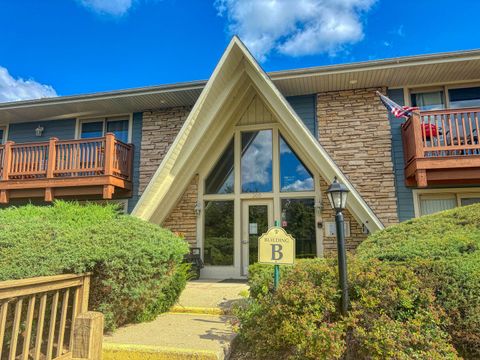
Active
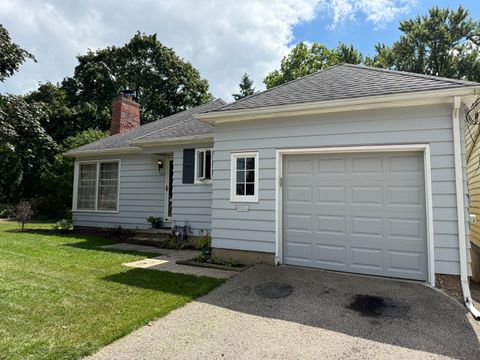
$84,900
1
bds
|
1
ba
|
970
sqft
|
built
1973
15810 Il Route 173, Harvard, IL 60033
$-87
Cash flow
-5.3%
Cash-on-Cash Return
4.5%
Cap rate
1.2%
Rent to Value Ratio
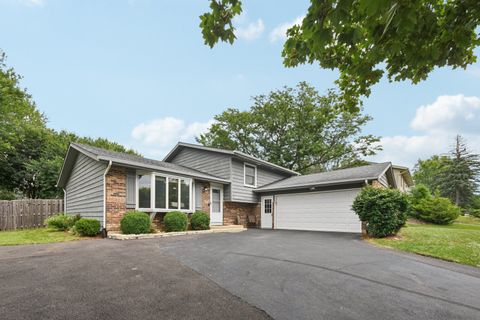
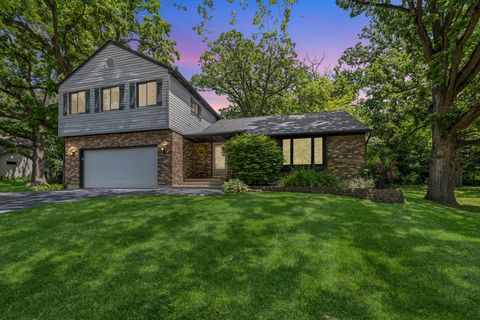
Active
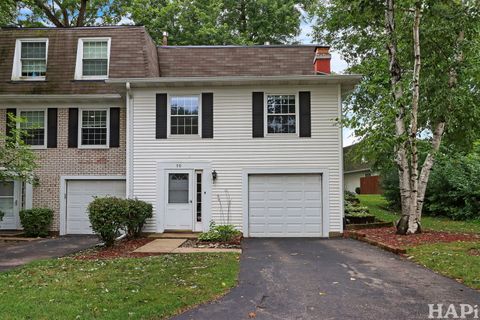
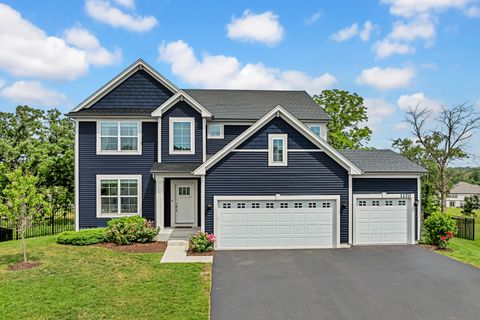
$399,900
3
bds
|
3
ba
|
2,452
sqft
|
built
1977
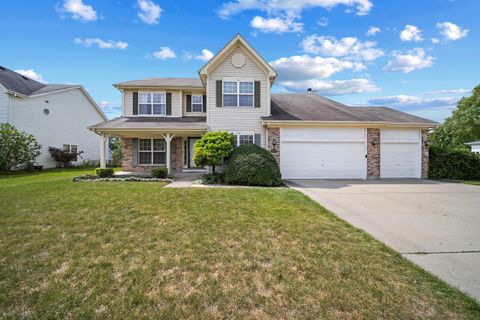
610 Chelsea Dr, Algonquin, IL 60102
$-220
Cash flow
-2.9%
Cash-on-Cash Return
5.0%
Cap rate
0.8%
Rent to Value Ratio
180 out of 283 properties for sale in Mc Henry County
Limited Results Shown
Create a free account, or log in to reveal all property listings and enjoy the complete experience.
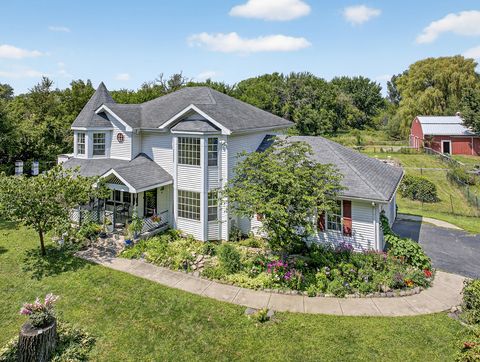
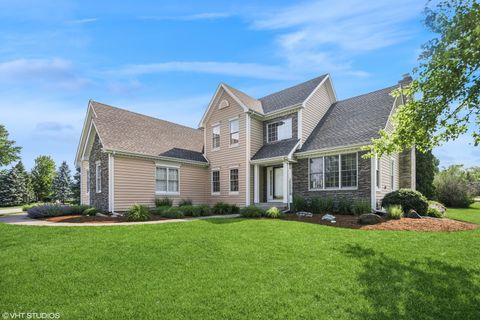
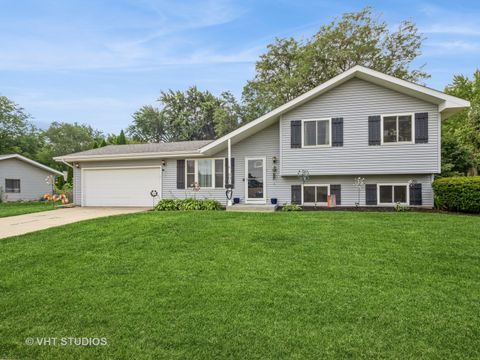
Active
$575,000
3
bds
|
3
ba
|
2,456
sqft
|
built
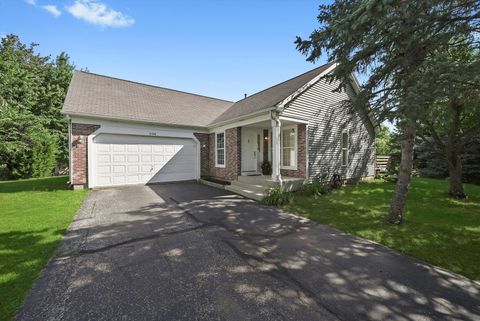
1995
17804 Kunde Rd, Union, IL 60180
$-1,153
Cash flow
-10.5%
Cash-on-Cash Return
3.3%
Cap rate
0.6%
Rent to Value Ratio
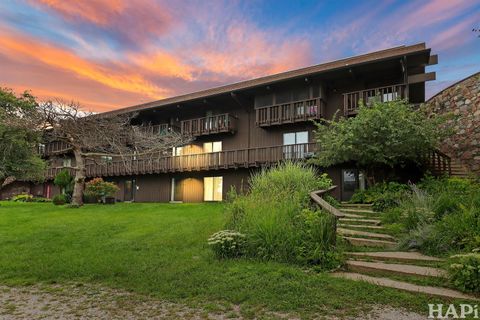
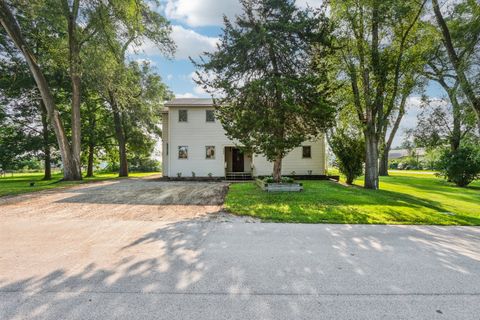
Active
$160,000
1
bds
|
1
ba
|
696
sqft
|
built
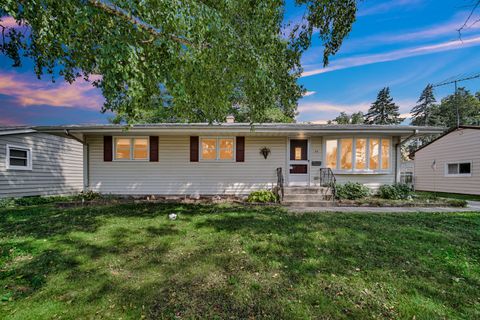
1967
300 Opatrny Dr, Fox River Grove, IL 60021
$-445
Cash flow
-14.5%
Cash-on-Cash Return
2.3%
Cap rate
0.9%
Rent to Value Ratio
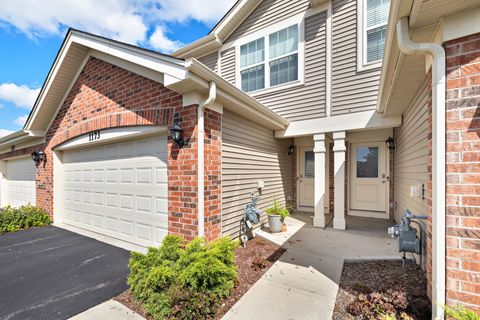
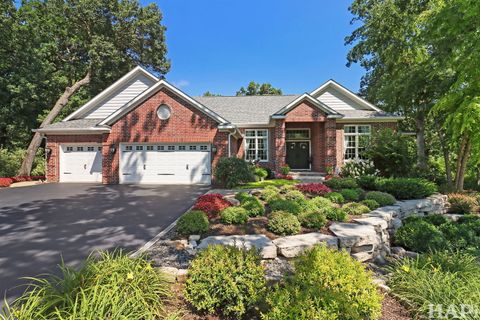
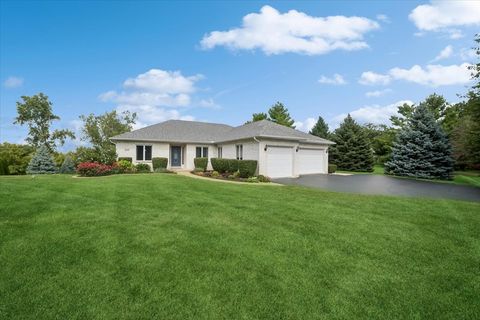
Active
$319,900
2
bds
|
3
ba
|
1,359
sqft
|
built
2021
1173 Amber Dr, Cary, IL 60013
$-481
Cash flow
-7.8%
Cash-on-Cash Return
3.9%
Cap rate
0.8%
Rent to Value Ratio
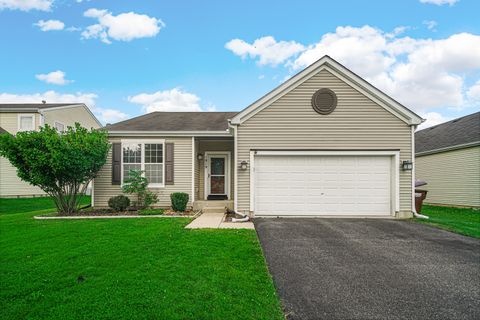
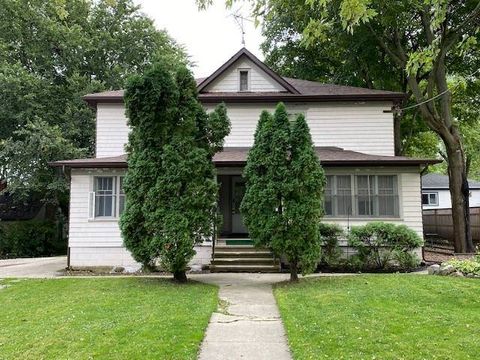
Active
$320,000
3
bds
|
3
ba
|
1,466
sqft
|
built
2007
1819 Woodside Dr, Woodstock, IL 60098
$-548
Cash flow
-8.9%
Cash-on-Cash Return
3.6%
Cap rate
0.7%
Rent to Value Ratio
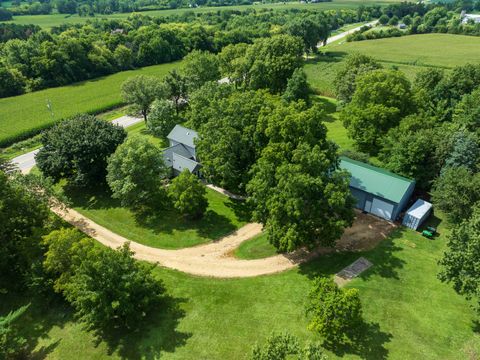
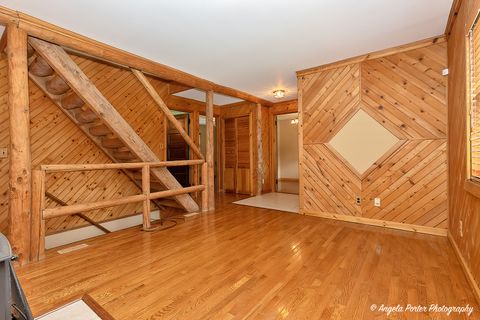
Active
$599,900
3
bds
|
2
ba
|
1,750
sqft
|
built
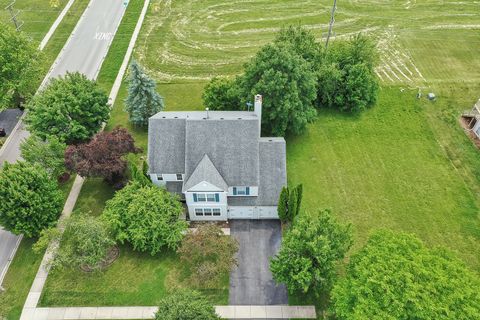
4608 Alden Rd, Woodstock, IL 60098
$-1,864
Cash flow
-16.2%
Cash-on-Cash Return
2.0%
Cap rate
0.3%
Rent to Value Ratio
Active
$409,900
4
bds
|
4
ba
|
2,380
sqft
|
built
1982
3619 Overlook Dr, Richmond, IL 60071
$-693
Cash flow
-8.8%
Cash-on-Cash Return
3.7%
Cap rate
0.6%
Rent to Value Ratio
Active
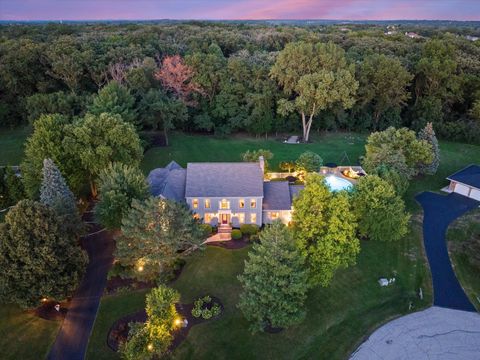
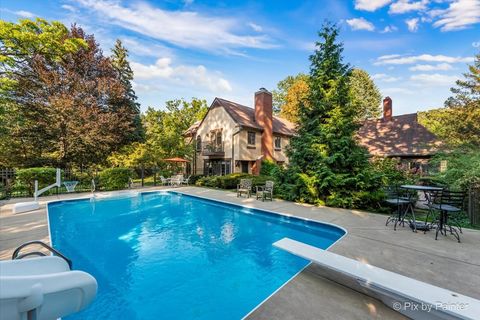
$855,000
5
bds
|
4
ba
|
3,902
sqft
|
built
1987
3218 Opengate Rd, Crystal Lake, IL 60012
$-2,450
Cash flow
-15.0%
Cash-on-Cash Return
2.2%
Cap rate
0.5%
Rent to Value Ratio
Active
$1,075,000
4
bds
|
4
ba
|
4,497
sqft
|
built
1935
4915 Terra Cotta Rd, Crystal Lake, IL 60012
$-1,551
Cash flow
-7.5%
Cash-on-Cash Return
3.9%
Cap rate
0.7%
Rent to Value Ratio
Active
$299,000
4
bds
|
2
ba
|
1,060
sqft
|
built
1936
125 Forrest Ave, Woodstock, IL 60098
$-472
Cash flow
-8.2%
Cash-on-Cash Return
3.8%
Cap rate
0.7%
Rent to Value Ratio
Active
$224,900
3
bds
|
3
ba
|
1,357
sqft
|
built
1973
50 Bright Oaks Cir, Cary, IL 60013
$-289
Cash flow
-6.7%
Cash-on-Cash Return
4.1%
Cap rate
0.9%
Rent to Value Ratio
Active
$399,900
2
bds
|
2
ba
|
1,677
sqft
|
built
2005
14038 Westmore Rd, Huntley, IL 60142
$-556
Cash flow
-7.3%
Cash-on-Cash Return
4.0%
Cap rate
0.6%
Rent to Value Ratio
Active
$359,900
5
bds
|
2
ba
|
2,223
sqft
|
built
1979
354 Millard Ave, Crystal Lake, IL 60014
$-422
Cash flow
-6.1%
Cash-on-Cash Return
4.3%
Cap rate
0.8%
Rent to Value Ratio
Active
$524,900
4
bds
|
3
ba
|
3,346
sqft
|
built
2021
10718 Hunt Club Rd, Richmond, IL 60071
$-1,366
Cash flow
-13.6%
Cash-on-Cash Return
2.6%
Cap rate
0.5%
Rent to Value Ratio
Active
$569,999
4
bds
|
3
ba
|
4,371
sqft
|
built
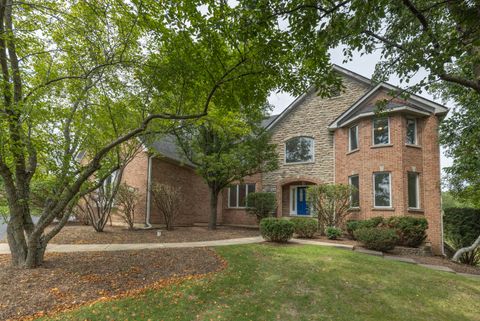
2002
1839 Kings Gate Ln, Crystal Lake, IL 60014
$-1,847
Cash flow
-16.9%
Cash-on-Cash Return
1.8%
Cap rate
0.5%
Rent to Value Ratio
Active
$385,000
2
bds
|
2
ba
|
1,245
sqft
|
built
2023
1101 Black Cherry Dr, Crystal Lake, IL 60012
$-685
Cash flow
-9.3%
Cash-on-Cash Return
3.5%
Cap rate
0.8%
Rent to Value Ratio
Active
$519,000
4
bds
|
3
ba
|
3,400
sqft
|
built
2006
11581 Beacon Ave, Huntley, IL 60142
$-941
Cash flow
-9.5%
Cash-on-Cash Return
3.5%
Cap rate
0.7%
Rent to Value Ratio
Active
$475,000
3
bds
|
2
ba
|
1,734
sqft
|
built
2021
9101 Marks Ct, Huntley, IL 60142
$-576
Cash flow
-6.3%
Cash-on-Cash Return
4.2%
Cap rate
0.7%
Rent to Value Ratio
Active
$960,000
3
bds
|
2
ba
|
3,000
sqft
|
built
1994
17515 Deep Cut Rd, Woodstock, IL 60098
$-2,507
Cash flow
-13.6%
Cash-on-Cash Return
2.5%
Cap rate
0.5%
Rent to Value Ratio
Active
$429,000
3
bds
|
3
ba
|
2,064
sqft
|
built
1982
4816 Hickory Way, Johnsburg, IL 60051
$-740
Cash flow
-9.0%
Cash-on-Cash Return
3.6%
Cap rate
0.7%
Rent to Value Ratio
Active
$599,000
4
bds
|
4
ba
|
2,921
sqft
|
built
2000
9310 Nicklaus Ln, Crystal Lake, IL 60014
$-1,178
Cash flow
-10.3%
Cash-on-Cash Return
3.3%
Cap rate
0.6%
Rent to Value Ratio
Active
$899,000
3
bds
|
4
ba
|
2,690
sqft
|
built
2007
9436 Bellaire Ln, Spring Grove, IL 60081
$-2,760
Cash flow
-16.0%
Cash-on-Cash Return
2.0%
Cap rate
0.4%
Rent to Value Ratio
Active
$385,000
6
bds
|
2
ba
|
0
sqft
|
built
1920
415 Dean St, Woodstock, IL 60098
$-714
Cash flow
-9.7%
Cash-on-Cash Return
3.5%
Cap rate
0.6%
Rent to Value Ratio
Active
$500,000
4
bds
|
4
ba
|
2,838
sqft
|
built
2000
1168 Sandalwood Ln, Crystal Lake, IL 60014
$-1,522
Cash flow
-15.9%
Cash-on-Cash Return
2.0%
Cap rate
0.5%
Rent to Value Ratio
Active
$325,000
3
bds
|
2
ba
|
1,152
sqft
|
built
1993
2108 Aspen Dr, Woodstock, IL 60098
$-844
Cash flow
-13.5%
Cash-on-Cash Return
2.6%
Cap rate
0.6%
Rent to Value Ratio
Active
$453,400
4
bds
|
3
ba
|
2,446
sqft
|
built
1996
179 Cascade Dr, Crystal Lake, IL 60012
$-842
Cash flow
-9.7%
Cash-on-Cash Return
3.5%
Cap rate
0.7%
Rent to Value Ratio
Active
$325,000
3
bds
|
2
ba
|
2,258
sqft
|
built
1962
26 Wagner Dr, Cary, IL 60013
$-635
Cash flow
-10.2%
Cash-on-Cash Return
3.3%
Cap rate
0.6%
Rent to Value Ratio
Active
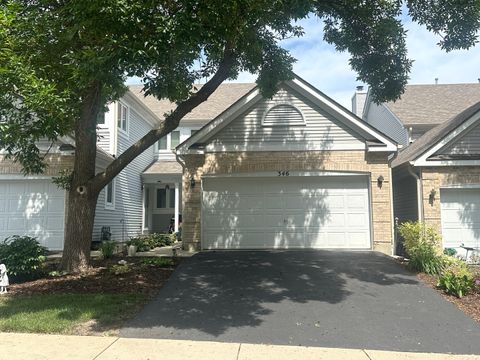
$319,900
2
bds
|
3
ba
|
2,202
sqft
|
built
1993
346 Bristol Ln, Fox River Grove, IL 60021
$-569
Cash flow
-9.3%
Cash-on-Cash Return
3.5%
Cap rate
0.9%
Rent to Value Ratio
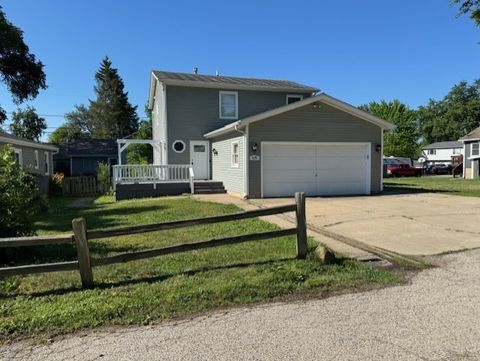
Active
$329,000
3
bds
|
2
ba
|
1,568
sqft
|
built
1990
425 Northlake Rd, Lakemoor, IL 60051
$-333
Cash flow
-5.3%
Cash-on-Cash Return
4.5%
Cap rate
0.7%
Rent to Value Ratio
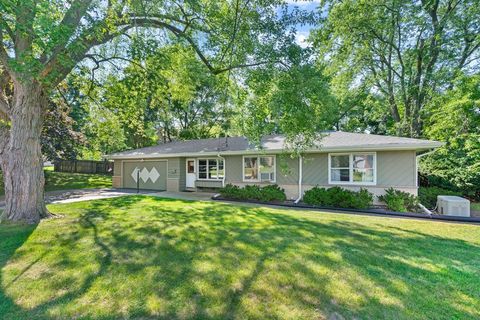
Active
$310,000
3
bds
|
3
ba
|
1,620
sqft
|
built
1962
233 Arthur Dr, Woodstock, IL 60098
$-667
Cash flow
-11.2%
Cash-on-Cash Return
3.1%
Cap rate
0.7%
Rent to Value Ratio
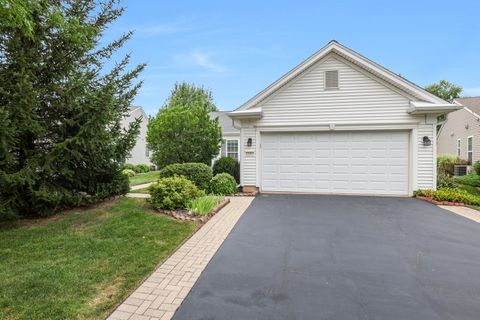
Active
$409,000
2
bds
|
2
ba
|
1,714
sqft
|
built
2004
11993 Harrison Rd, Huntley, IL 60142
$-891
Cash flow
-11.4%
Cash-on-Cash Return
3.1%
Cap rate
0.6%
Rent to Value Ratio
Active
$619,900
4
bds
|
3
ba
|
2,669
sqft
|
built
2022
1170 Overhill Ct, Crystal Lake, IL 60012
$-1,351
Cash flow
-11.4%
Cash-on-Cash Return
3.1%
Cap rate
0.7%
Rent to Value Ratio
Active
$365,000
3
bds
|
2
ba
|
1,530
sqft
|
built
1972
901 Aberdeen Dr, Crystal Lake, IL 60014
$-605
Cash flow
-8.6%
Cash-on-Cash Return
3.7%
Cap rate
0.7%
Rent to Value Ratio
Active
$330,000
3
bds
|
3
ba
|
2,271
sqft
|
built
1995
4204 East Dr, Wonder Lake, IL 60097
$-257
Cash flow
-4.1%
Cash-on-Cash Return
4.7%
Cap rate
0.8%
Rent to Value Ratio
Active
$699,000
5
bds
|
4
ba
|
5,944
sqft
|
built
2005
2620 Rolling Oaks Rd, Spring Grove, IL 60081
$-1,589
Cash flow
-11.9%
Cash-on-Cash Return
3.0%
Cap rate
0.6%
Rent to Value Ratio
Active
$1,190,000
3
bds
|
4
ba
|
3,484
sqft
|
built
2005
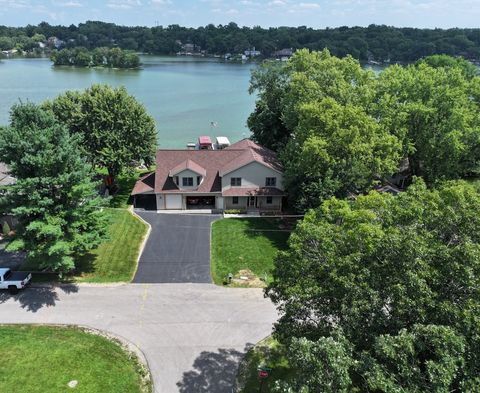
5012 W Lake Shore Dr, Wonder Lake, IL 60097
$-4,611
Cash flow
-20.2%
Cash-on-Cash Return
1.0%
Cap rate
0.3%
Rent to Value Ratio
Active
$770,000
4
bds
|
5
ba
|
6,134
sqft
|
built
2001
3702 W Homestead Trl, Crystal Lake, IL 60012
$-1,683
Cash flow
-11.4%
Cash-on-Cash Return
3.1%
Cap rate
0.7%
Rent to Value Ratio
Active
$374,900
3
bds
|
1
ba
|
1,572
sqft
|
built
1917
2016 Grove Ln, Cary, IL 60013
$-940
Cash flow
-13.1%
Cash-on-Cash Return
2.7%
Cap rate
0.6%
Rent to Value Ratio
Active
$369,800
4
bds
|
2
ba
|
2,420
sqft
|
built
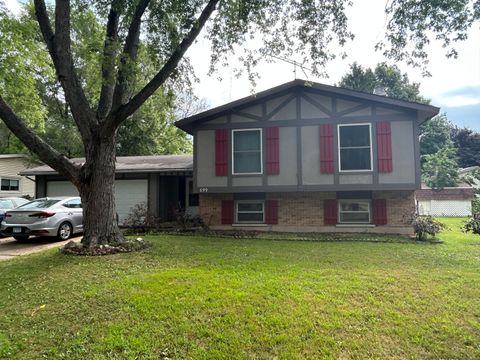
1969
699 Darlington Ln, Crystal Lake, IL 60014
$-997
Cash flow
-14.1%
Cash-on-Cash Return
2.4%
Cap rate
0.5%
Rent to Value Ratio