Mc Lean County Investment Properties for Sale
Browse homes for sale and investment properties in Mc Lean County. Refine your search by price, property type, or more.
Best cash flowing properties in Mc Lean County
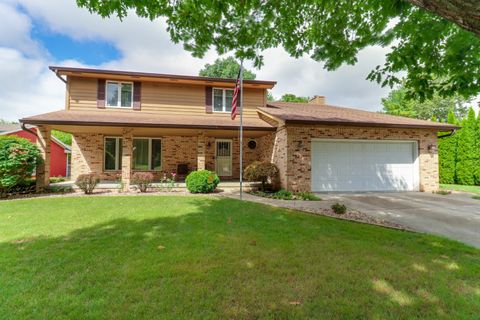
Active
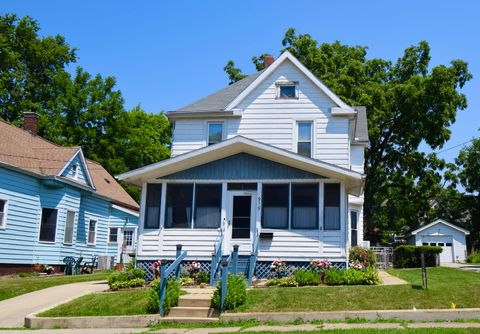
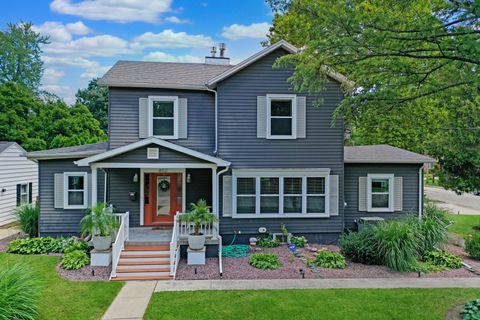
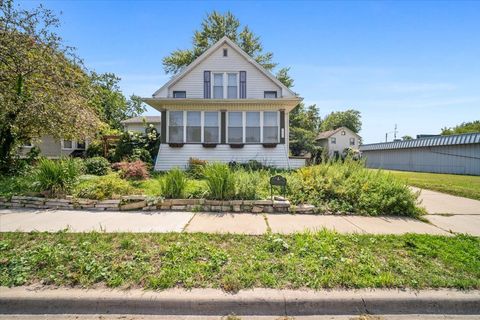
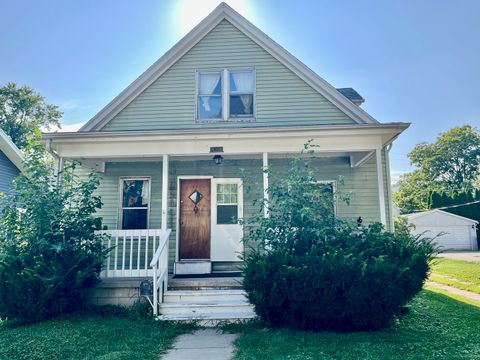
$149,900
3
bds
|
2
ba
|
1,804
sqft
|
built
1925
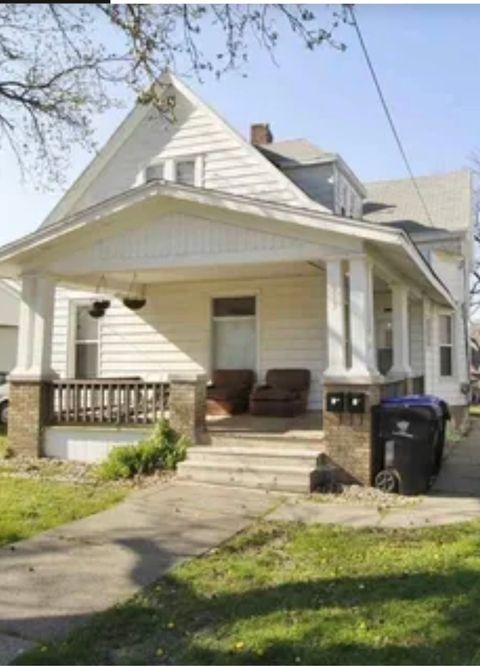
915 W Olive St, Bloomington, IL 61701
$552
Cash flow
19.2%
Cash-on-Cash Return
10.1%
Cap rate
1.3%
Rent to Value Ratio
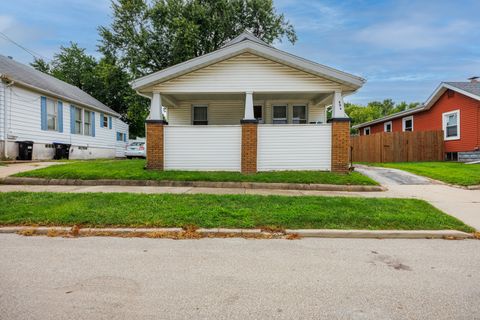
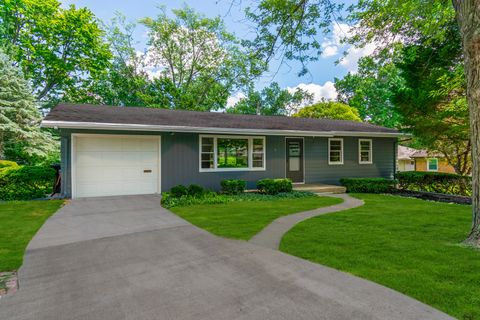
Active
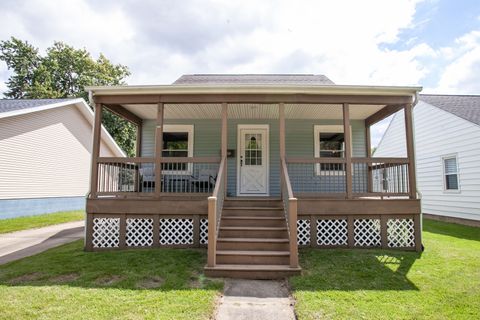
$99,900
2
bds
|
1
ba
|
768
sqft
|
built
1925
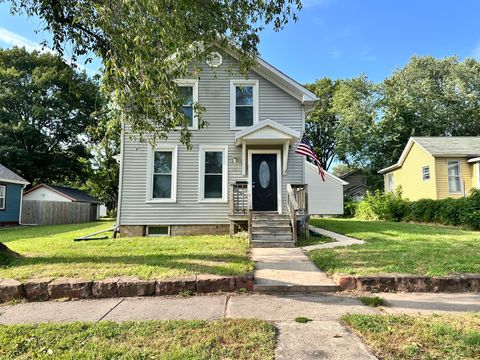
506 W Bissell St, Bloomington, IL 61701
$540
Cash flow
28.2%
Cash-on-Cash Return
12.2%
Cap rate
1.6%
Rent to Value Ratio
131 out of 145 properties for sale in Mc Lean County
Limited Results Shown
Create a free account, or log in to reveal all property listings and enjoy the complete experience.
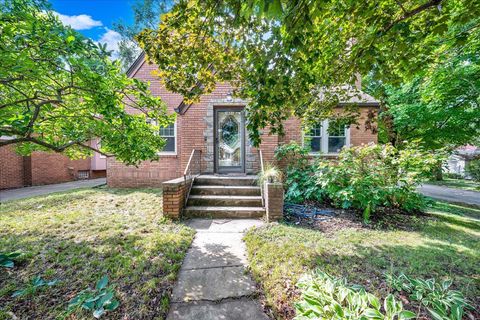
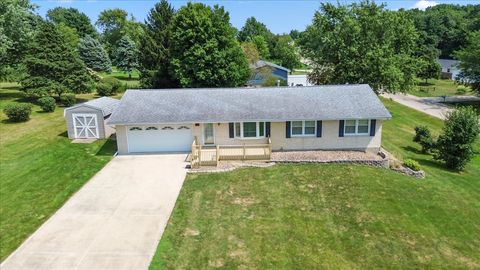
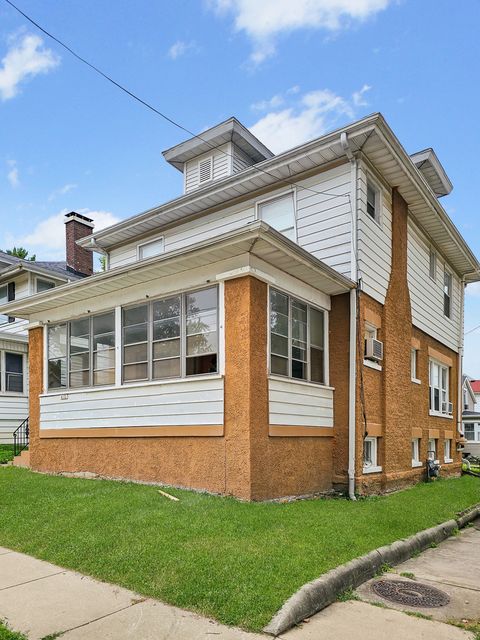
Active
$235,000
4
bds
|
2
ba
|
3,177
sqft
|
built
1955
1601 E Oakland Ave, Bloomington, IL 61701
$4
Cash flow
0.1%
Cash-on-Cash Return
5.7%
Cap rate
1.0%
Rent to Value Ratio
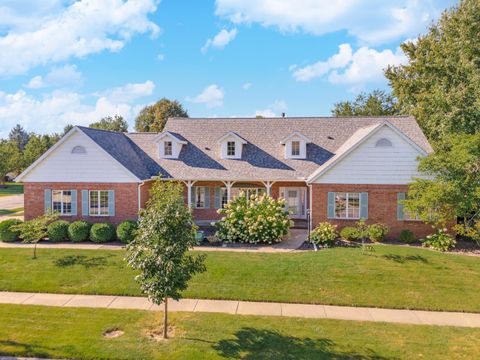
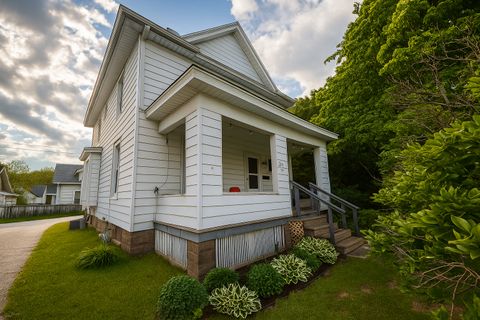
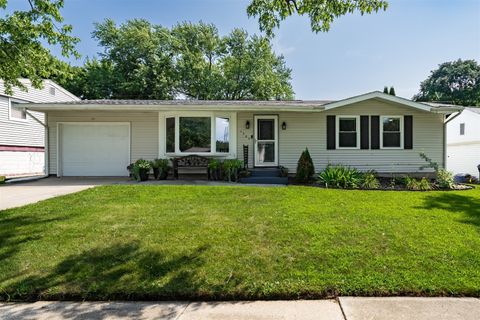
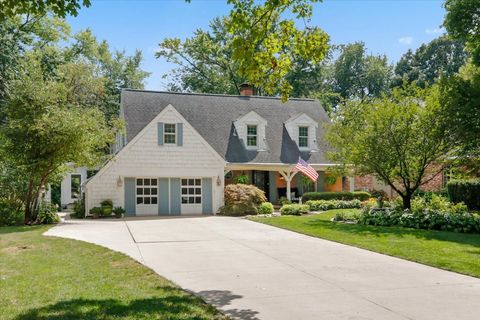
Active
$439,900
3
bds
|
4
ba
|
4,638
sqft
|
built
1989
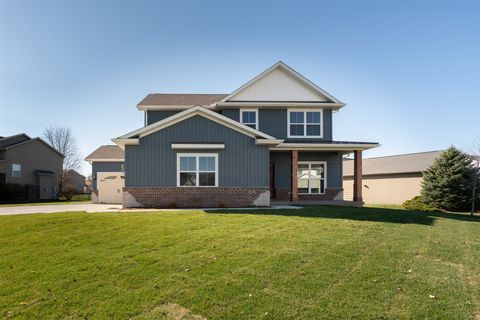
41 Ravenwood Cir, Bloomington, IL 61704
$-974
Cash flow
-11.6%
Cash-on-Cash Return
3.0%
Cap rate
0.7%
Rent to Value Ratio
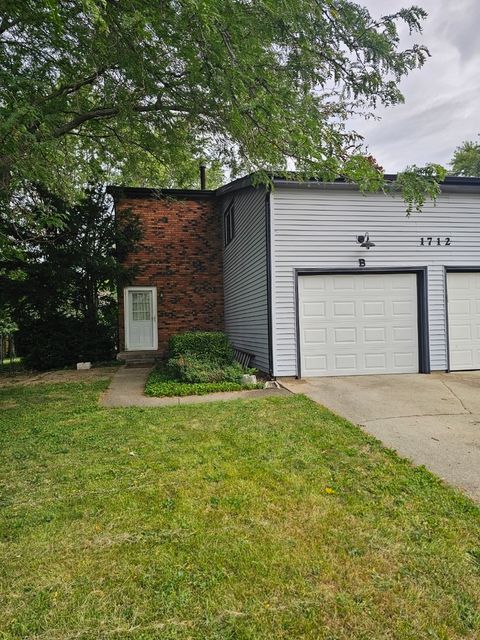
Active
$180,000
3
bds
|
2
ba
|
1,813
sqft
|
built
1976
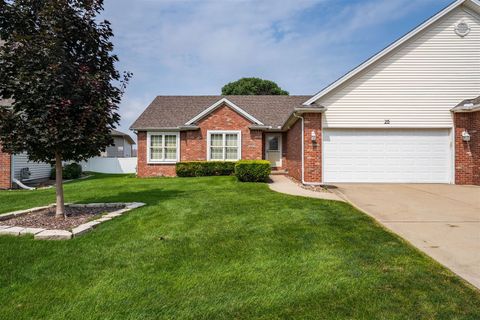
1712B Linda Ln, Normal, IL 61761
$195
Cash flow
5.7%
Cash-on-Cash Return
7.0%
Cap rate
1.0%
Rent to Value Ratio
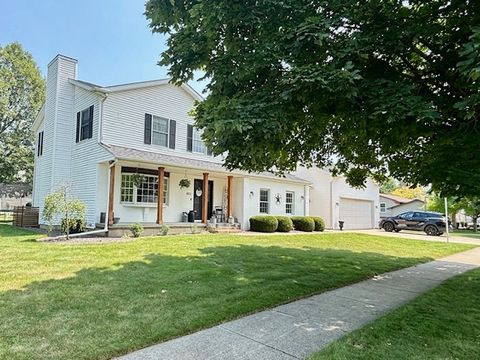
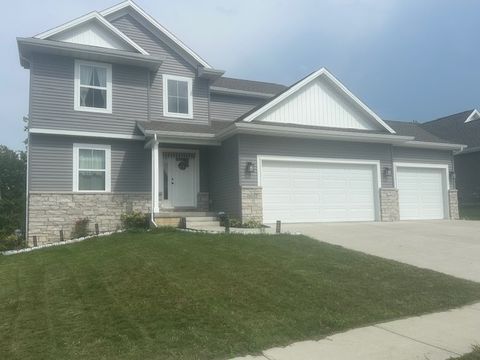
Active
$365,000
4
bds
|
4
ba
|
3,342
sqft
|
built
2002
3250 Topaz Rd, Normal, IL 61761
$-385
Cash flow
-5.5%
Cash-on-Cash Return
4.4%
Cap rate
0.8%
Rent to Value Ratio
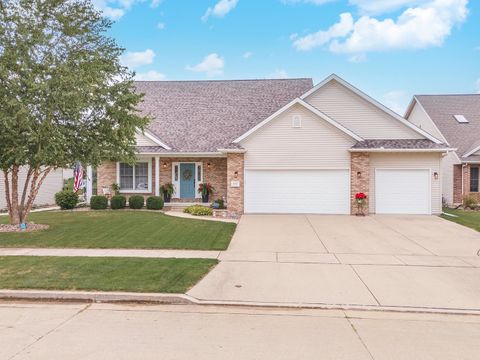
Active
$160,000
3
bds
|
3
ba
|
0
sqft
|
built
1962
412 N Roosevelt Ave, Bloomington, IL 61701
$90
Cash flow
2.9%
Cash-on-Cash Return
6.4%
Cap rate
0.9%
Rent to Value Ratio
Active
$155,000
4
bds
|
3
ba
|
0
sqft
|
built
1905
810 W Market St, Bloomington, IL 61701
$299
Cash flow
10.1%
Cash-on-Cash Return
8.0%
Cap rate
1.2%
Rent to Value Ratio
Active
$404,900
4
bds
|
4
ba
|
3,704
sqft
|
built
1925
802 S Mercer Ave, Bloomington, IL 61701
$-612
Cash flow
-7.9%
Cash-on-Cash Return
3.9%
Cap rate
0.7%
Rent to Value Ratio
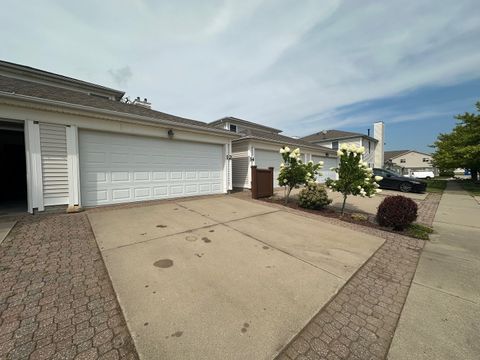
Active
$184,500
2
bds
|
1
ba
|
1,923
sqft
|
built
1955
1313 E Oakland Ave, Bloomington, IL 61701
$-41
Cash flow
-1.2%
Cash-on-Cash Return
5.4%
Cap rate
0.9%
Rent to Value Ratio
Active
$260,000
3
bds
|
2
ba
|
2,430
sqft
|
built
1977
14513 Saturn Cir, Bloomington, IL 61705
$-209
Cash flow
-4.2%
Cash-on-Cash Return
4.7%
Cap rate
0.8%
Rent to Value Ratio
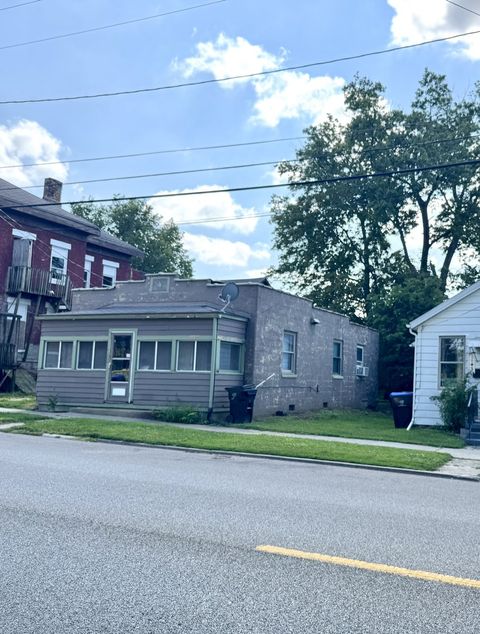
Active
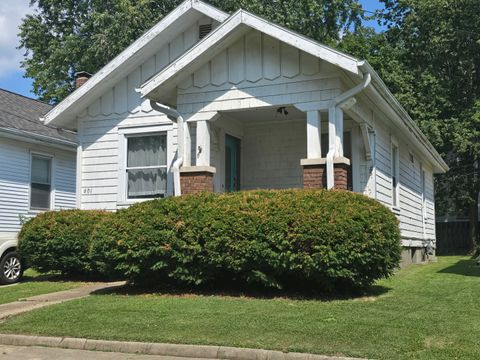
$136,900
2
bds
|
2
ba
|
0
sqft
|
built
1925
1309 S Main St, Bloomington, IL 61701
$379
Cash flow
14.4%
Cash-on-Cash Return
9.0%
Cap rate
1.3%
Rent to Value Ratio
Active
$375,000
4
bds
|
3
ba
|
3,708
sqft
|
built
1987
1005 S Hershey Rd, Bloomington, IL 61704
$-624
Cash flow
-8.7%
Cash-on-Cash Return
3.7%
Cap rate
0.7%
Rent to Value Ratio
Active
$214,900
3
bds
|
2
ba
|
2,114
sqft
|
built
1957
1 Gary Ct, Normal, IL 61761
$-5
Cash flow
-0.1%
Cash-on-Cash Return
5.7%
Cap rate
0.8%
Rent to Value Ratio
Active
$195,000
3
bds
|
3
ba
|
0
sqft
|
built
1920
410 N Mc Lean St, Bloomington, IL 61701
$96
Cash flow
2.6%
Cash-on-Cash Return
6.3%
Cap rate
0.9%
Rent to Value Ratio
Active
$225,000
3
bds
|
2
ba
|
2,265
sqft
|
built
1965
1309 Dogwood Ln, Bloomington, IL 61704
$-123
Cash flow
-2.9%
Cash-on-Cash Return
5.0%
Cap rate
0.8%
Rent to Value Ratio
Active
$415,000
4
bds
|
4
ba
|
3,611
sqft
|
built
1995
1 Scofield Ct, Bloomington, IL 61704
$-846
Cash flow
-10.6%
Cash-on-Cash Return
3.2%
Cap rate
0.7%
Rent to Value Ratio
Active
$365,000
4
bds
|
3
ba
|
2,256
sqft
|
built
2017
1036 Stags Leap Rd, Normal, IL 61761
$-713
Cash flow
-10.2%
Cash-on-Cash Return
3.3%
Cap rate
0.7%
Rent to Value Ratio
Active
$330,000
4
bds
|
4
ba
|
2,846
sqft
|
built
1992
2 Blue Lake Ct, Bloomington, IL 61704
$-440
Cash flow
-7.0%
Cash-on-Cash Return
4.1%
Cap rate
0.8%
Rent to Value Ratio
Active
$140,000
2
bds
|
1
ba
|
850
sqft
|
built
1976
54 Brandywine Ct, Bloomington, IL 61704
$-135
Cash flow
-5.0%
Cash-on-Cash Return
4.5%
Cap rate
1.1%
Rent to Value Ratio
Active
$199,000
3
bds
|
2
ba
|
2,268
sqft
|
built
1925
1205 E Oakland Ave, Bloomington, IL 61701
$150
Cash flow
3.9%
Cash-on-Cash Return
6.6%
Cap rate
1.0%
Rent to Value Ratio
Active
$650,000
4
bds
|
5
ba
|
4,402
sqft
|
built
1962
17 Sunset Rd, Bloomington, IL 61701
$-1,262
Cash flow
-10.1%
Cash-on-Cash Return
3.3%
Cap rate
0.6%
Rent to Value Ratio
Active
$349,000
4
bds
|
3
ba
|
3,044
sqft
|
built
1994
803 N East St, Hudson, IL 61748
$-461
Cash flow
-6.9%
Cash-on-Cash Return
4.1%
Cap rate
0.7%
Rent to Value Ratio
Active
$479,900
4
bds
|
4
ba
|
4,369
sqft
|
built
2002
3107 Sable Oaks Rd, Bloomington, IL 61704
$-961
Cash flow
-10.4%
Cash-on-Cash Return
3.3%
Cap rate
0.7%
Rent to Value Ratio
Active
$295,000
3
bds
|
6
ba
|
2,652
sqft
|
built
1998
213 Field Dr, Normal, IL 61761
$-251
Cash flow
-4.4%
Cash-on-Cash Return
4.7%
Cap rate
0.7%
Rent to Value Ratio
Active
$99,600
2
bds
|
1
ba
|
840
sqft
|
built
1910
601 N Allin St, Bloomington, IL 61701
$188
Cash flow
9.8%
Cash-on-Cash Return
7.9%
Cap rate
1.2%
Rent to Value Ratio
Active
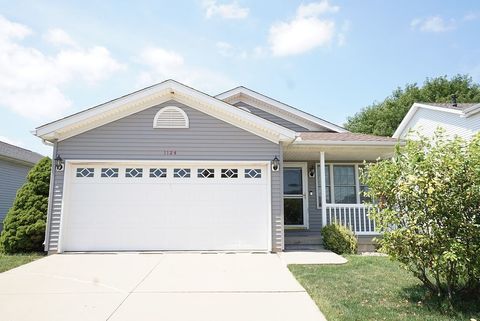
$266,900
2
bds
|
2
ba
|
2,472
sqft
|
built
2001
1124 Rader Run, Bloomington, IL 61704
$-216
Cash flow
-4.2%
Cash-on-Cash Return
4.7%
Cap rate
0.8%
Rent to Value Ratio
Active
$215,000
5
bds
|
2
ba
|
2,337
sqft
|
built
1910
1001 N Lee St, Bloomington, IL 61701
$125
Cash flow
3.0%
Cash-on-Cash Return
6.4%
Cap rate
0.9%
Rent to Value Ratio
Active
$110,000
3
bds
|
2
ba
|
1,246
sqft
|
built
1925
403 Willard Ave, Bloomington, IL 61701
$516
Cash flow
24.5%
Cash-on-Cash Return
11.3%
Cap rate
1.6%
Rent to Value Ratio
Active
$419,000
3
bds
|
3
ba
|
1,974
sqft
|
built
2023
2512 Savanna Rd, Bloomington, IL 61705
$-827
Cash flow
-10.3%
Cash-on-Cash Return
3.3%
Cap rate
0.7%
Rent to Value Ratio
Active
$211,000
2
bds
|
3
ba
|
1,462
sqft
|
built
1997
12 Yotzonot Dr, Bloomington, IL 61704
$26
Cash flow
0.6%
Cash-on-Cash Return
5.8%
Cap rate
0.9%
Rent to Value Ratio
Active
$144,900
2
bds
|
2
ba
|
0
sqft
|
built
1925
500 N Lee St, Bloomington, IL 61701
$241
Cash flow
8.7%
Cash-on-Cash Return
7.7%
Cap rate
1.0%
Rent to Value Ratio
Active
$215,000
4
bds
|
2
ba
|
1,790
sqft
|
built
1974
7981 Johnson Ln, Downs, IL 61736
$122
Cash flow
3.0%
Cash-on-Cash Return
6.4%
Cap rate
0.9%
Rent to Value Ratio
Active
$172,500
3
bds
|
1
ba
|
1,036
sqft
|
built
1955
105 Conley Cir, Bloomington, IL 61701
$113
Cash flow
3.4%
Cash-on-Cash Return
6.5%
Cap rate
1.0%
Rent to Value Ratio
Active
$265,000
3
bds
|
4
ba
|
2,436
sqft
|
built
1987
505 Carriage Hills Rd, Normal, IL 61761
$-109
Cash flow
-2.1%
Cash-on-Cash Return
5.2%
Cap rate
0.9%
Rent to Value Ratio
Active
$194,900
2
bds
|
2
ba
|
1,290
sqft
|
built
2017
508 N 4th Ave, Chenoa, IL 61726
$-43
Cash flow
-1.2%
Cash-on-Cash Return
5.4%
Cap rate
1.0%
Rent to Value Ratio
Active
$542,000
4
bds
|
3
ba
|
2,209
sqft
|
built
2022
3601 Napa Ln, Normal, IL 61761
$-2,161
Cash flow
-20.8%
Cash-on-Cash Return
0.9%
Cap rate
0.4%
Rent to Value Ratio
Active
$159,900
5
bds
|
3
ba
|
0
sqft
|
built
1925
913 W Grove St, Bloomington, IL 61701
$17
Cash flow
0.6%
Cash-on-Cash Return
5.8%
Cap rate
0.9%
Rent to Value Ratio
Active
$159,900
4
bds
|
2
ba
|
1,278
sqft
|
built
1925
408 E Mill St, Bloomington, IL 61701
$287
Cash flow
9.4%
Cash-on-Cash Return
7.8%
Cap rate
1.1%
Rent to Value Ratio
Active
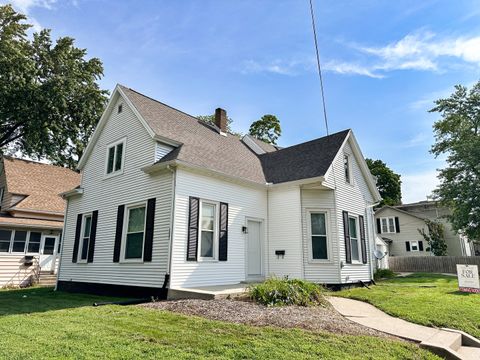
$149,900
3
bds
|
2
ba
|
1,512
sqft
|
built
1897
912 S Madison St, Bloomington, IL 61701
$395
Cash flow
13.7%
Cash-on-Cash Return
8.8%
Cap rate
1.3%
Rent to Value Ratio